Study of the Insect Order Lepidoptera (Moths and
Butterflies)
Jerome C. Regier1,2*, Charles Mitter2*, Andreas Zwick3, Adam L. Bazinet4, Michael P. Cummings4, Akito Y. Kawahara5, Jae-Cheon Sohn2, Derrick J. Zwickl6, Soowon Cho7, Donald R. Davis8,
Joaquin Baixeras9, John Brown10, Cynthia Parr11, Susan Weller12, David C. Lees13, Kim T. Mitter2 1Institute for Bioscience and Biotechnology Research, University of Maryland, College Park, Maryland, United States of America,2Department of Entomology, University of Maryland, College Park, Maryland, United States of America,3Entomology, State Museum of Natural History, Stuttgart, Germany,4Laboratory of Molecular Evolution, Center for Bioinformatics and Computational Biology, University of Maryland, College Park, Maryland, United States of America,5Florida Museum of Natural History, Gainesville, Florida, United States of America,6Department of Ecology and Evolutionary Biology, University of Arizona, Tucson, Arizona, United States of America,
7Department of Plant Medicine, Chungbuk National University, Cheongju, Korea,8Department of Entomology, Smithsonian Institution, Washington, District of Columbia, United States of America,9Cavanilles Institute of Biodiversity and Evolutionary Biology, University of Valencia, Valencia, Spain,10Systematic Entomology Lab, Agricultural Research Service, United States Department of Agriculture, Beltsville, Maryland, United States of America,11Encyclopedia of Life, Smithsonian Institution, Washington, District of Columbia, United States of America,12Department of Entomology, University of Minnesota, Saint Paul, Minnesota, United States of America,13Department of Life Sciences, Natural History Museum, London, England
Abstract
Background:Higher-level relationships within the Lepidoptera, and particularly within the species-rich subclade Ditrysia, are generally not well understood, although recent studies have yielded progress. We present the most comprehensive molecular analysis of lepidopteran phylogeny to date, focusing on relationships among superfamilies.
Methodology / Principal Findings: 483 taxa spanning 115 of 124 families were sampled for 19 protein-coding nuclear genes, from which maximum likelihood tree estimates and bootstrap percentages were obtained using GARLI. Assessment of heuristic search effectiveness showed that better trees and higher bootstrap percentages probably remain to be discovered even after 1000 or more search replicates, but further search proved impractical even with grid computing. Other analyses explored the effects of sampling nonsynonymous change only versus partitioned and unpartitioned total nucleotide change; deletion of rogue taxa; and compositional heterogeneity. Relationships among the non-ditrysian lineages previously inferred from morphology were largely confirmed, plus some new ones, with strong support. Robust support was also found for divergences among non-apoditrysian lineages of Ditrysia, but only rarely so within Apoditrysia. Paraphyly for Tineoidea is strongly supported by analysis of nonsynonymous-only signal; conflicting, strong support for tineoid monophyly when synonymous signal was added back is shown to result from compositional heterogeneity.
Conclusions / Significance:Support for among-superfamily relationships outside the Apoditrysia is now generally strong. Comparable support is mostly lacking within Apoditrysia, but dramatically increased bootstrap percentages for some nodes after rogue taxon removal, and concordance with other evidence, strongly suggest that our picture of apoditrysian phylogeny is approximately correct. This study highlights the challenge of finding optimal topologies when analyzing hundreds of taxa. It also shows that some nodes get strong support only when analysis is restricted to nonsynonymous change, while total change is necessary for strong support of others. Thus, multiple types of analyses will be necessary to fully resolve lepidopteran phylogeny.
Citation:Regier JC, Mitter C, Zwick A, Bazinet AL, Cummings MP, et al. (2013) A Large-Scale, Higher-Level, Molecular Phylogenetic Study of the Insect Order Lepidoptera (Moths and Butterflies). PLoS ONE 8(3): e58568. doi:10.1371/journal.pone.0058568
Editor:Corrie S. Moreau, Field Museum of Natural History, United States of America
ReceivedDecember 20, 2012;AcceptedFebruary 5, 2013;PublishedMarch 12, 2013
This is an open-access article, free of all copyright, and may be freely reproduced, distributed, transmitted, modified, built upon, or otherwise used by anyone for any lawful purpose. The work is made available under the Creative Commons CC0 public domain dedication.
Funding:Financial support was provided by the U. S. National Science Foundation‘s Assembling the Tree of Life program, award numbers 1042845, 0531626, and 0531769. The funders had no role in study design, data collection and analysis, decision to publish, or preparation of the manuscript.
Competing Interests:The authors have declared that no competing interests exist. * E-mail: [email protected] (JCR); [email protected] (CM)
Introduction
Among the largest of insect orders, the Lepidoptera, with more than 157,000 described species [1], serve terrestrial ecosystems as major herbivores, pollinators, and prey [2]. They have major impact on humans as agricultural pests, but also provide important model systems for scientific enquiry [3]. However, the complexity
The current report, which builds on other recent studies ([4–6]; Figure 1), describes our search for robust support of higher-level lepidopteran relationships, particularly across families and super-families. In this effort, we have extensively sampled extant lepidopteran diversity -- 483 species representing 45 of 47 superfamilies, 115 of 124 families, and 303 of 332 subfamilies in the classification system of Kristensen [7]. In parallel, we [8–11] and others [12–15] have also begun a systematic description of intra-superfamily relationships, often obtaining robust support. Already, however, it is apparent that, generally speaking, higher-level lepidopteran relationships are more challenging to decipher than lower-level relationships, based on broadly weak support across the backbone of the lepidopteran tree in multiple multi-gene studies [4–6]. This may be because the earlier lepidopteran radiations, particularly within the clade Ditrysia, which constitutes approximately 98% of extant species diversity, have been rapid and occurred mostly by the Cretaceous. Rapid radiations typically give rise on phylograms to short internal branches, reflecting reduced phylogenetic signal. Generating sufficient phylogenetic signal to yield statistically significant support for these short branches can be challenging. This challenge is compounded when the nodes of interest subtend relatively long terminal branches, making the "multiple hits" problem more acute. Such is the case for the Ditrysia and likely for many other insect radiations [16].
Multiple strategies have been devised to deal with these challenges, and we have incorporated these into the current study. One strategy is to increase the size of the data set. The current study samples up to 19 protein-coding nuclear genes for each taxon, while our earlier 123-taxon study utilized only five [4]. A second strategy is to utilize the increasing availability of grid computing to enable more, and more thorough, heuristic searches. For the current study, grid computing has provided at least a hundred-fold increase in search capacity relative to some of our earlier studies (cf. [17] versus [4]). These first two strategies can only be implemented if, as a third strategy, suitable phylogenetic software is available and utilized. The current study takes advantage of the now grid-operable GARLI program [18,19], which, when performing maximum likelihood and bootstrap analyses, has already proved valuable for lepidopteran and arthropod phylogeny [4,6,8], and in a manner that does not tend towards overconfidence in interpreting node support values [20]. A fourth strategy is based on distinguishing synonymous and nonsynonymous change in character codings. For relatively recent lepidopteran divergences, say, within many families (e.g., [21], synonymous change, which accumulates more rapidly, provides an abundance of useful phylogenetic information, while that from the typically more slowly evolving nonsynonymous change is sparse. By contrast, for resolving Paleozoic- and Mesozoic-aged clades across Arthropoda, synonymous change is almost completely undecipherable due to multiple overlapping substitutions, and can even become misinformative due to evolving compositional heterogeneity, while nonsynonymous change can now contribute much useful signal, and remains less prone to compositional heterogeneity over this period [22–25]. In terms of divergence times, higher-level lepidopteran relationships likely present an intermediate situation, one in which both synonymous and nonsynonymous change are potentially useful, although not necessarily at the same nodes. For example, we have recently shown that nonsynonymous change provides strong support for a novel higher-level taxonomic group near the base of Ditrysia, namely, ’Ditrysia 2 (Tineoidea, Gracillarioidea,
Yponomeutoi-dea)’, but that overall support for this group largely disappears if synonymous change is included [6]. By contrast, the level of support for another higher-level grouping (i.e., ’Noctuoidea 2
Doidae’), although not as high, is significantly greater when synonymous change is included. Unfortunately, most backbone nodes within Ditrysia receive little support under either condition; hence, our speculation about rapid radiations. The current report provides a more elaborate and definitive test of the differential utilities of synonymous and nonsynonymous change, and partic-ularly of the (still controversial) hypothesis that analysis of nonsynonymous change alone can yield improved confidence of some higher-level lepidopteran groups. The novelty of the current test resides in an almost fourfold increase in number of taxa sampled and a doubling of the amount of sequence per taxon.
Results
On recovering the maximum-likelihood topology
With 483 taxa in the present study, a heuristic, rather than exhaustive, search for the topology of highest likelihood is a practical necessity. Previously [4], we described and utilized a metric to estimate how many search replicates would be required in order to have 95% confidence that the recovered topology of highest likelihood is the "best-feasible" topology. This metric is based on the frequency of recovering the topology of apparent highest likelihood. However, after performing 4608 search replicates on the full 483-taxon, 19-gene, nt123_degen1 data set (see Materials and Methods for a description of the degen1 approach), even the top two trees differed -- at 13 out of the 481 internal nodes (Figure 2) -- so a confidence estimate could not be assigned. Instead, we extended our search for an improved topology by using the tree of highest likelihood (lnL = -583,900.053394) from the 4608 searches as a starting tree for 561 additional search replicates. Now, a new best topology (lnL = -583,898.838616) was recovered 248 times that differs from the starting topology in the placement of only one taxon, although multiple nodes in that highly localized region of the tree are thereby affected relative to the starting topology (Figure 2). It is reasonable to expect that this new topology would have been the best-feasible topology if the original search had been extended, although of course we have not demonstrated this.
An interesting aspect of the search for an overall best-feasible degen1topology is that the recovery of some nodes requires, on average, more search replicates of the full data set than others. To illustrate this, we have compared strict consensuses of subsets of the 4608 topologies with lnL scores that are within 10-4%, 10-3%, and 10-2% of the best topology, that is, the one shown in Figure 2. The number of such topologies (always including the best one) are 2, 19, and 1827, respectively. Of particular relevance to this report is that many of the high-interest backbone nodes in Ditrysia are relatively difficult to recover; that is, they are not recovered in the strict consensus of the top 10-3% of all topologies. As a correlate, many hard-to-recover nodes, including all of those along the backbone, have low (i.e.,,50%) bootstrap support, but elsewhere in the tree there are a few examples of nodes with low bootstrap support that are not hard-to-recover, and there are numerous examples of difficult-to-recover groups that do have bootstrap
None of the 13 nodes that differ between the top two topologies (i.e., the top 10-4%) have bootstraps$50%.
A less-extensive analysis of the 483-taxon, 19-gene,nt123data set (based on 977 search replicates) again demonstrates the challenge of finding a best-feasible topology. For example, a strict consensus of the three topologies within 10-4 % of the best topology (lnL = -2,429,912.231878) has eight collapsed nodes (results not shown).
On calculating bootstrap percentages
Two factors were considered in the design of our bootstrap analyses. Firstly, we settled on performing approximately 500 bootstrap pseudoreplicates per analysis, which should yield a standard error of#5% around a true value for those bootstrap percentages in the range of 60% and greater [26]. Secondly, we undertook a pilot study to empirically estimate how many search replicates would be needed to ensure an adequate search for each bootstrap pseudoreplicate, that is, to determine the number of search replicates beyond which there was no significant increase in the bootstrap percentage. To do this, we performed 15 and 25 search replicates per bootstrap pseudoreplicate for the nt123_de-gen1 and nt123 data sets, respectively, and then subsampled the resulting topologies to varying extents (1, 5, 10, and 15 replicates fornt123_degen1; 1, 5, 10, 15, and 25 replicates fornt123). For both data sets, the majority of nodes with bootstrap$50% showed no sensitivity to increasing numbers of search replicates (6 5%), indicating that even a single search replicate per bootstrap pseudoreplicate was adequate. However, there were 15 and 22 nodes for nt123_degen1and nt123, respectively, whose bootstrap values significantly increased up to 5 search replicates, and 4 and 7 nodes for nt123_degen1 and nt123, respectively, that further increased up to 10 search replicates (Tables 1, 2; Figure 3). Based on these findings, we performed 15 search replicates per bootstrap pseudoreplicate for all other analyses reported herein, except for the one mentioned immediately below.
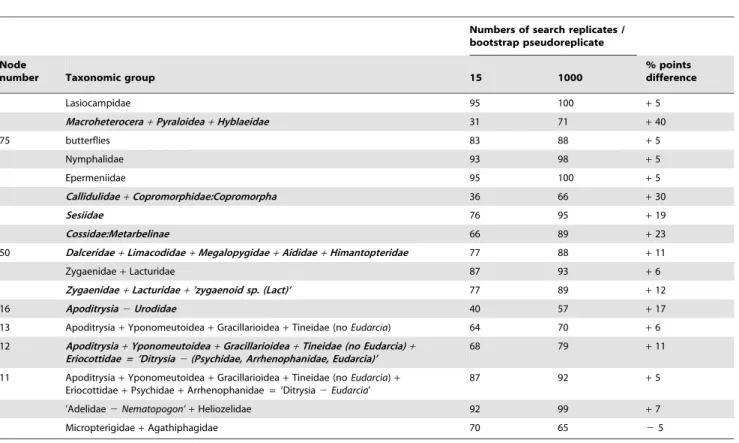
Near the end of this entire study, we revisited the question as to how many search replicates were required to generate accurate bootstrap values by repeating the bootstrap analysis of the 483-taxon, 19-genent123_degen1data set but increasing the number of search replicates to 1000 for each of 505 bootstrap pseudorepli-cates. If our initial conclusion were correct, namely, that effort beyond 15 search replicates would not significantly increase bootstrap values, we would expect, for one, that in the new analysis with 1000 search replicates per bootstrap pseudoreplicate, only about 5% of nodes would show differences in bootstrap
support from the initial analyses greater than 5% points (and then probably not too much beyond 5% points), and, for another, that these differences would be negative as often as positive. While the frequency of nodes with bootstrap difference between the two analyses$5% points was indeed on the order of 5% (17/482 = 3.5%), for all but one of such nodes (16/17 = 94%), the search with 1000 search replicates per bootstrap pseudoreplicate gave the higher value (Table 3). Of the nodes with bootstrap values from 50–79% in the initial analysis with 15 search replicates, two showed increases of 6 percentage points or less, while five showed increases from 11–23 points. There were three nodes with BP
,50% after 15 search replicates but with BP .50% after 1000 search replicates, showing increases of 17, 30, and 40 percentage points. These results strongly suggest that bootstrap support for at least some nodes in the initial analysis was underestimated due to insufficient search effort.
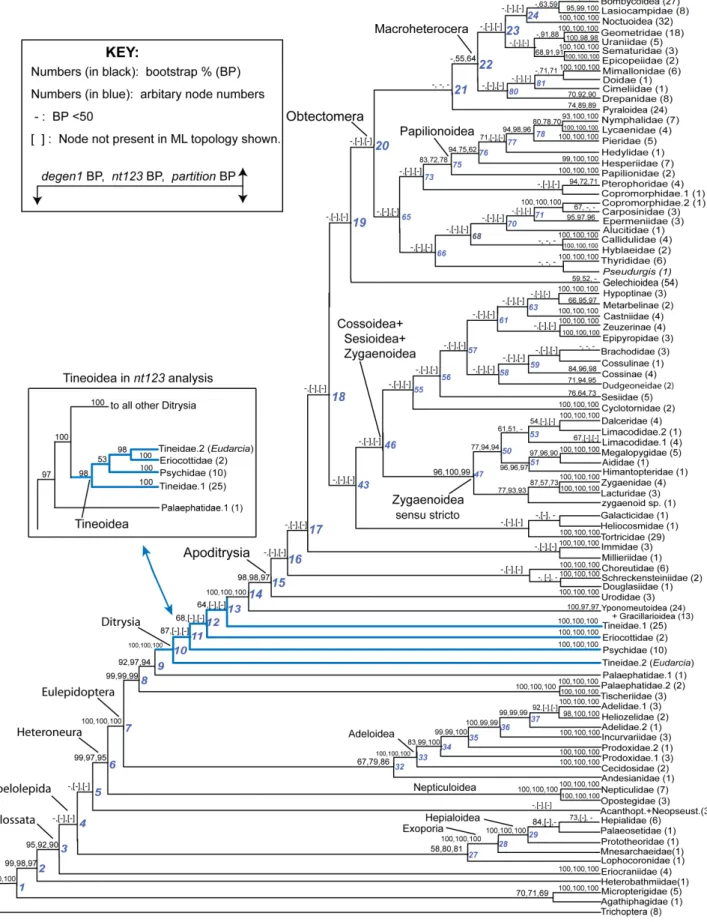
Three approaches to phylogeny estimation
Maximum likelihood and bootstrap analyses were performed on thent123_degen1, nt123, andnt123-partition data sets. For ease of presentation, bootstrap values for all three data sets have been mapped onto the higher-level phylogeny provided by thedegen1 maximum-likelihood estimate (Figure 3, but see Figures S1, S2 for the complete degen1 and nt123 results mapped onto their own maximum-likelihood topologies in phylogram format). Note that for those nodes in thedegen1ML topology that are not present in the nt123 and nt123-partition ML topologies, the bootstrap percentages of thent123andnt123-partitionresults are in brackets. There are numerous regions of the tree where bootstrap percentages vary significantly betweendegen1andnt123or nt123-partition, but for deep-level relationships it is only Tineoidea and relationships therein where they also strongly conflict (see below and Discussion). Multiply-sampled families and some superfamilies are generally strongly supported by one or more approaches, as are many backbone relationships at the base of Lepidoptera, i.e., outside Apoditrysia. However, within Apoditrysia backbone relationships are uniformly weakly supported. An examination of the phylograms fordegen1andnt123(Figures S1, S2, respectively) reveals that many of the weakly supported backbone relationships have short basal branches, consistent with little informative change.
Figure 2. Assessing the effectiveness of the GARLI heuristic ML search through an analysis of 4608 search replicates as derived from the full 483-taxon, 19-gene,nt123_degen1data set.Out of 4608 search replicates, the single fully-resolved topology of highest likelihood is displayed (lnL = 2583,900.053394). Terminal taxa, not shown in this figure in order to save space, are displayed in Figure S1. Dichotomous nodes that are not present in one or more strict consensuses of subsets of the 4608 topologies are identified by having numbers with blue colorationabove
subtending branches. The three subsets are as follows:4, all topologies with lnL scores that are within 0.0001% (10-4%) of that of the best ML
topology (2 topologies total, including the best ML topology);3, all topologies within 0.001% (10-3%, 19 topologies total);2, all topologies within
0.01% (10-2%, 1827 topologies total). Selected bootstrap percentages based on 15 heuristic search replicates and 500 bootstrap pseudoreplicates
that are$50% are displayedbelowbranches (see Figure S1 for all bootstrap percentages). An orange-colored bar is placed beside each node that has bootstrap support$50% and that is missing in one or more of the subset consensuses. The dashed arrow identifies the altered placement of one (and only one) taxon that was found in a new and improved topology (lnL = 2583,898.838616), when the dichotomous topology displayed in this figure was used as a starting tree in a second round of 561 GARLI ML heuristic searches. This new topology was recovered in 248 of the 561 search replicates. Higher-level taxon names, some of which are abbreviated, are displayed. All abbreviations follow: Anth+Phidit+Carth+Endrom., Anthelidae
+Phiditidae+Carthaeidae+Endromidae; Saturn+Sphing+Bomb., Saturniidae+Sphingidae+Bombycidae; Eupterot+Brahm+Apat., Eupterotidae+
Brahmaeidae+Apatelodidae; Nolidae+Stictopt., Nolidae+Stictopterinae; Notodont+Oenosand., Notodontidae+Oenosandridae; Uraniid.+
Epiple-midae, Uraniidae + Epiplemidae; Sematur.+Epicopeiidae, Sematuridae + Epicopeiidae; Papilion., Papilionidae; Pterophorid+Copromorph.,
Pterophoridae (part) + Copromorphidae (part); Copromorph., Copromorphidae (part); Callidul., Callidulidae; ‘‘small ditrysian families’’,
Copromorphidae + Carposinidae + Epermeniidae + Alucitidae + Hyblaeidae + Pterophoridae (part) + Thyrididae + Pseudurgis (unplaced); Dalcer.+Limacodidae, Dalceridae + Limacodidae; Megalopyg+Aidos+Himant., Megalopygidae + Aidos + Himantopteridae; Zygaen.+Lacturidae,
Taxon subsampling as an approach for increasing node support
Three general taxon subsampling schemes of thent123_degen1 and nt123 data sets were explored in varying combinations: 1) removal of "rogue" taxa (defined by two approaches, see Materials and Methods), 2) removal of compositionally heterogeneous taxa, and 3) removal of distant outgroups (see Text S1 for listing of taxa deleted). Of most interest are 21 supra-family-level groups whose bootstrap support in one or more subsampling schemes increases by at least 5% points relative to that in the 483-taxon data set, and always to values$50% (Tables 4, 5; see Tables S1, S2 for results with additional groups). In 11 of these, bootstrap support becomes strong, i.e., $80%, under the particular subsampling scheme. Examples are a modified Macroheterocera (up to 79% fordegen1 and 88% for nt123), placement of the "noctuoid" Doa (Doidae) with the non-noctuoid family Mimallonidae (up to 92% fornt123), and grouping of Cossoidea (including Castniidae), Sesioidea, and all or part of Zygaenoidea (up to 96% for nt123). (See also Discussion below.)
Compositional heterogeneity and resolution of the Tineoidea
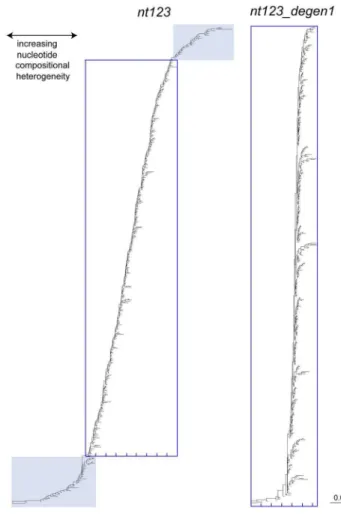
While degen1strongly supports a paraphyletic Tineoidea (e.g., 87% bootstrap for Tineidae:Eudarciaas sister group to all other Ditrysia; Figure 3), nt123 strongly supports tineoid monophyly (98% for Tineoidea; Figure 3). Despite this strong conflict, both data sets robustly support (i.e., 100% bootstrap) three tineoid subgroups: ’Tineidae 2 Eudarcia’, Eriocottidae, and Psychidae. The explanation that we now favor for the observed conflict across these three tineoid subgroups, plus the singleton Tineidae: Eudarcia, is that the nt123 result is biased by compositional
heterogeneity, which overall is much greater than that fordegen1 (Figure 4). Our initial approach that led to this conclusion was to identify taxa that caused a difference between the two data sets by systematically deleting one or more of the four taxonomic subgroups (Eudarcia; ’Tineidae minus Eudarcia’; Eriocottidae; Psychidae), followed by a direct analysis of the compositional features of the problematic subgroups. However, working with the entire data set is computationally impractical, so as an alternative we defined a subset of 63 test taxa that includes almost all tineoid exemplars but a reduced number of non-Ditrysia as outgroups and of non-tineoid Ditrysia (these 63 taxa are identified by three asterisks beside their generic names in Figure S1).
As a control, analysis of this reduced taxon set results in the same inter-relationships of the four subgroups for nt123_degen1 and, separately, fornt123as the full data sets, although bootstrap values are somewhat altered (cf. Figures 3, 5). Fornt123_degen1, no matter which subgroup(s) is deleted, the relationships among the remaining subgroups are unchanged relative to the full set of test taxa (Figure 5). However, for nt123 the Tineoidea become paraphyletic -- and in a manner that matches the nt123_degen1 result (either altered or unaltered) -- when only two taxa, namely, Eudarcia and Compsoctena (i.e., the single representative of Eriocottidae in the test set) are deleted, although this paraphyly is not strongly supported, i.e., 55% bootstrap. Removal of either one of these taxa alone greatly reducesnt123bootstrap support for tineoid monophyly.
Compositional heterogeneity of thent123data set is more than fivefold greater than that of the degen1 data set, and it is additionally noteworthy that Tineidae:Eudarciaand Eriocottidae: Compsoctena are highly and similarly biased in their nt123 compositions (Figure 6). The 100% bootstrap support for ’Eudarcia + Compsoctena’ in the nt123 analysis is likely due to these Table 1.Assessing the effectiveness of the GARLI heuristic bootstrap search by varying the number of search replicates performed per individual bootstrap pseudoreplicate in an analysis of 500 483-taxon, 19-gene,nt123_degen1, bootstrapped data sets.*
Number of search replicates per bootstrap pseudoreplicate
Node number Taxonomic group 1 5 10 15
75 "butterflies" 76 81 82 83
76 "butterflies"2Papilionidae 88 93 94 94
53 Zygaenoidea subgroupA(9 taxa) 56 62 61 61
50 Zygaenoidea subgroupB(16 taxa) 67 72 77 77
Zygaenoidea subgroupC(7 taxa) 82 87 87 87
Zygaenoidea subgroupD(8 taxa) 71 78 77 78
47 Zygaenoidea sensu stricto 73 89 95 96
Pyraloidea 69 73 74 74
Gelechioidea 50 55 59 59
Gelechioidea subgroup (7 taxa) 94 99 99 100
Pterophoridae (4 taxa) 85 94 93 94
Epermeniidae (3 taxa) 56 81 90 95
Cossidae subgroup (3 taxa) 95 100 100 100
Brachodidae subgroup (2 taxa) 81 94 98 99
15 Ditrysia2(Tineoidea, Gracillarioidea, Yponomeutoidea)
92 96 97 98
*Bootstrap percentages of all taxonomic groups in Figures 3 and S1 that are at least 5% lower than the value for 15 search replicates are displayed in this table in boldfaced, italicized font (columns 3–6). In no case was the value for 1 search replicate higher than that for 15 by 5% or more. Only bootstrap percentages close to or over 60% at 15 search replicates, and which differ by 5% or more from corresponding values at 1 search replicate, are shown in this table. Node numbers (column 1) refer to correspondingly numbered nodes in Figure 3, while un-numbered taxonomic groups correspond to terminal taxa in that same figure.
compositional features. By contrast, Eudarcia and Compsoctena do not group in thedegen1analysis, nor are they highly divergent in composition when synonymous differences are removed (Figure 6). To test whether a reduction in compositional heterogeneity for nt123 would lead to a result that more closely approximates the degen1 result, we deleted 30 taxa at both ends of the nt123 compositional distance tree in Figure 6 (see vertical boundary lines), resulting in a 33-taxon data set with a.70% reduction in compositional heterogeneity. Maximum-likelihood and bootstrap analysis of thent123andnt123_degen1data sets now yield almost identical results, with 96% and 99% bootstrap values, respectively, for a paraphyletic Tineoidea (Figure 5).
Discussion
Exploring tree space with large data sets
The current study makes it clear that, when analyzing large data sets, finding the maximum-likelihood topology using a heuristic algorithm, such as that implemented by GARLI, is not a trivial task. This should not be surprising given the enormous number of theoretically possible topologies, plus the fact that many differ-ences in topology yield exceedingly small differdiffer-ences in total lnL values. In the current case, 4608 likelihood search replicates of the complete nt123_degen1 data set still yield a suboptimal tree,
although an improved topology based on further searches differs only in the position of one terminal taxon (see dashed arrow in Figure 2). One might question whether an extended effort to find the best-feasible ML topology is warranted, given the small differences in lnL values among the optimal and the many suboptimal topologies. A positive answer seems warranted, however, since at least some nodes with weak signal are likely to be correctly recovered given a sufficiently thorough search; whereas, it seems counter-intuitive, although not theoretically impossible, that some correct nodes would be lost in overall-improved topologies found with more thorough searches. The recovery of Bombycoidea + Lasiocampidae (BP,50%) and of Gelechioidea (BP 59%), neither of which is present in a strict consensus of the top 10-2 % of all degen1 topologies, are likely examples that illustrate the value of performing multiple search replicates (Figure 2). To further illustrate the importance of performing multiple searches, we calculate from the 483-taxon, degen1results shown in Figure 2 that six, 725, and 6903 searches are required to ensure a 95% probability of recovering a topology whose lnL is within 10-2%, 10-3%, and 10-4%, respectively, of the topology of highest likelihood. For the 483-taxon,nt123results (not shown), the number of required searches are 3, 70, and 974, respectively.
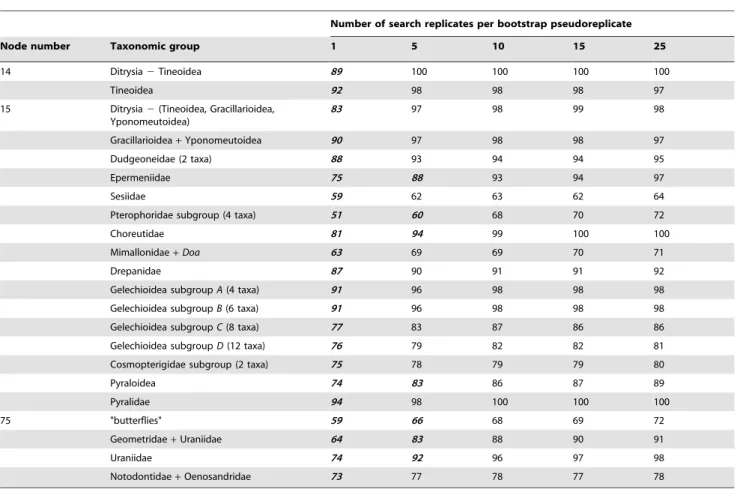
Table 2.Assessing the effectiveness of the GARLI heuristic bootstrap search by varying the number of search replicates performed per individual bootstrap pseudoreplicate in an analysis of 500 483-taxon, 19-gene,nt123, bootstrapped data sets.*
Number of search replicates per bootstrap pseudoreplicate
Node number Taxonomic group 1 5 10 15 25
14 Ditrysia2Tineoidea 89 100 100 100 100
Tineoidea 92 98 98 98 97
15 Ditrysia2(Tineoidea, Gracillarioidea, Yponomeutoidea)
83 97 98 99 98
Gracillarioidea+Yponomeutoidea 90 97 98 98 97
Dudgeoneidae (2 taxa) 88 93 94 94 95
Epermeniidae 75 88 93 94 97
Sesiidae 59 62 63 62 64
Pterophoridae subgroup (4 taxa) 51 60 68 70 72
Choreutidae 81 94 99 100 100
Mimallonidae+Doa 63 69 69 70 71
Drepanidae 87 90 91 91 92
Gelechioidea subgroupA(4 taxa) 91 96 98 98 98
Gelechioidea subgroupB(6 taxa) 91 96 98 98 98
Gelechioidea subgroupC(8 taxa) 77 83 87 86 86
Gelechioidea subgroupD(12 taxa) 76 79 82 82 81
Cosmopterigidae subgroup (2 taxa) 75 78 79 79 80
Pyraloidea 74 83 86 87 89
Pyralidae 94 98 100 100 100
75 "butterflies" 59 66 68 69 72
Geometridae+Uraniidae 64 83 88 90 91
Uraniidae 74 92 96 97 98
Notodontidae+Oenosandridae 73 77 78 77 78
*Bootstrap percentages of all taxonomic groups in Figures 3 and S2 that are at least 5% lower than the value for 15 search replicates are displayed in this table in boldfaced, italicized font (columns 3–7). In no case was the value for 1 search replicate higher than that for 15 by 5% or more. Only bootstrap percentages close to or over 60% at 25 search replicates, and which differ by 5% or more from corresponding values at 1 search replicate, are shown in this table. Node numbers (column 1) refer to correspondingly numbered nodes in Figure 3, while un-numbered taxonomic groups correspond to terminal taxa in that same figure.
Unfortunately, there are limits to what is practical for numbers of searches, even with grid computing, particularly given the size of our data sets. Accordingly, for all studies we restricted the number of ML search replicates to 500–1000 for all data sets other than thent123_degen1data set for 483-taxa. Our confidence in any given node must, therefore, be tempered by this practicality. Indeed, it is an interesting further observation that not all nodes are recovered at the same frequency. Notable for this report, most of the nodes along the backbone are frequently not present in strict consensuses of the top 10-3 % of all topologies (Figure 2), indicating that the very nodes of interest are ones that are particularly difficult to recover. Fortunately, these backbone nodes are all present in the top 10-4%. There is also a general tendency for hard-to-recover nodes to have lower bootstrap values, but there are exceptions, e.g., the Pyraloidea (bootstrap, 74%) is not present in the strict consensus of the top 10-3% of all topologies (Figure 2). In principle, what applies to the ML search could also apply to the search of each and every bootstrapped data set in order to calculate an accurate bootstrap value, making accurate bootstrap analysis a truly daunting task. However, before considering this there is an additional complexity in that the bootstrap provides a statistical summary measure of results from multiple pseudorepli-cated data sets. The variance of the bootstrap percentage decreases as the number of replicates increases, but it decreases more rapidly for higher bootstrap percentages than lower ones. Following a standard model [26], we chose to perform approx-imately 500 bootstrap pseudoreplicates for each analysis. This number ensures, within the assumptions of the model, that bootstrap percentages in the general range of 60% and higher are accurate to within 5%.
We have empirically tested the effect of increasing numbers of search replicates on the resulting bootstrap values (Tables 1, 2). For analysis of thent123_degen1andnt123data sets, there are 15 and 22 higher-level nodes, respectively, whose bootstrap values increase from 1 to 5 search replicates, of which 3 and 6, respectively, increase further from 5 to 10 search replicates. None increase by more than 5% points beyond 10 search replicates, and all have final bootstrap values that are$55%, assuring that the standard error should be in the range of 5% or less. (No conclusions are made for values ,50%.) It is on this empirical basis that the standard condition of 15 search replicates per bootstrap pseudoreplicate was selected for other analyses. Inter-estingly, Pyraloidea is one of the nodes whose bootstrap value is sensitive to number of search replicates, paralleling a similar difficulty in its recovery for ML searches (Figure 2). However, for Pyraloidea many fewer replicates are needed to achieve an accurate bootstrap value than to recover this group in the ML topology. This seeming paradox could reflect the particular characteristics of each somewhat-distinct bootstrap data set, but of course recovering a particular node in an ML topology and accurately (enough) estimating its bootstrap value are not directly equivalent undertakings either.
The just-mentioned results stimulated us to reinvestigate the matter of number of search replicates needed to generate accurate bootstrap percentages for GARLI and the given parameters. To do this, we increased the number of search replicates to 1000 for each of 505 bootstrap pseudoreplicates of the 483-taxon, 19-gene
nt123_degen1data set, and compared the resulting bootstrap values with those derived from 15 search replicates (Table 3). In light of our ML search results, it would have been desirable to increase the number of search replicates to$ 7000, but this simply was not practical. Even given our access to considerable computational resources, performing this one analysis with 1000 search replicates was at the limits of feasibility, as it consumed approximately 3-million computer-processor hours ( = 3.4 centuries). The results are modestly surprising and add further complexity in interpre-tation to an already complex study. The eight nodes that show changes (all increases) in bootstrap values of.10% provide clear evidence of the inadequacy of relying on 15 search replicates, although of course all of these should thereby be interpreted as introducingunderconfidence in our results, not overconfidence. Not surprisingly given the ML results, when each of the 1000 topologies generated for each of the 505 bootstrap pseudorepli-cates is examined, it turns out that in 504 of the bootstrap pseudoreplicates the best topology is recovered only once, so even with 1000 search replicates per bootstrap pseudoreplicate we cannot be confident that the enhanced bootstrap percentages are accurate (results not shown). The difficulty can be explained from two perspectives. From the perspective of model choice, the estimate that bootstrap values in the range of 60% and above would have no more than 5% points variation at the 95% confidence level assumes a binomial distribution for the proportion of bootstrapped trees containing a particular group. Seemingly, this assumption is incorrect for some groups. From the perspective of the individual groups themselves, some are simply harder to recover than others; that is, their recovery requires more search replicates. Of the five groups with bootstrap values.65% after 15 search replicates, two (Sesiidae, Cossidae: Metarbelinae) are "difficult to recover" in the ML search (Figure 2); that is, they are not present in all of the top 10-2 % of all 4608 topologies recovered. The other three are not notably difficult to recover in the ML analysis, at least for this data set.
The effect of search effort on bootstrap values has been little studied [27–29]. The challenge of getting accurate bootstrap values probably relates to the number of taxa analyzed, since tree space itself increases exponentially with number of taxa, as does the computational effort required. By modern standards the current study is no longer "large", so this problem may be even more challenging for studies larger than ours. Finally, this study provides only a single datum -- out of practical necessity -- and it raises new questions. What changes would have been observed if we could have applied increased numbers of search replicates to our other analyses? What changes to the user-controlled param-eters of the GARLI program might improve the efficiency of the search? How would our findings in GARLI relate to those derived from other ML and bootstrap search algorithms? These are important issues for future studies.
Selecting characters for higher-level phylogenetic analysis
In the preceding section we discussed ways to improve heuristic search results through more thorough searches of tree space. In this section we discuss the relative contributions of two categories of nucleotide change, namely, synonymous and nonsynonymous, recovered in the ML analysis of that data set. A dash indicates that the bootstrap value is,50%. The number of exemplars is listed in parentheses after the family or subfamily name. The region of the topology that includes Tineoidea has blue-colored branches, and its favored alternative topology, based on analysis ofnt123, is also displayed (see lower boxed area). Throughout this report, we have subsumed all tineoid taxa traditionally identified as Acrolophidae under Tineidae, all tineoid taxa traditionally identified as Arrhenophanidae under Psychidae, and Crinopterygidae under Incurvariidae, following van Nieukerken et al. [1].BP, bootstrap percentage.
and their implications for improved phylogenetic analysis. We conclude that both synonymous and nonsynonymous change provide valuable phylogenetic signal across Lepidoptera, but that these signals are optimally informative at different phylogenetic levels. This is generally the case because synonymous change occurs more rapidly, and is particularly useful for resolving more recent divergences that receive little support from the more slowly evolving nonsynonymous change. By contrast, nonsynonymous change is less subject to the multiple-hits problem at deeper levels in the tree, where it is particularly useful. Equally important for this study, however, is that nonsynonymous signal is less affected by compositional heterogeneity at all levels (Figure 4). Such heterogeneity can introduce an analytical bias that distorts the phylogenetic signal of primary sequence evolution, and can even result in strong support for incorrect nodes [24].
These general observations about synonymous and nonsynon-ymous change have been widely acknowledged, and multiple approaches have been implemented to obviate their consequent problems for phylogenetic analysis. One standard approach has been to apply separate "partition" models to nonsynonymous and synonymous change (either as implemented in this report or, less discriminatingly, by codon position). While this approach can be effective (e.g., see [30] and references therein], we found little difference between the partitioned and unpartitioned analyses in this study (Figure 3).
A second common approach is to delete all third-codon-position characters, which eliminates synonymous (and nonsynonymous)
change at third codon positions, while still allowing synonymous change at first codon positions. However, even this reduced level of synonymous change causes problems for deep-level arthropod phylogeny [22-24]. Therefore, in this and other studies we have instead "degenerated" all nucleotides (thedegen1 approach) such that synonymous change should be largely eliminated but without any loss of information from nonsynonymous change [23–25].
Previous studies of Lepidoptera using some or all of the same genes as in the current study have demonstrated the utility, and indeed the necessity, of a nonsynonymous-only approach for robustly resolving a novel group at the base of Ditrysia (’Apoditrysia+ Gelechioidea’; [6]; also observed by Mutanen et al. [5]). Conversely, other studies directed at relationships within superfamilies -- e.g., Bombycoidea [8], Gracillarioidea [9], Tortricoidea [11], and Pyraloidea [10] -- have illustrated that total synonymous+nonsynonymous change provides much more overall support than nonsynonymous alone. Of course, data sets that include synonymous change are more prone to signal distortion from compositional heterogeneity, so this must also be considered. From these studies, we conclude that no single approach is warranted across the entire Lepidoptera, and it is for that reason that we have performed both totalnt123 anddegen1 analyses, along with independent tests of compositional heteroge-neity. Another reason is that "deep" and "shallow" nodes are relative terms that cannot yet be applied across lepidopteran phylogeny, since neither a robust phylogeny nor a robust dating of internal nodes is available.
Table 3.A further assessment of the effectiveness of the GARLI heuristic bootstrap search by instituting a huge increase in the number of search replicates performed per individual bootstrap pseudoreplicate in an analysis of 505 483-taxon, 19-gene, nt123_degen1, bootstrapped data sets.*
Numbers of search replicates / bootstrap pseudoreplicate
Node
number Taxonomic group 15 1000
% points difference
Lasiocampidae 95 100 +5
Macroheterocera+Pyraloidea+Hyblaeidae 31 71 +40
75 butterflies 83 88 +5
Nymphalidae 93 98 +5
Epermeniidae 95 100 +5
Callidulidae+Copromorphidae:Copromorpha 36 66 +30
Sesiidae 76 95 +19
Cossidae:Metarbelinae 66 89 +23
50 Dalceridae+Limacodidae+Megalopygidae+Aididae+Himantopteridae 77 88 +11
Zygaenidae+Lacturidae 87 93 +6
Zygaenidae+Lacturidae+’zygaenoid sp. (Lact)’ 77 89 +12
16 Apoditrysia2Urodidae 40 57 +17
13 Apoditrysia+Yponomeutoidea+Gracillarioidea+Tineidae (noEudarcia) 64 70 +6
12 Apoditrysia+Yponomeutoidea+Gracillarioidea+Tineidae (no Eudarcia)+ Eriocottidae = ’Ditrysia2(Psychidae, Arrhenophanidae, Eudarcia)’
68 79 +11
11 Apoditrysia+Yponomeutoidea+Gracillarioidea+Tineidae (noEudarcia)+ Eriocottidae+Psychidae+Arrhenophanidae = ’Ditrysia2Eudarcia’
87 92 +5
’Adelidae2Nematopogon’+Heliozelidae 92 99 +7
Micropterigidae+Agathiphagidae 70 65 25
*Node numbers (column 1) refer to correspondingly numbered nodes in Figure 3, while un-numbered taxonomic groups either correspond to terminal taxa in that same figure or to groups not recovered. Numbers in columns 3 and 4 are the resulting bootstrap percentages. Taxonomic groups whose bootstrap percentage increases by.10% are in boldfaced, italicized font (column 2).
Node
number Taxonomic Group
483 taxa
453 taxa, no ACrogue
436 taxa, no RNRrogue
434 taxa, no RNRrogue,
2Acan,2Neop: Neopseustis
344 taxa, APODIT
314 taxa, APODIT, no ACrogue
133 taxa, MACRO
129 taxa, MACRO, no ACrogue
Bomb+Lasi 36 52 25 24 40 54 x 38
Geom:Sema+Drep:Epic 68 72 74 76 70 61 66 59
22 Bomb+Lasi+Noct+Drep+ Geom+Mima+Cime ( =MACRO)
39 63 [noDoa, Cime] 79[noDoa, Cime] 79 60 77[noDoa, Cime]
Mima+Doa 33 [noDoa] [noDoa] [noDoa] 44 [noDoa] 57 [noDoa]
Pyra 74 74 70 80 71 77
21 MACRO+Pyra 23 38 36 37 41 40
MACRO+Pyra+Hybl 31 27 39 26 34 24
Gele 59 99 99 99 68 99
19 MACRO+Pyra+Hybl+Copr+
Eper+Thyr+Call+"butterflies"+ Pter+Aluc+Gele ( = OBTECT+Gele)
14 65 58 57 16 34
71 Eper+Copr2Copromorpha 35 69 (noCopromorpha) 76(noCopromorpha) 73(noCopromorpha) 37 54 (noCopromorpha)
Tort+Immo x 44 32 x x x
46 Zyga+Sesi+Coss x 25 [no Zyga:Cycl, Zyga: Epip]
x 3 2 [no Zyga:Cycl,
Zyga:Epip]
23 [no Zyga:Cycl, Zyga:Epip]
Sesi+Coss x 67 x x x 64
Schr+Grac:Doug 37 [no Grac:Doug] 78 77 39 [no Grac:Doug]
15 Ditrysia2(Urod, Ypon, Grac, Tine) ( = APODIT)
40 56 57
32 Adel+Ande 67 66 68
Acan+Neop 35 76[no Neop:
Apoplania]
[no Acan or Neop]
Acan+Neop+Erio x 45 [no Neop:
Apoplania]
[no Acan or Neop]
Eulep+Neop+Acan+Erio 26 33 [no Neop:
Apoplania]
52 [no Acan or Neop]
27 Hepi+Mnes+Loph 58 72 92
4 Ditrysia+Tisc+Pala+Adel+Ande+ Nept+Acan+Neop+Hepi+Mnes+Loph
28 x x
Agat+Microp 70 77 76
*Bootstrap results in PAUP* are those shown under the "le = yes" option.x, Not present in the bootstrap table under le option, so value,50%; "Strong" bootstrap values, i.e.,$80%, and "moderate" bootstrap values, i.e., 70–79%, are in boldfaced, italicized font (columns 3–10). Node numbers (column 1) refer to correspondingly numbered nodes in Figure 3. Abbreviated taxonomic group names are in column 2 and throughout the table (see below for abbreviations). Columns 3–10 show the bootstrap values based on analysis of eight differentnt123_degen1data sets. Descriptors of these data sets (see labels at top) include number of taxa (129 – 483), whether rogue taxa were excluded, and whether analysis was restricted to a subset of total Lepidoptera (i.e.,APODIT, restricted to Apoditrysia;MACRO, restricted to Macroheterocera).ACrogue, Adams-consensus rogue;RNRrogue, RNR rogue;Bomb, Bombycoidea;Lasi, Lasiocampidae;Geom:Sema, Geometroidea:Sematuridae;Drep:Epic, Drepanoidea:Epicopeiidae;Noct, Noctuoidea;Drep, Drepanoidea;Geom, Geometroidea;Mima, Mimallonidae;Cime, Cimeliidae;MACRO, Macroheterocera;Doa, Noctuoidea:Doasp.;Pyra, Pyraloidea;Hybl, Hyblaeidae;Gele, Gelechioidea;Copr, Copromorphoidea;Eper, Epermeniidae;Thyr, Thyrididae;Call, Callidulidae;"butterflies", Nymphalidae+Lycaenidae+Pieridae +Hedylidae+Hesperiidae+Papilionidae;Pter, Pterophoridae;Aluc, Alucitidae;Gele, Gelechioidea; OBTECT, Obtectomera;Copromorpha,Copromorphasp.;Tort, Tortricoidea;Immo, Immoidea;Zyga, Zygaenoidea;Sesi, Sesioidea;
Coss, Cossoidea;Zyga:Cycl, Zygaenoidea:Cyclotornidae;Zyga:Epip, Zygaenoidea:Epipyropidae;Schr, Schreckensteiniidae;Grac:Doug, Gracillarioidea:Douglasiidae;Ditrysia, Ditrysia (as defined in Figure S1);Urod, Urodidae;Ypon, Yponomeutoidea;Grac, Gracillarioidea;Tine, Tineoidea;APODIT, Apoditrysia;Adel, Adeloidea;Ande, Andesianidae;Acan, Acanthopteroctetidae;Neop, Neopseustidae;Erio, Eriocraniidae;Neop:Apoplania, Neopseustidae:Apoplania
sp.;Tisc, Tischeriidae;Pala, Palaephatidae;Eulep: Ditrysia+Palaephatidae+Tischeriidae+Adeloidea+Andesianidae;Erio, Eriocraniidae;Hepi, Hepialidae;Mnes, Mnesarchaeidae;Loph, Lophocoronidae;Nept, Nepticuloidea;Agat, Agathiphagidae;Micr, Micropterigidae.
doi:10.1371/journal.pone.0058568.t004
Molecular
Phylogen
etics
of
Lepidop
tera
ONE
|
www.ploson
e.org
11
March
2013
|
Volume
8
|
Issue
3
|
A direct comparison of higher-level node support for the 483 taxa provided by analysis of thent123andnt123_degen1data sets can be made from Figure 3. Excluding the Tineoidea (discussed in the next section), there are 16 nodes above the family level with bootstrap values that differ by at least 10%. Nine are more strongly supported by nt123 than by degen1: ’Bombycoidea + Lasiocampidae’; ’Sematuridae + Epicopeiidae’; ’Geometridae + Uraniidae’; Pyraloidea; Macroheterocera (sensu van Nieukerken [1]); ’Mimallonidae + Doidae’; ’Zygaenoidea 2 (Zygaenidae + Lacturidae)’; ’Adeloidea + Andesianidae’; and ’Exoporia + Lophocoronidae’. Seven nodes receive greater support fromdegen1 than fromnt123: ’Nymphalidae+ Lycaenidae’; ’Papilionoidea2
(Papilionidae, Hesperiidae)’; ’Papilionoidea 2 Papilionidae’, Gelechioidea, ’Dalceridae+ Lacturidae’, ’Hepialidae+ Palaeose-tidae’, and ’Adelidae+Heliozelidae’. All 16 nodes are recovered in thedegen1ML topology, while thent123ML topology includes all except two: ’Papilionoidea 2 (Papilionidae, Hesperiidae)’ and ’Adelidae+Heliozelidae’. Such a high level of agreement across data sets argues against the influence of a strongly distorting signal based on compositional heterogeneity and for the phylogenetic accuracy of the nodes, particularly for those 10 that receive strong bootstrap support from one or the other data set. However, this conclusion must be tempered by the fact that those seven nodes with lower support fromnt123thandegen1(e.g., ’Papilionoidea2
Papilionidae’) must contain some enhanced conflicting signal in the synonymous portion, since nt123 captures both synonymous and nonsynonymous signals, whiledegen1captures only nonsynon-ymous.
Compositional heterogeneity and resolution of the Tineoidea
Despite the many similarities between thent123anddegen1ML topologies, there are also numerous differences (Figure 3). However, with one exception these differences are weakly supported by one or the other or both data sets. As such, the source and evaluation of these disagreements are less certain. The one exception occurs in the case of Tineoidea, which nt123 strongly supports as monophyletic butdegen1strongly supports as paraphyletic (Figure 3). A series of taxon-deletion experiments (Figure 5), coupled with an assessment of compositional hetero-geneity (Figure 6), strongly supports the hypothesis that the difference results from a major distorting effect of nucleotide composition on the synonymous signal of selected taxa. Most convincingly, when a subset of compositionally more homoge-neous taxa is analyzed, both nt123 and degen1 strongly support tineoid paraphyly (Figure 5).
So, it would seem that Tineoidea decisively illustrate the challenge heterogeneous compositions present for generating phylogenetically accurate nt123 results. It also seems reasonable that the many cases in whichdegen1provides significantly greater support for a particular node than nt123 (see preceding section) also reflect underlying distortion and/or conflict in the synony-mous signal. We suggest that degen1 results provide a valuable check on those of nt123, particularly in those cases when nt123 support is high anddegen1favors a conflicting grouping. However, we are not suggesting that degen1results are infallible, only that they are less prone to error caused by compositional heterogeneity. When bootstrap values are low in degen1analyses, the stochastic nature of evolutionary change still makes accurate node assign-ment problematic.
Selecting taxa for higher-level phylogenetic analysis
While it seems like a straightforward proposition that taxa should be selected to represent known and hypothesized larger
groups, not all taxa serve as equally good representatives. Some taxa may be especially fast evolving, and be long-branch attractors of distant taxa. Others may evolve in such a manner that the nucleotide composition of their gene markers becomes more similar to that of distantly related taxa than to more closely related ones, as demonstrated in this study for selected tineoids (discussed in previous section; Figures D, E).
One way to explore phylogenetic results beyond total-data analysis is to test the sensitivity of a result (in our case, a bootstrap percentage) to the removal of these potentially problematic taxa. But exactly which taxa ought to be removed, even assuming their inclusion as a representative of a group is not obligatory? In the remainder of this section, we discuss phylogenetic results based on three general approaches to taxon subsampling, sometimes performed in combination: 1) removal of "rogue" taxa based on theRNR and Adams-consensus approaches (described in Materials and Methods), 2) removal of clusters of taxa (in addition to Tineoidea, whose subsampling has already been discussed) that are compositional outliers relative to the mean composition of all taxa, and 3) removal of distant outgroups. Many of these tests have been performed separately fornt123anddegen1.
A general concern with all taxon deletion studies is that resulting changes in topology or node support may or may not actually be due to the hypothesized problematic feature of the deleted taxon itself. For example, a taxon that happens to be long branch or compositionally heterogeneous might be required in order to maintain the integrity of a monophyletic group, even though it would do this more effectively if it were not long branch or compositionally heterogeneous. Thus, it is worth emphasizing the exploratory nature of these subsampling studies. As concerns the first approach (i.e., rogue identification and removal), rogue taxa by definition are not robust to various analytical perturbations. In this regard, it is worth emphasizing that long-branch taxa can be either stably or unstably positioned correctly or incorrectly --and, thus, are not necessarily rogue taxa as such. As concerns the second approach (identification and removal of taxa with shared unusual compositions), its utility has already been demonstrated for Tineoidea. In other taxa for which compositional divergence is not so striking, the effect is more difficult to separate from other contributors to the total signal. It is also worth noting that taxa with compositions that are unusually divergent from the mean composition are not necessarily rogue taxa either. A strong compositional atypicality (relative to the mean) could by itself result in increased bootstrap support, and this support might either be consistent with phylogeny (for clusters of related taxa) or not (for clusters of unrelated taxa). As concerns the third approach (removal of outgroup taxa), this would seem to present the fewest challenges to accepting altered results, because ingroup taxa are not deleted. Its potential utility is based on the premise that there exist taxa in the outgroup that affect the position of taxa in the ingroup, e.g., through their shared and unusually biased compo-sitions. Of course this assumes that outgroups are indeed outgroups and that the basal-most subgroup relationships within the ingroup -- the ones most likely to be affected by altering outgroup taxa -- either are not altered or are of lesser interest.
Node
number Taxonomic Group 483 taxa
455 taxa, no ACrogue
432 taxa, no RNRrogue
356 taxa, no
RNRrogue,2
heterog
344 taxa, APODIT
316 taxa, APODIT no ACrogue
133 taxa, MACRO
129 tx, MACRO, no ACrogue
Bomb+Lasi 63 95 97 99 54 96 76 82
Mima+Doa+Geom:Sema+Drep:Epic 26 x x x 38 62 x 65 [noDoa]
Geom:Sema+Drep:Epic 91 88 97 91 94 76 94 68
22 Bomb+Lasi+Noct+Drep+Geom+ Mima+Cime ( =MACRO)
55 36 [noDoa, Cime] 82[no Cime] 88[no Cime] 83 70[noDoa, Cime]
Mima+Doa 71 [noDoa] 88 92 85 [noDoa] 85 [noDoa]
Pyra 89 95 98 97 95 78
21 MACRO+Pyra 37 23 58 68 58 47
Gele 52 29 68 72 52 54
19 MACRO+Pyra+Hybl+Copr+Eper+ Thyr+Call+butterflies+Pter+Aluc+ Gele ( = OBTECT+Gele)
x x x x x x
Call+Hybl+Thyr x 59 79 72 x 40
Call+Hybl 24 83 70 68 x 69
71 Eper+Copr2Copromorpha x 17 (noCopromorpha) x 21 (noCopromorpha) 14 13 (noCopromorpha)
Tort+Immo 53 84 72 92 60 94
46 Zyga+Sesi+Coss 2 96[no Zyga:Cycl,
Zyga:Epip]
32 41 x 95[no Zyga:Cycl,
Zyga:Epip]
32 Adel+Ande 79 83 90
Acan+Neop x [no Neop] [no Neop]
Acan+Neop+Erio x 88[no Neop] 70[no Neop]
Eulep+Nept+Acan+Neop+Erio x 88[no Neop] 49 [no Neop]
27 Hepi+Mnes+Loph 80 100 [no Loph]
4 Eulep+Nept+Acan+Neop+Hepi+ Mnes+Loph
x x x
Agat+Microp 71 72 81
*Bootstrap results in PAUP* are those shown under the "le = yes" option. Node numbers (column 1) refer to correspondingly numbered nodes in Figure 3. "Strong" bootstrap values, i.e.,$80%, and "moderate" bootstrap values, i.e., 70–79%, are in boldfaced, italicized font (columns 3–10). See footnote to Table 4 for definitions of abbreviations.
doi:10.1371/journal.pone.0058568.t005
Molecular
Phylogen
etics
of
Lepidop
tera
ONE
|
www.ploson
e.org
13
March
2013
|
Volume
8
|
Issue
3
|
increases in bootstrap percentages of$40% points, always to final values of 70 - 80% when theRNR roguesare removed, cf. columns 3 and 5. As an aside, we also note that the single taxon which remains suboptimally positioned (Copromorpha) after 4608 search replicates of the 483-taxonnt123_degen1data set (Figure 2) is also a rogue taxon (Text S1).
There is another very striking increase indegen1node support (from 72% to 92% bootstrap) -- for ’Exoporia+Lophocoronidae’ -- when two additional, neighboring taxa (i.e, Acanthopterocteti-dae:Acanthopteroctetesand Neopseustidae: Neopseustis) are removed (see column 6 in Table 4). We note that these two taxa match the criteria for rogue taxa according to theAdams-consensusapproach, although in this report this approach was applied only to taxa within Apoditrysia, so this increase too could be considered a "rogue" effect.
The effect of removing distant outgroups (see columns 7, 9 in Table 4) is somewhat difficult to evaluate fordegen1because many of the relevant nodes are not strongly supported by any approach. The largest effects are for Macroheterocera (bootstrap increases from 39% to 60%,) and Gelechioidea (59% to 68%) when the analysis is restricted to Apoditrysia. Regardless, it is clear that the
effect of removing rogue taxa is much greater than simply removing distant outgroups.
Of the most notable nt123 results (Table 5), nine groups (’Bombycoidea +Lasiocampidae’; Macroheterocera; ’Mimalloni-dae+Doa’; ’Callidulidae+Hyblaeidae’; ‘Callidulidae+ Hyblaei-dae+Thyrididae’; ’Tortricoidea+Immoidea’; ’Acanthopterocte-tidae + Neopseustidae + Eriocraniidae’, ’Exoporia + Lophocoronidae’; and ’Glossata2(Exoporia+Lophocoronidae)’) show increases in bootstrap support of .10% points, always to final values$70%, when theRNR roguesare removed (cf. columns 3 and 5). There are no examples of bootstrap decreases with rogue removal for groups that have bootstrap values of at least 50% in the full data set. The additional removal of 76 heterogeneous taxa (plus 6 more already inRNR rogueset) can have large effects, and these are not unidirectional. The largest effects are: 20% point increase for ’Tortricoidea +Immoidea’, 18% point decrease for ’Acanthopteroctetidae+Neopseustidae+Eriocraniidae’, and 39% point decrease for Glossata minus Exoporia+ Lophocoronidae. Straightforwardly interpreted, these results provide additional strong support for ’Tortricoidea + Immoidea’, but reduced confidence for the other two groupings.
The effect of rogue removal under theAdams-consensusapproach is particularly dramatic (i.e., 94% point increase) for node 46 (’Zygaenoidea+ Cossoidea+ Sesioidea’) but much less so under theRNR approach(Table 5). This appears to be due to the absence of taxa belonging to Zygaenoidea: Cyclotornidae and Zygaenoi-dea: Epipyropidae from the former analysis. Overall, a compar-ison of the two approaches to rogue identification shows that the RNR approachyields significantly higher bootstrap values than the AC approachfive times, theAC approachyields higher values than the RNR approachthree times, while there is no significant difference two times.
Removal of distant outgroups (columns 7, 9) is clearly beneficial in some cases, although, as fordegen1, rogue removal yields higher support values more consistently.
So, what can we conclude about the various approaches that rely on deleting selected taxa? Firstly, it is clear that removal of rogue taxa oftentimes increases bootstrap support and seldom, if ever, decreases it. This is an encouraging observation. Secondly, removal of distant outgroups can be useful, but it is not as effective as, and probably is not necessary in addition to, rogue taxon removal. Thirdly, removal of heterogeneous taxa prior to analysis ofnt123data sets, when coupled with removal of rogue taxa, can increase, decrease, or leave unchanged bootstrap support relative to removal of rogue taxa alone, as one would expect if some of the nodes were accurate and others inaccurate. This point has already been clearly demonstrated for Tineoidea (Figure 5), but there are a few other instances just discussed and apparent from an inspection of Table 5.
Higher-level phylogeny of the Lepidoptera
In this section we review current understanding of major features of the ‘‘backbone’’ lepidopteran phylogeny -- relationships among superfamilies -- in light of this and other recent molecular studies. The discussion below refers primarily to Figure 3, which shows thedegen1topology condensed to superfamilies or the largest monophyletic fragments thereof. Our analyses also yield much new information about the monophyly of and basal divergences within superfamilies and families. However, we defer most discussion of such relationships to an ongoing series of studies on individual superfamilies or groups thereof in which the taxon sample is expanded beyond that included here (e.g., [8–11]; see Materials and Methods section on taxon sampling below). Figure 4. Base-composition distance diagrams derived from
analysis of thent123andnt123_degen1data sets for 483 taxa.
As is evident in Figure 3, molecular data abundantly confirm the existence of a highly asymmetrical topology at the base of lepidopteran phylogeny, first noted by Hennig ([31]fideKristensen [32]) and corroborated by subsequent morphological studies [32]. There is now very strong molecular support for a majority of those early major divergences. Among the non-ditrysian lineages, six of
the eight ‘‘backbone’’ nodes (nodes 2–9 in Figure 3), including the previously-recognized major clades Glossata, Heteroneura and Eulepidoptera (Figure 1), have bootstrap support of 95% or greater in one or more analyses, as does the clade Exoporia (node 28). There is also strong molecular support for several novel proposals, such as apparent non-monophyly of Palaephatidae Figure 5. Summary of phylogenetic analyses based on taxon (sub)sampling of Tineoidea.Summary phylogenetic trees are displayed with corresponding bootstrap percentages for analysis ofnt123andnt123_degen1data sets based on different taxon subsamples for Tineoidea. For ease and focus of presentation, only relationships among strongly supported, higher-level groupings are shown (see Figure 3). These groupings are:Tine: Tineidae –Eudarcia(20 taxa total);Psych = Psychidae (9 taxa total);Eudarcia(currently classified within Tineidae, 1 taxon);Compsoctena(currently classified within Eriocottidae; 1 taxon);NTD: non-tineoid Ditrysia (27 taxa total); and the non-ditrysian outgroup (not shown), which consist of Palaephatidae+Tischeriidae (5 taxa total).
(node 9) and the grouping of Lophocoronidae with Exoporia (node 27, see also Table S1), despite morphological evidence to the contrary. Some relationships, however, remain very weakly supported, for example at the base of Glossata (nodes 4 and 5), and there is striking lack of confirmation for some clades included in the working hypothesis of Figure 1A, such as Myoglossata, Neolepidoptera, and Lepidoptera excluding Micropterigidae. A detailed update on phylogeny and classification among the non-ditrysians will be provided in a separate, forthcoming publication. Support is also strong for early divergences within the Ditrysia (Figure 3, nodes 10–15). As argued above, the oldest lineages belong to the Tineoidea as previously defined, which now appear to be paraphyletic. Paraphyly for Tineoidea was also seen in the analysis of Mutanen et al. [5]. Support for this conclusion is further strengthened by the 1000 search replicate per bootstrap pseudoreplicate analysis ofdegen1 (Table 3). We will update the phylogeny and classification of groups currently placed in Tineoidea in a forthcoming publication that will propose a new family forEudarciaand relatives.
Our results provide very strong evidence that all non-tineoid ditrysians form a monophyletic group (node 14; BP = 100, all analyses) that divides basally into Yponomeutoidea +
Gracillar-ioidea (BP $97%, all analyses) versus all others (node 15; BP
$97%, all analyses). The latter corresponds to Apoditrysia sensu Minet [33,34] expanded [1] to include Gelechioidea. A relation-ship between gelechioids and Apoditrysia had been deemed plausible by Kristensen and Skalski [35] based on putative synapomorphies in male genital structures [36], proboscis morphology [37] and larval setal pattern.
In dramatic contrast to those in earlier-originating clades, ‘‘backbone’’ relationships in the Apoditrysiasensu latolargely lack strong support. Of the approximately 27 nodes within Apoditrysia sensu latoin Figure 3 which subtend two or more superfamilies (no classification fully matches our findings on superfamily definitions), all but three (Macroheterocera, ’Mimallonidae+ Doa’, ’Bomby-coidea+ Lasiocampidae’) have bootstrap supports ,50% in all analyses of the full 483-taxon data set; only one has bootstrap support as high as 71% (’Mimallonidae+Doidae’). Moreover, the majority of these 27 nodes do not even occur in the best trees from other analyses (Figure 3). Two additional "backbone" nodes attain bootstrap support.50% with more thorough bootstrap searches, namely, ’Macroheterocera+Pyraloidea+Hyblaeidae’ (BP, 71%) and ’Apoditrysia 2 Urodidae’ (BP, 57%; Table 3). Similarly challenging results are reported in all previous molecular studies of Figure 6. Base-composition distance diagrams ofnt123_degen1andnt123data sets for the 63 taxa in the Tineoidea test set.Both diagrams are drawn to the same scale, and units are ’per cent4100’. Bootstrap percentages$50% are displayed. Bootstrap percentages are based on analysis of total taxon-specific nucleotide compositions, as described in Materials and Methods. All terminal taxa are identified to genus fornt123
but not fornt123_degen1, due to the reduced compositional heterogeneity in the latter data set. The vertical bars identify those taxa used in a phylogenetic analysis (Figure 5) to test the effect of reduced compositional heterogeneity on the analysis ofnt123. The five sets of taxa whose inter-relationships are analyzed in Figure 5 are color- and/or symbol-coded (see key).
relationships in Apoditrysia [4–6], which appear to represent an exceptionally difficult phylogenetic problem.
Strong, node-by-node resolution of relationships among apodi-trysian superfamilies thus appears mostly beyond the reach of even this largest-ever data set. As detailed below, however, closer inspection shows on two grounds that substantial progress toward that goal has nonetheless been made. First, on a broad scale, the degen1 topology in Figure 3 shows much greater than random similarity to the morphology-based working hypothesis (Figure 1A), as well as close similarity to the results of our own (much smaller) previous studies (Figure 1B) and those of others (Figure 1C, [5]). Second, our experiments, after removal of ‘‘rogue’’ taxa and other forms of taxon subsampling, point to the existence of stronger signal for a number of putative clades in Apoditrysia than is evident in Figure 3 (Tables 4, 5, S1, S2; discussed below).
The ‘‘lower’’ (i.e., non-obtectomeran) Apoditrysia have been so problematic that the morphology-based working hypothesis (Figure 1A) postulates only one tentative grouping in this tree region, Cossoidea + Sesioidea + Zygaenoidea (sensu Kristensen [7]). This grouping is recovered entirely in our degen1 analysis (Figure 3), albeit with very low support. It is also recovered or nearly recovered, albeit with very low support, in all other analyses in this study (e.g. nt123; Figure S2) and in other recent reports [4– 6]. In the current study, bootstrap support for Cossoidea/ Sesioidea/Zygaenoidea is almost always increased in analyses of bothnt123and degen1from which rogue taxa have been deleted (Tables 4, 5), rising to 96% for nt123 with apoditrysian ‘‘AC rogues’’ removed. The 28 rogues (Text S1) include 10 of our 57 exemplars from Cossoidea/Sesioidea/Zygaenoidea, of which five represent the two problematic parasitic families of Zygaenoidea, Cyclotornidae and Epipyropidae. Thus, the 96% bootstrap value does not apply to the entire hypothesized clade as sampled here. Nonetheless, the dramatic increase in support, coupled with consistent recovery or near recovery of the clade in analyses of the full data set, suggests that strong underlying signal for Cossoidea+ Sesioidea + Zygaenoidea is both present and obscured by the inclusion of unstably placed taxa.
One of the striking points of approximate agreement between our findings and the largely morphological working hypothesis is the complete recovery of Obtectomera [34] in the slightly modified sense of van Nieukerken et al. [1] by our most conservative data set (degen1; Figure 3; node 20), albeit with very low support (BP = 6%). Very similar groupings, though always poorly supported, are also found in our other present analyses (Figure S2), as well other recent studies, provided that synonymous change is in some way down-weighted [4–6]. In this study, bootstrap support for Obtectomera underdegen1rises from 6% to 40% when the 47 rogue taxa identified byRNR(see Materials and Methods) are removed (Table 4), suggesting that unstably-placed taxa are indeed part of the reason for low support. The 33 apoditrysians among the 47 RNR rogues (Text S1) consist disproportionately of exemplars that are the sole representatives of their small, monobasic superfamilies (Table S1). Such taxa make up only 3% (10/344) of the Apoditrysia sampled, but constitute 27% (9/33) of the rogues. Thus, one obstacle to clear resolution of major groups, in a mega-diverse clade such as Apoditrysia, may be the difficulty of placing the many small, taxonomically isolated families that such clades typically include.
In ourdegen1analysis (Figure 3), the sister group to Obtectomera is Gelechioidea (node 19). Bootstrap support is very weak (14%), but rises with all forms of rogue taxon deletion (Table 4), to as high as 65%, suggesting again underlying signal obscured by unstably placed taxa. This grouping, or something like it (i.e., with inclusion of one or two small additional superfamilies), is found in all
previous analyses in which synonymous change is partially to completely excluded [4–6]; however, it is not supported bynt123 (Figure S2). It nevertheless seems likely that Gelechioidea are closely related to Obtectomera.
Within Obtectomera, there is now considerable molecular support for monophyly of Macroheterocera sensu van Nieukerken et al. [1], with the addition of Mimallonidae. Macroheterocera in this modified sense consists of Macrolepidoptera sensu Kristensen [7] minus the expanded concept of the butterflies (Papilionoidea sensu van Nieukerken et al. [1]). This group was recovered by the ML analysis of Mutanen et al. [5], and by some of the analyses of Regier et al. [4] and Cho et al. [6], without strong support. In the present study, it is recovered in all analyses of the full data set. Although the maximum bootstrap for the full data set is 64% (nt123_partitioned; Figure 3), support increases markedly with rogue deletion and other forms of taxon sub-sampling, to as high as 89% (Tables 4, 5), again suggesting strong underlying signal obscured by unstably placed taxa.
In all recent molecular studies [4–6], there has been consistent support for Pyraloidea, with or without the addition of one or two other small superfamilies, as nearest relatives to the Macroheter-ocera, though always with weak support. In the present study, the ML trees for all analyses of the full data set unite Pyraloidea alone with Macroheterocera, but with weak support. Support increases somewhat with rogue deletion/taxon-subsampling, to a high of 68% under nt123 (Tables 5, S2). Under degen1, the alternative grouping of Pyraloidea + Hyblaeidae with Macroheterocera, though not found in the ML tree, has higher bootstrap support, reaching 71% when search replication per bootstrap pseudorep-licate is raised to 1000 (Table 3). This grouping also occurs in the ML tree reported by Mutanen et al. [5]. It seems clear both that Pyraloidea are closely related to Macroheterocera, and that their proximity to Hyblaeidae remains possible but still problematic, as reported previously in our expanded study of Pyraloidea [10]. Sequencing of the enigmatic African genus Prodidactis, whose larvae, but not adults, are pyraloid-like [38], might help to resolve this problem.
Within Macroheterocera, as at the base of Apoditrysia, relationships among superfamilies remain largely unresolved, with a few possible exceptions. Lasiocampoidea are united with Bombycoidea in all of our analyses (Figure 3), with bootstrap support rising from# 63% to as high as 97% (nt123; Table 5) following rogue deletion. This long-accepted pairing [34,39] was strongly supported by the results of Cho et al. [6], and is also supported by morphological synapomorphies [40]. It seems likely to be real.
A second pairing supported by all of the present analyses is that of Mimallonoidea+ Doidae (Figure 3). Bootstrap support under nt123rises from 71% with the full taxon set to 85–92% following rogue deletion / taxon subsampling. Despite these encouraging molecular indicators, there are grounds for doubt: the grouping has no known morphological support, and did not emerge in previous molecular studies with smaller data sets. It contradicts the proposal by van Nieukerken et al. [1] of a superfamily Drepanoidea consisting of just Drepanidae, Cimeliidae and Doidae, but reinforces the recent separation of Doidae from Noctuoidea, with which it has never grouped in any molecular analysis despite sharing two seemingly strong morphological synapomorphies with that superfamily [41].
![Figure 1. Previous hypotheses of deep-level relationships in Lepidoptera. A. Composite working hypothesis based on morphology [7]](https://thumb-eu.123doks.com/thumbv2/123dok_br/18375795.355815/2.918.91.820.98.994/figure-previous-hypotheses-relationships-lepidoptera-composite-hypothesis-morphology.webp)