Mapping of a Novel Race Specific Resistance
Gene to Phytophthora Root Rot of Pepper
(Capsicum annuum) Using Bulked Segregant
Analysis Combined with Specific Length
Amplified Fragment Sequencing Strategy
Xiaomei Xu1,2, Juan Chao1,2, Xueli Cheng1,2, Rui Wang1,2, Baojuan Sun1,2, Hengming Wang1, Shaobo Luo1,2, Xiaowan Xu1, Tingquan Wu1,2, Ying Li1*
1Vegetable Research Institute, Guangdong Academy of Agricultural Sciences, Guangzhou, China, 2Guangdong Key Lab for New Technology Research of Vegetables, Guangzhou, China
Abstract
Phytophthora root rot caused byPhytophthora capsici(P.capsici) is a serious limitation to pepper production in Southern China, with high temperature and humidity. Mapping PRR resistance genes can provide linked DNA markers for breeding PRR resistant varieties by molecular marker-assisted selection (MAS). Two BC1populations and an F2population
derived from a cross betweenP.capsici-resistant accession, Criollo de Morelos 334 (CM334) andP.capsici-susceptible accession, New Mexico Capsicum Accession 10399 (NMCA10399) were used to investigate the genetic characteristics of PRR resistance. PRR resistance to isolate Byl4 (race 3) was controlled by a single dominant gene,PhR10, that was mapped to an interval of 16.39Mb at the end of the long arm of chromosome 10. Inte-gration of bulked segregant analysis (BSA) and Specific Length Amplified Fragment sequencing (SLAF-seq) provided an efficient genetic mapping strategy. Ten polymorphic Simple Sequence Repeat (SSR) markers were found within this region and used to screen the genotypes of 636 BC1plants, delimitingPhR10to a 2.57 Mb interval between markers
P52-11-21 (1.5 cM away) and P52-11-41 (1.1 cM). A total of 163 genes were annotated within this region and 31 were predicted to be associated with disease resistance.PhR10is a novel race specific gene for PRR, and this paper describes linked SSR markers suitable for marker-assisted selection of PRR resistant varieties, also laying a foundation for cloning the resistance gene.
Introduction
Phytophthora blight, caused byPhytophthora capsici(Leon.), is one of the most destructive pepper diseases worldwide [1]. Depending on the point of infection,P.capsicimay cause a11111
OPEN ACCESS
Citation:Xu X, Chao J, Cheng X, Wang R, Sun B, Wang H, et al. (2016) Mapping of a Novel Race Specific Resistance Gene to Phytophthora Root Rot of Pepper (Capsicum annuum) Using Bulked Segregant Analysis Combined with Specific Length Amplified Fragment Sequencing Strategy. PLoS ONE 11(3): e0151401. doi:10.1371/journal.pone.0151401
Editor:Mark Gijzen, Agriculture and Agri-Food Canada, CANADA
Received:August 26, 2015
Accepted:February 26, 2016
Published:March 18, 2016
Copyright:© 2016 Xu et al. This is an open access article distributed under the terms of theCreative Commons Attribution License, which permits unrestricted use, distribution, and reproduction in any medium, provided the original author and source are credited.
Data Availability Statement:All relevant data are within the paper and its Supporting Information files.
several different disease syndromes, including root rot, stem rot, fruit rot and foliar blight in pepper [2]. Phytophthora root rot (PRR) of pepper, usually causing plant death, is the most serious pepper disease and may lead to total crop failure [3]. Currently, chemical control is the main management strategy for PRR, which not only increases production costs, but also results in environmental pollution. Utilization of resistant varieties is the most economical and environmentally friendly strategy to prevent this disease [4].
Host resistance, one form of disease resistance in plants, is characterized by specific plant varieties resisting infection by one or a few pathogenic races but being susceptible to other races [5]. Though the inheritance of resistance toP.capsiciin pepper is complex and differs among plant populations, disease screening conditions and pathogen isolates, two distinct types of host resistance toP.capsicion pepper have been reported: (1) race-specific resistance controlled by a single dominant gene [2,6,7] and (2) partial resistance conferred by quantita-tive trait loci (QTLs) acting together [8–10].
Identification and mapping of resistance genes and QTLs conferring partial resistance toP.
capsiciin pepper is a prerequisite to MAS forP.capsiciresistance. To date, almost one hundred QTLs forP.capsiciresistance in pepper have been identified [8–15]. The majority of the QTLs have been identified on chromosome 5, and are considered to reflect a major effect locus that has been detected in all of the resistant pepper accessions studied to date [16]. Several types of linked markers for this major QTL have been developed, including Sequence Characterized Amplified Region (SCAR) and Randomly Amplified Polymorphic DNA (RAPD) markers [17, 18], Bacterial Artificial Chromosome (BAC)-derived markers [11] and recently developed SNP markers [19]. These diagnostic markers offer promise toward MAS forP.capsiciresistance in pepper. In contrast to several recent reports of QTLs conferring partial resistance toP.capsici, no race-specific resistance gene has been identified, although resistance againstP.capsiciin pepper had been reported to be controlled by a single dominant gene [2,6,7]. Interestingly, a novel gene that inhibits resistance toP.capsici(Ipcr) was found in aP.capsici-susceptible accession, NMCA10399 [20]. When the mostP.capsici-resistant accession, CM334 [21], was hybridized with NMCA10399, the resultant F1populations were completely susceptible and
the F2displayed a 3:13 (R: S) segregation ratio toP.capsici-induced root rot and foliar blight
disease, indicating that theIpcrgene has an epistatic dominant effect over the dominant resis-tance genes for root rot and foliar blight.
Bulked segregant analysis (BSA), first proposed by Michelmore et al. [22], has been used for more than 20 years to identify molecular markers linked to a target gene or major QTL affect-ing a trait of interest [23–25]. BSA is a rapid and effective method that involves genotyping only two bulked DNA samples, respectively from groups of individuals with distinct pheno-types (for example, resistant and susceptible). However, it is a challenge for researchers to develop thousands of candidate molecular markers to screen the pools to find a small subset of markers diagnostic of the target phenotype.
A newly developed technology, SLAF-seq, combines high-throughput and reduced repre-sentation library (RRL) sequencing, offering an efficient and high-resolution strategy for genome-wide genotyping [26]. SLAF-seq has been used for genetic map construction and QTL analysis in sesame [27], soybean [28,29] and cucumber [30,31]. New strategies have recently been proposed to take advantage of the power of both BSA and SLAF-seq technologies. Two examples have been reported, delineating a maize inflorescence meristem mutant to a region of 3.947 Mb [32], and identifying major QTLs associated with rice grain weight [33].
In the present study, we aimed to (1) investigate the inheritance mode of PRR resistance against a specific race ofP.capsici, (2) find PRR resistance gene-containing regions by integrat-ing BSA with SLAF-seq technology, (3) develop SSR markers and segregatintegrat-ing populations to carry out linkage analysis and narrow down the size of the gene-containing regions, providing
and Guangdong Science and Technology Project (2014A020208045) XWX.
diagnostic SSR markers for MAS of PRR resistant varieties and laying a foundation for cloning the resistance gene.
Materials and Methods
Plant materials and growth conditions
CM334, a landrace from Mexico, with the highest known resistance toP.capsici, was used as resistant parent (female) and NMCA10399, aP.capsici-susceptible accession [20], was used as susceptible parent (male). Derived from CM334 and NMCA10399, two BC1populations,
(CM334×NMCA10399)×CM334, comprising 222 plants and (CM334×NMCA10399)×NMC A10399, of 372 individuals, respectively, and an CM334×NMCA10399 F2population of 259
plants were used for genetic analysis. After genetic analysis of PRR resistance, a third BC1
population [(CM334×NMCA10399)×NMCA10399] of 436 individuals was then used to screen for PRR-resistant or PRR-susceptible plants to construct a resistant DNA pool (R-pool) and a susceptible DNA pool (S-(R-pool). According to the result of marker-trait associa-tion, a fourth BC1population [(CM334×NMCA10399)×NMCA10399] of 636 individuals
was genotyped and phenotyped to finely map the PRR resistance gene. All plant materials were grown in 32-cell plastic trays filled with plant growth medium (Floragard, Germany). Three seeds per cell were sown. Seedlings were watered twice a day and kept in a greenhouse in whichP.capsiciis not normally encountered, at 25±5 and 18±5°C day and night tempera-tures, respectively, with a 12-h photoperiod. Plants were kept in the greenhouse until the four-to-six true leaf stage before treatment withP.capsici.
Phenotype screening of PRR resistance
P.capsiciisolate Byl4 was used as inoculum for PRR resistance screening. Byl4, which is identi-fied as race 3 (data not show) was isolated from infected pepper plants in 2012 in Baiyun field, Guangzhou, Guangdong province, China. To screen for PRR reaction, plants at the four-to-six true leaf stage were tested as described by Bosland and Lindsey [3] with modifications. The plants grown individually in 32-cell plastic trays were watered 12h before inoculation, and then the soil of each cell was injected with 5 ml inoculum, counted with Bright-Line™ Hemacytome-ter (Hausser Scientific, USA), in a concentration of 1 × 10⁴zoospores/ml. The treated plants were kept in a controlled plant growth chamber (RTOP-1000Y), at 25°C in darkness for 24h with 80% relative humidity, and then kept at 25°C with 14-h light and 10-h dark cycle. The plants were scored for PRR when the stem of susceptible control NMCA10399 become tan or slightly darkened at the soil line, about 3 days after treatment. We scored once a day until all susceptible control plants showed symptoms (about 10 days after treatment). The plants with no symptoms were considered resistant, while plants showing symptoms ranging from slight root-stem darkening to death were all considered susceptible.
DNA extraction and pool construction
Total genomic DNA was isolated from young leaves of parents and BC1plants using a CTAB
(cetyl trimethylammonium bromide) method with minor modifications [34]. DNA was quan-tified using a NanoDrop 2000 spectrophotometer (Thermo Scientific, USA). Fifty PRR resis-tant plants and fifty susceptible plants were selected from the BC1population of 436
SLAF library construction and sequencing
The present study used the reference genome of CM334, with an assembled size of 3.06 Gb (http://peppergenome.snu.ac.kr/, V. 1.55). A simulated restriction enzyme digestion was car-ried out to establish conditions to optimize SLAF yield, avoid repetitive SLAFs, and obtain an even distribution of SLAFs for maximum SLAF-seq efficiency. Based on the results of this pre-liminary experiment, genomic DNA of two parents and pools were digested with theHaeIII restriction enzyme, andArabidopsis thalianawas used as control to assess the effectiveness of enzyme digestion. The SLAF libraries were constructed according to procedures described by Sun et al. [26]. The average SLAF sequencing depth should be at least 10x for each parent to cover all SNP sites, and 1x for each progeny (50 progenies for each pool) to eliminate back-ground noises. To obtain higher coverage for pools, more samples of pool libraries should be added in the final solution than of the parents when sequenced. DNA fragments of 314-364bp were selected as SLAFs and prepared for paired-end sequencing on an Illumina High-seq 2500 platform (Illumina, Inc.; San Diego, CA, US) at Beijing Biomarker Technologies Corporation (http://www.biomarker.com.cn).
Sequence data analysis and SLAF definition
Raw sequence reads (101bp in length) were filtered and trimmed for quality and adaptor removal, with 80-bp paired sequences retained at each end. The trimmed reads were then clus-tered based on sequence similarity (90% identity) among the four libraries (two parents and two pools) by BLAST as described by Kent [35]. All SLAFs were used to estimate sequence depth of parents and pools. SLAFs were defined based on parental sequences and pools were genotyped based on similarity to parental sequences. As a diploid species, pepper SLAFs with more than 4 tags were defined as repetitive SLAFs, those with only 1 tag were defined as mono-morphic SLAFs, and those with 2–4 tags were polymono-morphic SLAFs. High-quality polymono-morphic SLAFs for which parents are both homozygous and with a summed sequence depth more than 5 fold were used for association studies.
Association analysis
The SNP-index algorithm is a method useful to find significant differences of genotype fre-quency between DNA pools. As an SNP-index method [36], we used SLAF depth within a DNA pool as genotype frequency. TheΔ(SNP-index) was calculated based on SNP-index (Rp)
= SRp/(SRp+RRp), and SNP-index (Sp) = SSp/(SSp+RSp), withΔ(SNP-index) = SNP-index (Sp
)-SNP-index (Rp). RRpand SRprepresent the depth of the R-pool derived from resistant and
sus-ceptible parents, respectively; and RSpand SSpindicate the depth of the S-pool derived from
resistant and susceptible parents, respectively. As we used a BC1population for mapping, the
upper limitΔ(SNP-index) of the trait—associated SLAFs is expected to be 0.5. We carried out Loess regression fitting to determine and obtain the threshold for significance of marker-trait associations as described by Hill et al. [37]. The regions over the threshold were considered as trait related candidate regions.
SSR marker development and genotyping
were used to genotype the BC1population of 636 individuals. PCR was performed as described
by Piquemal et al. [39] with minor modifications: 94°C for 5 min; 8 cycles of 94°C for 35 s, 57°C for 30 s and 72°C for 30 s; followed by 8 cycles of 94°C for 35 s, 53°C for 30 s and 72°C for 30 s; then 20 cycles of 94°C for 35 s, 55°C for 30 s and 72°C for 30 s, and a final incubation at 72°C for 7 min. PCR products were separated on an 8% polyacrylamide denaturing sequencing gel and visualized by silver nitrate staining.
Genetic analysis and linkage map construction
To determine the mode of inheritance of PRR resistance, Chi-squared (χ2) analysis was carried out to test the phenotypic data for goodness-of-fit to Mendelian segregation ratios. Using the phenotype and genotype data from the 636 BC1plants, a linkage map was constructed with
Mapmaker/EXP 3.0 [40], using a LOD threshold of 3.0.
Results
Genetic analysis of PRR resistance
Two BC1populations and an F2population derived from a cross between CM334 and
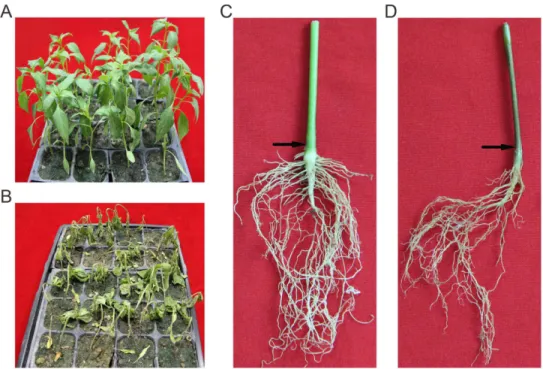
NMCA10399 were used to investigate the genetic characteristics of PRR resistance. In pheno-type screening experiments, all 41 plants of the resistant parent (CM334) showed resistance with no lesions observed, while the 66 plants of the susceptible parent (NMCA10399) were all dead 9 days after treatment (Fig 1). The backcross population,
(CM334×NMCA10399)×CM334, comprising 222 plants, all displayed resistance. Among the other backcross population, (CM334×NMCA10399)×NMCA10399, of 372 individuals, 177 plants showed resistance and 195 were susceptible, values which did not deviate significantly from a 1:1 segregation ratio (χ2= 0.78, P>0.05). Of the 259 F2plants, 190 were resistant and
Fig 1. Symptoms forP.capsiciinduced root rot of pepper.A, The phenotype of CM334 9 days inoculation. B, The phenotype of NMCA10399 9 days inoculation. C, Roots of CM334 9 days post-inoculation. D, Roots of NMCA10399 9 days post-post-inoculation. The arrows indicate the stem at the soil line.
69 were susceptible, with a 2.75:1 segregation ratio that did not deviate significantly from a 3:1 ratio (χ2= 0.29, P>0.05). Each of these results indicated that PRR resistance to isolate Byl4
was controlled by a single dominant gene.
SLAF-seq data analysis and SLAF identification
Four samples yielded a total of 74.79 million paired-end reads with 80-bp valid read length, and an average Q30 (error rate of 0.1% per base) ratio of 86.1% (Table 1). After clustering, 250,871 SLAFs were procured. The average sequence depths of SLAFs were ~34.0 and ~23.1 fold in resistant (CM334) and susceptible parent (NMCA10399), respectively; and ~64.1 and ~58.8 fold in the R-pool and S-pool, respectively (Table 1). Mapping these SLAFs on the refer-ence genome of CM334, we calculated the SLAF numbers on each chromosome (Table 2) and could see SLAFs distributing evenly on chromosomes (S1 Fig), suggesting good representation of the genome. These SLAFs were divided into three types: 77.94% (195,534) monomorphic, 1.77% (4,454) repetitive, and 20.28% (50,883) polymorphic. A total of 42,036 polymorphic SLAFs (Table 2,S2 Fig) for which parents are both homozygous and with a summed sequence depth more than 5 fold, were used to do marker-trait association studies.
Marker-trait associations
For the high-quality polymorphic SLAFs, SNP-index (Rp) and SNP-index (Sp) were calculated,
used as described to determineΔ(SNP-index), and mapped to their position in the CM334 ref-erence genome. To locate trait related candidate regions, we carried out Loess regression fitting
Table 1. Summary of sequencing data for parental lines and DNA pools.
Sample ID Total reads Q30 (%) Average depth
CM334 12,982,436 88.14 33.99
NMCA10399 9,634,836 87.65 23.06
R-pool 26,780,391 85.84 64.06
S-pool 25,399,611 85.09 58.79
doi:10.1371/journal.pone.0151401.t001
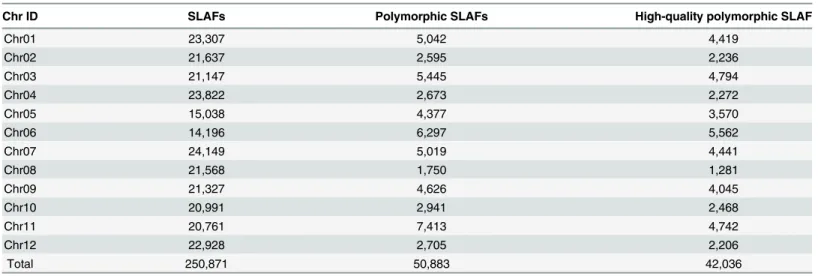
Table 2. Distribution of SLAFs, polymorphic SLAFs and high-quality polymorphic SLAFs over the pepper chromosomes.
Chr ID SLAFs Polymorphic SLAFs High-quality polymorphic SLAF
Chr01 23,307 5,042 4,419
Chr02 21,637 2,595 2,236
Chr03 21,147 5,445 4,794
Chr04 23,822 2,673 2,272
Chr05 15,038 4,377 3,570
Chr06 14,196 6,297 5,562
Chr07 24,149 5,019 4,441
Chr08 21,568 1,750 1,281
Chr09 21,327 4,626 4,045
Chr10 20,991 2,941 2,468
Chr11 20,761 7,413 4,742
Chr12 22,928 2,705 2,206
Total 250,871 50,883 42,036
See‘Materials and methods’for the definition of‘SLAFs’,‘polymorphic SLAFs’and‘high-quality polymorphic SLAFs’.
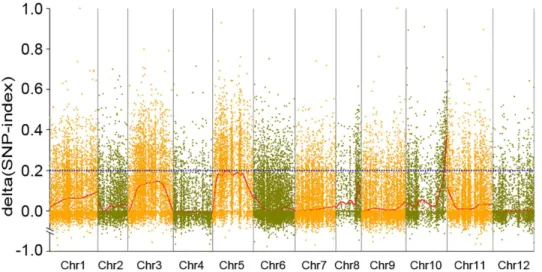
of theΔ(SNP-index) resulting from these SLAFs. The marker-trait association threshold was 0.19 after Loess regression fitting and a total of 7,526 SLAFs exceeding the threshold level, suggesting significant differences between the pools. As a result, we found an interval of 217.17–233.56 (16.39) Mb at the end of the long arm of chromosome 10 with one hundred and thirty-nine SLAF markers consistently exceeding the association-threshold (Fig 2). In this interval, a sub-region containing three consecutive SLAFs with SNP-index (Sp) of 1 was found, suggesting thePhR10gene may be in or very near it.
Validation and mapping
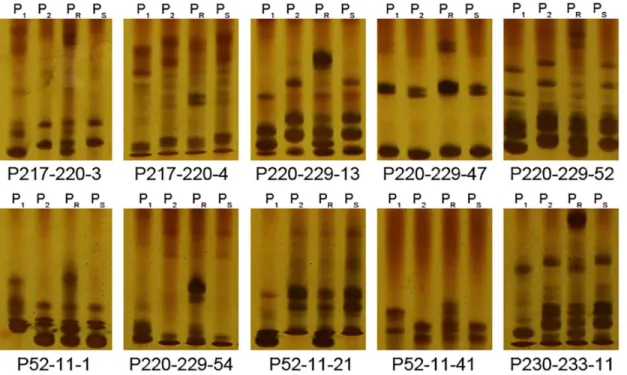
The sequences of the PRR resistance related region (16.39 Mb) were downloaded from the CM334 reference genome (http://peppergenome.snu.ac.kr/). A total of 197 Simple Sequence Repeat (SSR) sites were found in the region by using the SSRHunter 1.3 software. Primers were designed and screened for polymorphisms between both the parents and pools. Two SSR mark-ers polymorphic between the parents but not the pools were not used in further analysis. Only 10 SSR markers (S1 Table) were polymorphic between both the parents and the pools with het-erozygous amplicons in R-pool and homozygous amplicons the same as NMCA10399 in S-pool (Fig 3), suggesting the marker and trait are associated, which confirmed the association analysis was reliable. These 10 markers were used to screen the genotypes of 636 BC1plants
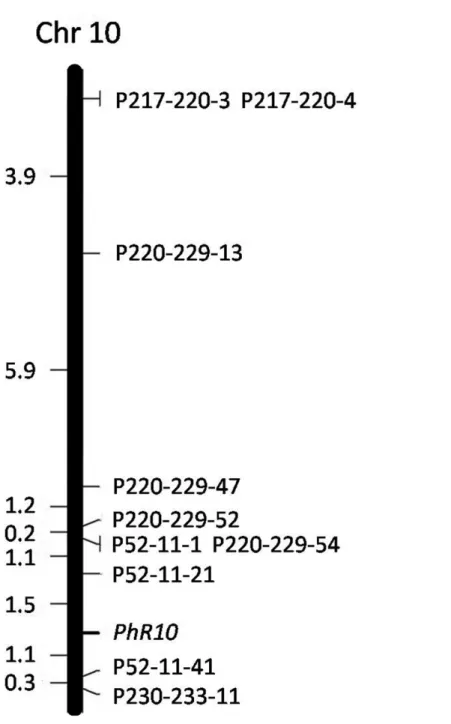
used for genetic linkage analysis. The trait-related locusPhR10was flanked by SSR markers P52-11-21 and P52-11-41 at distance of 1.5 and 1.1 cM, respectively (Fig 4).
Gene annotation and candidate gene prediction
SSR markers P52-11-21 and P52-11-41 are at positions 229,191,632 and 231,757,882, respec-tively, delineating approximately 2.57Mb of DNA that containsPhR10. According to a pepper gene annotation database (http://peppergenome.snu.ac.kr/, V. 1.55), 163 genes were annotated within this region. Among these genes, 31 were predicted to be associated with disease resis-tance (S2 Table).
Fig 2. Graph ofΔ(SNP-index) from analysis of SLAF-seq marker-trait association.TheX-axis represents chromosomal position and theY-axis representsΔ(SNP-index). The blue dashed line indicates the association-threshold. A region related to PRR resistance was identified in pepper chromosome 10 (217.17–233.56 Mb interval) where theΔ(SNP-index) consistently exceeded the association-threshold. HigherΔ(SNP-index) indicates stronger association.
Discussion
The genome size of pepper is large, estimated to be 3.48 Gb [41]. Whole genome deep re-sequencing or low coverage re-sequencing is relatively costly for large genomes and usually unnecessary for gene/QTL mapping. RRL sequencing is one strategy to bring down the cost by genome reduction, sampling and sequencing a small subset of genomic segments instead of the whole genome [42]. SLAF-seq is a recently developed enhanced RRL sequencing strategy for genome-wide SNP discovery and has been used for linkage map construction and QTL analysis in organisms such as sesame [27], soybean [28,29] and cucumber [30,31]. In this study, we used BSA combined with SLAF-seq strategy to do preliminary mapping of PRR resistance gene, generating a total of 74.79 million paired-end reads with 80-bp valid read length, devel-oping 50,883 (20.28%) polymorphic SLAFs with the proportion of polymorphic SLAFs ranging from 8.11% (1,750 of 21,568) on chromosome 8 to 44.36% (6,297 of 14,196) on chromosome 6 (Table 2), suggesting biased distribution of polymorphic markers (SLAFs) among chromo-somes. This conforms to other result that chromosome 8 showed the lowest density of SNP dis-tribution [41], indicating a relatively low evolution pressure in it. Finally, 42,036 high-quality polymorphic SLAFs were used to do marker-trait association analysis and a PRR resistance related region of 16.39Mb was found at the end of the long arm of chromosome 10. This showed that BSA combined with SLAF-seq is a rapid and effective method for initial gene map-ping and laid a foundation for gene fine mapmap-ping.
To date, no race-specific resistance genes had been identified, although resistance againstP.
capsiciin pepper had been reported to be controlled by a single dominant gene [2,6,7]. Results in this study showed that under the inoculation of race 3, which was the dominant physiologi-cal race ofP.capsicion pepper in Guangdong province of China [43], a dominant PRR resis-tance genePhR10was identified and mapped on chromosome 10. However, interestingly, a novel geneIpcrhaving an epistatic dominant effect over the dominant resistance genes for root
Fig 3. Gel images of 10 polymorphic SSR markers in parents and pools.P1, P2, PRand PSrepresent the resistant parent CM334, susceptible parent
NMCA10399, resistant pool and susceptible pool, respectively.
rot and foliar blight was found by using genetic populations derived from CM334 and NMCA10399 [20], which were the same parents used in our study. At first view, it sounds inconceivable, as the methods of phenotype screening of PRR resistance were also almost the same, only with a difference in final concentration of inoculum, 5× 10⁴zoospores/plant in our study and 1 × 10⁴zoospores/plant in that. In addition, to test the effect ofIpcron race-specific resistance,P.capsiciraces -1(American Type culture Collection, ATCC: MYA-2289), -2
(ATCC: MYA-2291), and -12(not in ATCC) isolated fromC.annuumin New Mexico and
Fig 4. Genetic linkage map ofPhR10constructed from the BC1population of (CM334×NMCA10399)×N
MCA10399.Map distance in Kosambi centiMorgans (cM) is on the left, SSR markers are arranged on the right.
race-15(ATCC: MYA-2339) isolated fromC.annuumin New Jersey were used to inoculate populations for root rot and foliar blight. Results showed thatIpcrhad an epistatic dominant effect over the dominant resistance genes for root rot when treated with four races (race -1, race -2, race -12and race -15) and only one race (races -1) for foliar blight, indicating thatIpcr
interferes with tissue- and race-specific resistance forP.capsici. Therefore, we inferred that the different physiological races ofP.capsiciused in these two studies are the causes of different results.
The number and position ofP.capsiciresistance QTLs identified in a study vary depending on populations used, disease screening conditions, traits measured to reflect disease, and iso-lates ofP.capsici. Almost one hundred QTLs forP.capsiciresistance in pepper have been iden-tified [8–15], with a consistently identified QTL on chromosome 5 considered to be a major QTL for resistance toP.capsici[16,19]. Most other previously reported QTLs were located on chromosomes 6, 9, 11 and 12 [44]. Thabuis et al. [9] performed QTL analysis by using three different intraspecific pepper populations. Two QTLs for PRR resistance were consistent in two populations, located at the end of the short arm of chromosome 10. Additionally, three iso-late-specific QTLs associated with PRR resistance were detected in the middle of chromosome 10 and another was found at the end of the short arm of chromosome 10 [8]. In the present study, a PRR resistance toP.capsicirace 3 related region at the end of the long arm of chromo-some 10 [217.17–233.56 (16.39) Mb] was detected by a strategy combining BSA with SLAF-seq technology, and was verified by classical genetic mapping. The location of this PRR race spe-cific resistance gene is clearly different from previously identified QTLs on chromosome 10.
Breeding resistant cultivars remains the most effective strategy to reduce losses caused byP.
capsici. Physiological race differentiation exists in theP.capsici-C.annuuminteraction [45, 46] and different genes confer resistance to different physiological races ofP.capsici[6]. It may be impossible to breed a resistant cultivar with universal resistance to allP.capsiciraces on pepper, but it may be possible to breed for resistance to isolates found in specific growing regions. In Guangdong province of China, the dominant physiological race ofP.capsicion pep-per is race 3 [43]. In this study, we identified a locus,PhR10, at which one allele confers resis-tance toP.capsiciisolates Byl4 which was identified as race 3. The flanking SSR markers P52-11-21 and P52-11-41, respectively 1.5 and 1.1 cM fromPhR10, will be convenient tools for MAS of PRR resistance in pepper breeding program.
Supporting Information
S1 Fig. Distribution of total SLAFs on chromosomes.
(TIF)
S2 Fig. Distribution of high-quality polymorphic SLAFs on chromosomes.
(TIF)
S1 Table. Description of 10 polymorphic SSR markers.
(DOCX)
S2 Table. Annotated genes associated with disease resistance.
(XLSX)
Acknowledgments
Author Contributions
Conceived and designed the experiments: XMX YL TQW. Performed the experiments: JC XLC RW. Analyzed the data: XMX TQW XWX. Contributed reagents/materials/analysis tools: YL HMW SBL BJS. Wrote the paper: XMX TQW.
References
1. Leonian LH. Stem and fruit blight of peppers caused byPhytophthora capsici. Phytopathology. 1922; 9: 401–408.
2. Sy O, Bosland PW, Steiner R. Inheritance of phytophthora stem blight resistance as compared to phy-tophthora root rot and phyphy-tophthora foliar blight resistance inCapsicum annuumL. J Am Soc Hortic Sci. 2005; 1: 75–78.
3. Bosland PW, Lindsey DL. A seedling screen for phytophthora root rot of pepper,Capsicum annuum. Plant Dis. 1991; 10: 1048–1050.
4. Hausbeck MK, Lamour KH.Phytophthora capsicion vegetable crops: research progress and manage-ment challenges. Plant Dis. 2004; 12: 1292–1303.
5. Király L, Barna B, Király Z. Plant resistance to pathogen infection: forms and mechanisms of innate and acquired resistance. J Phytopathol. 2007; 7–8: : 385–396.
6. Monroy-Barbosa A, Bosland PW. Genetic analysis of phytophthora root rot race-specific resistance in chile pepper. J Am Soc Hortic Sci. 2008; 6: 825–829.
7. Walker SJ, Bosland PW. Inheritance of phytophthora root rot and foliar blight resistance in pepper. J Am Soc Hortic Sci. 1999; 1: 14–18.
8. Truong HTH, Kim KT, Kim DW, Kim S, Chae Y, Park JH, et al. Identification of isolate-specific resis-tance QTLs to phytophthora root rot using an intraspecific recombinant inbred line population of pepper (Capsicum annuum). Plant Pathol. 2012; 1: 48–56.
9. Thabuis A, Palloix A, Pflieger S, Daubeze AM, Caranta C, Lefebvre V. Comparative mapping of Phy-tophthoraresistance loci in pepper germplasm: evidence for conserved resistance loci across Solana-ceae and for a large genetic diversity. Theor Appl Genet. 2003; 8: 1473–1485.
10. Lefebvre V, Palloix A. Both epistatic and additive effects of QTLs are involved in polygenic induced resistance to disease: a case study, the interaction pepper—Phytophthora capsiciLeonian. Theor Appl Genet. 1996; 4: 503–511.
11. Kim HJ, Nahm SH, Lee HR, Yoon GB, Kim KT, Kang BC, et al. BAC-derived markers converted from RFLP linked toPhytophthora capsiciresistance in pepper (Capsicum annuumL.). Theor Appl Genet. 2008; 1: 15–27.
12. Bonnet J, Danan S, Boudet C, Barchi L, Sage-Palloix AM, Caromel B, et al. Are the polygenic architec-tures of resistance toPhytophthora capsiciandP.parasiticaindependent in pepper? Theor Appl Genet. 2007; 2: 253–264.
13. Minamiyama Y, Tsuro M, Kubo T, Hirai M. QTL Analysis for resistance toPhytophthora capsiciin pep-per using a high density SSR-based map. Breeding Sci. 2007; 2: 129–134.
14. Ogundiwin EA, Berke TF, Massoudi M, Black LL, Huestis G, Choi D, et al. Construction of 2 intraspe-cific linkage maps and identification of resistance QTLs forPhytophthora capsiciroot-rot and foliar-blight diseases of pepper (Capsicum annuumL.). Genome. 2005; 4: 698–711.
15. Sugita T, Yamaguchi K, Kinoshita T, Yuji K, Sugimura Y, Nagata R, et al. QTL analysis for resistance to phytophthora blight (Phytophthora capsiciLeon.) using an intraspecific doubled-haploid population of
Capsicum annuum. Breeding Sci. 2006; 2: 137–145.
16. Mallard S, Cantet M, Massire A, Bachellez A, Ewert S, Lefebvre V. A key QTL cluster is conserved among accessions and exhibits broad-spectrum resistance toPhytophthora capsici: a valuable locus for pepper breeding. Mol Breeding. 2013; 2: 349–364.
17. Truong HTH, Kim JH, Cho MC, Chae SY, Lee HE. Identification and development of molecular markers linked to phytophthora root rot resistance in pepper (Capsicum AnnuumL.). Eur J Plant Pathol. 2013; 2: 289–297.
18. Quirin EA, Ogundiwin EA, Prince JP, Mazourek M, Briggs MO, Chlanda TS, et al. Development of sequence characterized amplified region (SCAR) primers for the detection ofPhyto.5.2, a major QTL for resistance toPhytophthora capsiciLeon. in pepper. Theor Appl Genet. 2005; 4: 605–612.
20. Reeves G, Monroy-Barbosa A, Bosland PW. A novelCapsicumgene inhibits host-specific disease resistance toPhytophthora capsici. Phytopathology. 2013; 5: 472–478.
21. Ortega RG, Español CP, Zueco JC. Genetics of resistance toPhytophthora capsiciin the pepper line SCM-334. Plant Breeding. 1991; 1: 50–55.
22. Michelmore RW, Paran I, Kesseli RV. Identification of markers linked to disease-resistance genes by bulked segregant analysis: a rapid method to detect markers in specific genomic regions by using seg-regating populations. Proceedings of the National Academy of Sciences. 1991; 21: 9828–9832. 23. Chagué V, Mercier JC, Guénard M, de Courcel A, Vedel F. Identification of RAPD markers linked to a
locus involved in quantitative resistance to TYLCV in tomato by bulked segregant analysis. Theor Appl Genet. 1997; 4: 671–677.
24. Huang Q, Li X, Chen WQ, Xiang ZP, Zhong SF, Chang ZJ, et al. Genetic mapping of a putative Thino-pyrum intermedium-derived stripe rust resistance gene on wheat chromosome 1B. Theor Appl Genet. 2014; 4: 843–853.
25. Yi B, Chen YN, Lei SL, Tu JX, Fu TD. Fine mapping of the recessive genic male-sterile gene (Bnms1) inBrassica napusL. Theor Appl Genet. 2006; 4: 643–650.
26. Sun XW, Liu DY, Zhang XF, Li WB, Liu H, Hong WG, et al. SLAF-seq: an efficient method of large-scale de novo SNP discovery and genotyping using high-throughput sequencing. Plos One. 2013; 3: e58700.
27. Zhang YX, Wang LH, Xin HG, Li DH, Ma CX, Ding X, et al. Construction of a high-density genetic map for sesame based on large scale marker development by specific length amplified fragment (SLAF) sequencing. Bmc Plant Biol. 2013; 13: 141. doi:10.1186/1471-2229-13-141PMID:24060091 28. Li B, Tian L, Zhang JY, Huang L, Han FX, Yan SR, et al. Construction of a high-density genetic map
based on large-scale markers developed by specific length amplified fragment sequencing (SLAF-seq) and its application to QTL analysis for isoflavone content inGlycine max. Bmc Genomics. 2014; 15: 1086. doi:10.1186/1471-2164-15-1086PMID:25494922
29. Qi ZM, Huang L, Zhu RS, Xin DW, Liu CY, Han X, et al. A high-density genetic map for soybean based on specific length amplified fragment sequencing. Plos One. 2014; 8: e104871.
30. Wei QZ, Wang YZ, Qin XD, Zhang YX, Zhang ZT, Wang J, et al. An SNP-based saturated genetic map and QTL analysis of fruit-related traits in cucumber using specific-length amplified fragment (SLAF) sequencing. Bmc Genomics. 2014; 15: 1158. doi:10.1186/1471-2164-15-1158PMID:25534138 31. Xu XW, Xu RX, Zhu BY, Yu T, Qu WQ, Lu L, et al. A high-density genetic map of cucumber derived
from Specific Length Amplified Fragment sequencing (SLAF-seq). Front Plant Sci. 2014; 5: 768. doi: 10.3389/fpls.2014.00768
32. Xia C, Chen LL, Rong TZ, Li R, Xiang Y, Wang P, et al. Identification of a new maize inflorescence meri-stem mutant and association analysis using SLAF-seq method. Euphytica. 2015; 1: 35–44.
33. Xu FF, Sun X, Chen YL, Huang Y, Tong C, Bao JS. Rapid identification of major QTLs associated with rice grain weight and their utilization. Plos One. 2015; 3: e122206.
34. Allen GC, Flores-Vergara MA, Krasynanski S, Kumar S, Thompson WF. A modified protocol for rapid DNA isolation from plant tissues using cetyltrimethylammonium bromide. Nat Protoc. 2006; 5: 2320–
2325.
35. Kent WJ. BLAT—the BLAST-like alignment tool. Genome Res. 2002; 4: 656–664.
36. Abe A, Kosugi S, Yoshida K, Natsume S, Takagi H, Kanzaki H, et al. Genome sequencing reveals agro-nomically important loci in rice using MutMap. Nat Biotechnol. 2012; 2: 174–178.
37. Hill JT, Demarest BL, Bisgrove BW, Gorsi B, Su YC, Yost HJ. MMAPPR: mutation mapping analysis pipeline for pooled RNA-seq. Genome research. 2013; 4: 687–697.
38. Li Q, Wan JM. SSRHunter: development of a local searching software for SSR sites. Hereditas. 2005; 2: 808–810
39. Piquemal J, Cinquin E, Couton F, Rondeau C, Seignoret E, Doucet I, et al. Construction of an oilseed rape (Brassica napusL.) genetic map with SSR markers. Theor Appl Genet. 2005; 8: 1514–1523. 40. Lander ES, Green P, Abrahamson J, Barlow A, Daly MJ, Lincoln SE, et al. MAPMAKER: an interactive
computer package for constructing primary genetic linkage maps of experimental and natural popula-tions. Genomics. 1987; 2: 174–181.
41. Kim S, Park M, Yeom SI, Kim YM, Lee JM, Lee HA, et al. Genome sequence of the hot pepper provides insights into the evolution of pungency inCapsicumspecies. Nat Genet. 2014; 3: 270–278.
43. Li ZJ, Long WP, Zheng JR, Lei JJ. Isolation and identification ofPhytophthora capsiciin Guangdong province and measurement of their pathogenicity and physiological race differentiation. Journal of South China Agricultural University. 2007; 1: 50–54.
44. Liu WY. Comparative genetics of resistance to Phytophthora in pepper and strategies to improve marker resources. New York: Cornell University Press; 2006.
45. Glosier BR, Ogundiwin EA, Sidhu GS, Sischo DR, Prince JP. A differential series of pepper (Capsicum annuum) lines delineates fourteen physiological races ofPhytophthora capsici. Euphytica. 2008; 1: 23–30.