Crowdsourcing as a Screening Tool to Detect
Clinical Features of Glaucomatous Optic
Neuropathy from Digital Photography
Danny Mitry1, Tunde Peto1, Shabina Hayat2, Peter Blows1, James Morgan3, Kay-Tee Khaw4, Paul J. Foster1*
1NIHR Biomedical Research Centre, Moorfields Eye Hospital and UCL Institute of Ophthalmology, London, United Kingdom,2Department of Public Health and Primary Care, University of Cambridge, Strangeways Research Laboratory, Cambridge, United Kingdom,3School of Optometry and Vision Sciences, Cardiff University, Cardiff, United Kingdom,4Department of Clinical Gerontology, Addenbrookes Hospital, University of Cambridge, Cambridge, United Kingdom
Abstract
Aim
Crowdsourcing is the process of simplifying and outsourcing numerous tasks to many un-trained individuals. Our aim was to assess the performance and repeatability of crowdsourc-ing in the classification of normal and glaucomatous discs from optic disc images.
Methods
Optic disc images (N = 127) with pre-determined disease status were selected by consen-sus agreement from grading experts from a large cohort study. After reading brief illustrative instructions, we requested that knowledge workers (KWs) from a crowdsourcing platform (Amazon MTurk) classified each image as normal or abnormal. Each image was classified 20 times by different KWs. Two study designs were examined to assess the effect of varying KW experience and both study designs were conducted twice for consistency. Performance was assessed by comparing the sensitivity, specificity and area under the receiver operat-ing characteristic curve (AUC).
Results
Overall, 2,540 classifications were received in under 24 hours at minimal cost. The sensitivi-ty ranged between 83–88% across both trials and study designs, however the specificity was poor, ranging between 35–43%. In trial 1, the highest AUC (95%CI) was 0.64(0.62– 0.66) and in trial 2 it was 0.63(0.61–0.65). There were no significant differences between study design or trials conducted.
Conclusions
Crowdsourcing represents a cost-effective method of image analysis which demonstrates good repeatability and a high sensitivity. Optimisation of variables such as reward schemes,
OPEN ACCESS
Citation:Mitry D, Peto T, Hayat S, Blows P, Morgan J, Khaw K-T, et al. (2015) Crowdsourcing as a Screening Tool to Detect Clinical Features of Glaucomatous Optic Neuropathy from Digital Photography. PLoS ONE 10(2): e0117401. doi:10.1371/journal.pone.0117401
Academic Editor:William H. Merigan Jr., Univ Rochester Medical Ctr, UNITED STATES
Received:April 24, 2014
Accepted:December 20, 2014
Published:February 18, 2015
Copyright:© 2015 Mitry et al. This is an open access article distributed under the terms of the
Creative Commons Attribution License, which permits unrestricted use, distribution, and reproduction in any medium, provided the original author and source are credited.
Data Availability Statement:All relevant data are within the paper and its Supporting Information files.
mode of image presentation, expanded response options and incorporation of training modules should be examined to determine their effect on the accuracy and reliability of this technique in retinal image analysis.
Introduction
Glaucoma is a neurodegenerative disease of the optic nerve, characterized by morphologic changes in the optic disc and the retinal nerve fiber layer with corresponding loss in visual field. Signs associated with glaucomatous optic nerve damage include progressive enlargement of the optic cup, focal notches in the neuroretinal rim, optic disc hemorrhages, nerve fiber layer defects, and parapapillary atrophy.[1] In the last decade, there has been considerable interest in developing a screening tool for glaucomatous optic neuropathy using either expert graded im-aging or automated detection[2–4], however to date, no individual method can be recom-mended.[5]
Crowdsourcing, the process of outsourcing small simplified tasks to a large number of indi-viduals, is a novel and cost-effective way of classifying medical images.[6] The largest commer-cial crowdsourcing provider is Amazon’s Mechanical Turk. (https://www.mturk.com/mturk/ welcome) MTurk is an Internet-based platform that allows requesters to distribute small com-puter-based tasks to a large number of untrained workers.
Using the MTurk platform, our aim was to assess the sensitivity and specificity of crowd-sourcing as a technique to detect typical signs of glaucomatous optic neuropathy from colour fundus photographs.
Methods
Images were extracted and anonymised, with permission, from studies undertaken at the Moorfields Eye Hospital Reading Centre (MEHRC). The images have been graded normal/ab-normal by fully trained Graders at MEHRC. These were then adjudicated by the clinical lead of the Reading Centre. Those taken from diabetic retinopathy screening and deemed to have glau-comatous discs were all verified in a clinical setting by a glaucoma consultant (PJF) at Moor-fields Eye Hospital. Those with normal discs were graded by at least two senior graders; and only those images with100% agreement between the graders and adjudicated normal by the clinical lead were included in this current set.
In total 127 disc images were used. Abnormal images were designated as those with thinning or notching of the neuro-retinal rim or the presence of peri-papillary hemorrhages. Normal images were designated as an absence of any of these features. All images were anonymised and uploaded onto an ftp site for the study duration, to allow remote access.
We used the MTurk Web platform for anonymous workers to perform a classification task of the optic nerve images in our dataset. MTurk employs knowledge workers (KWs), who are untrained individuals to carry out simple tasks. KWs are registered Amazon users who have a record of completing these types of tasks. Each KW receives a small monetary reward from the requester for each task that they complete that is of a suitable standard to the requester. Ama-zon keeps a record of the performance of each KW and if desired, filters can be set by the re-quester, for example, permitting only KWs with a high success rate to perform the task. Each image classification task was published as one human intelligence task (HIT). For each HIT, KWs were given some background information and a written description of abnormal features of interest. (S1 Fig.is an example of the online questionnaire for each HIT) After reading Competing Interests:The authors have declared
through a descriptive illustration, KWs were asked if the test image had any suspicious features (thinning/notching of the neuroretinal rim or peri-papillary hemorrhage) which would warrant referral to an eye specialist. If none of the features were present, they were asked to designate the image as normal. There were no restrictions placed on the country of origin of workers. Any eligible worker could perform the task. Each image could be classified only once by each worker and there was no limit to how many images each worker could classify.
Based on previous estimations of repeated task accuracy in distributed human intelligence tasks, we requested 20 KW classifications per image.[6,7]
Analysis
In order to assess the effect of categorization skill on classification accuracy we conducted two separate study designs:
1. No previous experience required—compensation 0.05cents (USD) per HIT
2. Previously completed500 HITs with90% approval—compensation 0.05cents per HIT
Both study designs were repeated to determine if the findings from trial 1 were reproducible. Using the selection of images as a pre-defined reference standard, we calculated the sensitivity and specificity for each of the study. This was calculated based upon the pooled responses of all image classifications (N = 2,540). In addition, we used a majority judgement method to identify the percentage of images correctly classified by the majority of KWs. We calculated a KW score determined by the ratio of votes for a normal or abnormal classification to the total number of votes for each classification. Receiver operating characteristic (ROC) curves were analysed for each study design and trial. The area under the ROC curves (AUC) were calculated as non parametric Mann-Whitney estimates and comparison between curves was performed using the z statistic for correlation. All analyses were performed using STATA v12.
Results
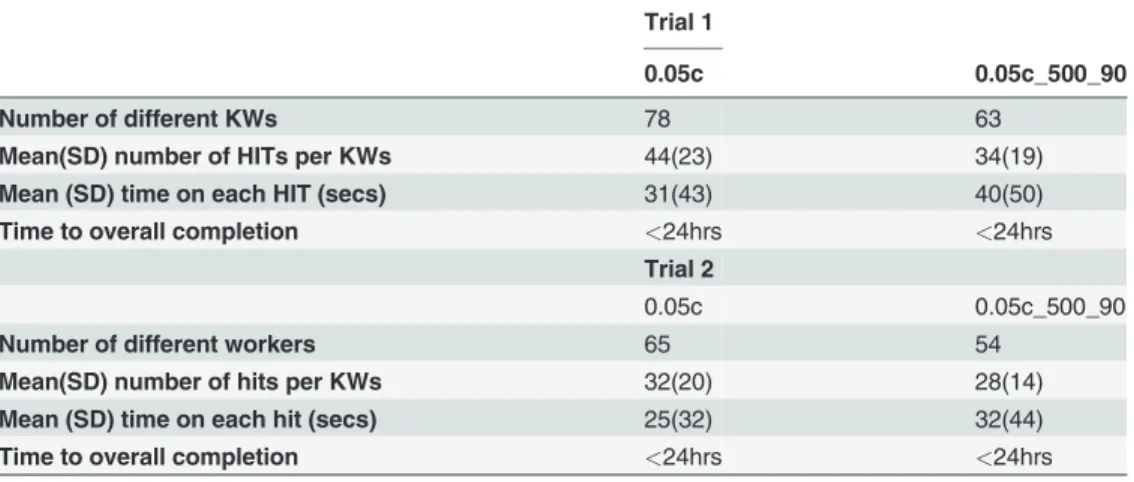
All 2,540 classifications were obtained for 127 colour disc image (20 classifications per image) in under 24 hours. 54 images were designated as abnormal by pre-determined consensus, and 73 were designated normal.Table 1highlights the baseline characteristics of the KWs for each trial. The mean time spent on each classification was under 1 minute. The time spent on each HIT did not differ significantly between correct and incorrect classification.
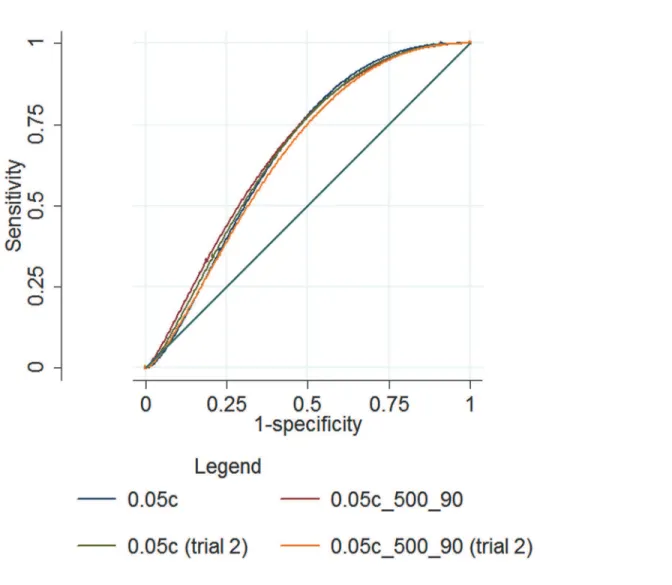
Table 2shows the sensitivity and specificity of trials one and two.Fig. 1illustrates the area under the ROC curve (AUC) for both study designs and trials. The sensitivity was between 83–
88% across both trials, however the specificity was poor, ranging between 35–43%. There were no pairwise differences in the AUC between either trial or study design.
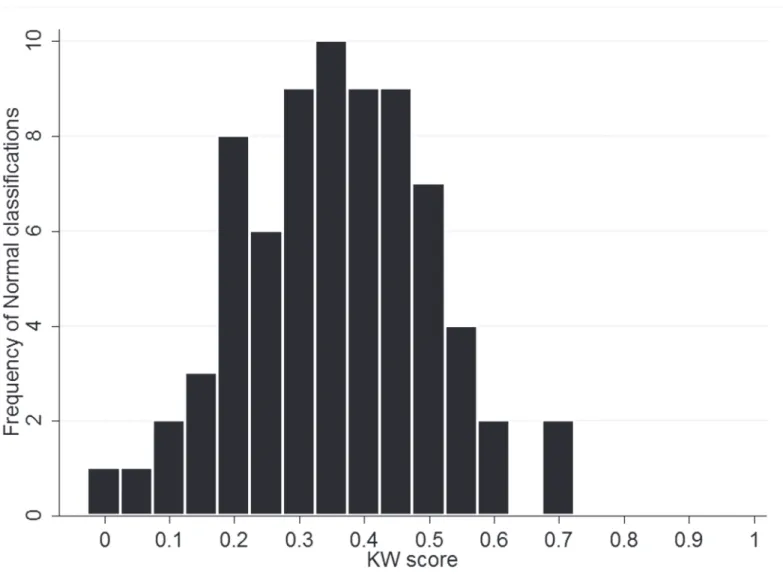
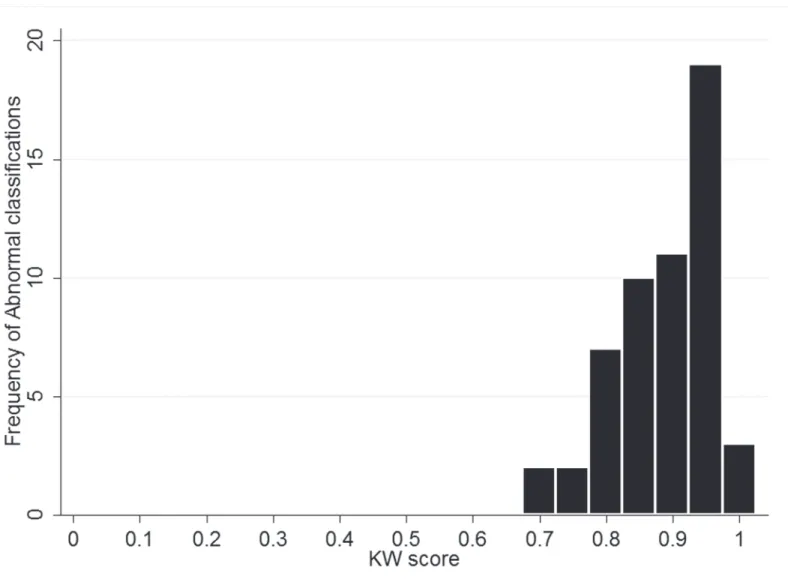
Examining the percentage correctly classified (Table 3) shows that across both trials only be-tween 8–36% of normal images were correctly assigned by the majority of KWs, whereas all ab-normal images were correctly assigned by the majority of KWs. Figs.2and3show the
classifications stratified by KW score for normal and abnormal images, demonstrating a much higher level of confidence in the true classification of abnormal.
Discussion
abnormalities suggestive of glaucomatous optic neuropathy with the gold standard of senior image graders.
Overall, the area under the ROC curve (AUC) ranged between 0.62–0.64 for all study de-signs and trials conducted. This is lower than estimates of automated glaucoma detection from fundus images (0.88)[8] and from expert graders (0.86; 0.89–0.97).[4,9] Sensitivity/specificity estimates for expert binary grading of optic disc images was has been reported to vary between 76–78%/91–92%[10] with other reports suggesting an AUC of 0.80 for binary classification of optic disc images by general ophthalmologists.[11] However, is it recognized that subjective evaluation of the optic disc is a challenging task, often with poor agreement from graders. [12,13]. Using a simple online questionnaire, KWs were shown only 4 images for training, however a repeatable sensitivity of 83–88% was achieved. The principle limitation of the crowdsource in this task was the high rate of false positives due to the incorrect classification of normal images as abnormal resulting in a low specificity.Table 3andFig. 2highlight that cor-rect classification of abnormal images is performed with a much greater level of confidence by the crowdsource, compared to correct classification of normal images. Other variables involved in crowdsourcing, such as incentive, motivation and previous experience may also play a role in task accuracy, however based on our study designs we could not demonstrate a difference between moderately experienced and inexperienced MTurks users. In addition, as has been
Table 2. The sensitivity, specificity and area under the ROC curve (AUC) for each study design in trials 1 and 2.
Sensitivity Specificity AUC (95%CI)
Trial 1 0.05c 88.80% 35.50% 0.62(0.61–0.64)
0.05c_500_90 83.98% 43.97% 0.64(0.62–0.66)
Trial 2 0.05c 86.20% 39.79% 0.63(0.61–0.65)
0.05c_500_90 86.94% 36.10% 0.62(0.6–0.63)
(0.05c = study design 1—no previous experience; 0.05c_500_90% = study design 2—moderate experience) doi:10.1371/journal.pone.0117401.t002
Table 1. Baseline characteristics of knowledge workers (KW) participation by study design for trials 1 and 2.
Trial 1
0.05c 0.05c_500_90
Number of different KWs 78 63
Mean(SD) number of HITs per KWs 44(23) 34(19)
Mean (SD) time on each HIT (secs) 31(43) 40(50)
Time to overall completion <24hrs <24hrs
Trial 2
0.05c 0.05c_500_90
Number of different workers 65 54
Mean(SD) number of hits per KWs 32(20) 28(14)
Mean (SD) time on each hit (secs) 25(32) 32(44)
Time to overall completion <24hrs <24hrs
(0.05c = study design 1—no previous experience; 0.05c_500_90% = study design 2—moderate
experience)
demonstrated previously[6,7], we also found that crowdsourcing is reliable and consistent, with minimal variation found between trials. Future studies of this technique should aim to more clearly define the range of acceptable normal features rather than focusing primarily on the detection of abnormal features and should aim to incorporate a structured training module.
This technique may find its primary utility in screening large Biobank datasets for more se-vere abnormalities, where grading time and physical infrastructure pose considerable limita-tions. Furthermore, a unique advantage of this technique may be to combine different imaging modalities to form part of a single classification, for example the crowdsource could be asked to classify a colour photograph and an OCT image of the same individual which may improve diagnostic precision. In summary, crowdsourcing is a novel tool in Ophthalmic image analysis that should be developed so that its full potential may be realised. Optimal crowdsourcing pa-rameters such as incentivized rewards systems, better visualization methods, image presenta-tion and expanded non-binary response oppresenta-tions should be further explored so that their utility in improving the accuracy and reliability of this technique can be established.
Fig 1. ROC curves for each study design in trials 1 and 2.
Table 3. The percentage of Human Intelligence Tasks (HITs) correctly classified by the majority (>50%) of key workers (KW’s), with range of percentage of correct“votes”for each image category in brackets.
Trial 1 0.05c 0.05c_500_90
Normal (N = 73) 11%(0–70) 36%(0–90)
Abnormal (N = 54) 100%(70–100) 100%(65–100)
Trial 2 0.05c 0.05c_500_90
Normal (N = 73) 23%(0–70) 8%(5–60)
Abnormal (N = 54) 100%(60–100) 100%(65–100)
(0.05c = study design 1—no previous experience; 0.05c_500_90% = study design 2—moderate
experience)
doi:10.1371/journal.pone.0117401.t003
Fig 2. Histogram of classifications by KW score (calculated as ratio of votes for Normal to total number of votes for each classification) (N = 73) (0.05c trial 1).
Supporting Information
S1 Data. Raw data for analysis derived from Amazon MTurk.
(ZIP)
S1 Fig. An example of the online human intelligence task questionnaire presented to all key workers.
(PDF)
Author Contributions
Analyzed the data: DM. Wrote the paper: DM. Provided senior supervision: TP PB SH JM KTK PJF. Provided access to data and expertise in image grading: TP PB SH JM. Involved in synthesis and design of the study: JM. Assisted in analysis and designed the study protocol: KTK PJF. Reviewed the final manuscript: DM TP SH PB JM KTK PJF.
Fig 3. Histogram of classifications by KW score (calculated as ratio of votes for Abnormal to total number of votes for each classification) (N = 54) (0.05c trial 1).
References
1. Jonas JB, Budde WM (2000) Diagnosis and pathogenesis of glaucomatous optic neuropathy: morpho-logical aspects. Prog Retin Eye Res 19: 1–40. PMID:10614679
2. Bussel II, Wollstein G, Schuman JS (2013) OCT for glaucoma diagnosis, screening and detection of glaucoma progression. Br J Ophthalmol.
3. Wollstein G, Garway-Heath DF, Fontana L, Hitchings RA (2000) Identifying early glaucomatous changes. Comparison between expert clinical assessment of optic disc photographs and confocal scanning ophthalmoscopy. Ophthalmology 107: 2272–2277. PMID:11097609
4. Badala F, Nouri-Mahdavi K, Raoof DA, Leeprechanon N, Law SK, et al. (2007) Optic disk and nerve fiber layer imaging to detect glaucoma. Am J Ophthalmol 144: 724–732. PMID:17868631
5. Mowatt G, Burr JM, Cook JA, Siddiqui MA, Ramsay C, et al. (2008) Screening tests for detecting open-angle glaucoma: systematic review and meta-analysis. Invest Ophthalmol Vis Sci 49: 5373–5385. doi: 10.1167/iovs.07-1501PMID:18614810
6. Nguyen TB, Wang S, Anugu V, Rose N, McKenna M, et al. (2012) Distributed human intelligence for co-lonic polyp classification in computer-aided detection for CT colonography. Radiology 262: 824–833.
doi:10.1148/radiol.11110938PMID:22274839
7. Mitry D, Peto T, Hayat S, Morgan JE, Khaw KT, et al. (2013) Crowdsourcing as a novel technique for retinal fundus photography classification: analysis of images in the EPIC Norfolk cohort on behalf of the UK Biobank Eye and Vision Consortium. PLoS One 8: e71154. doi:10.1371/journal.pone.0071154
PMID:23990935
8. Bock R, Meier J, Nyul LG, Hornegger J, Michelson G (2010) Glaucoma risk index: automated glaucoma detection from color fundus images. Med Image Anal 14: 471–481. doi:10.1016/j.media.2009.12.006
PMID:20117959
9. Girkin CA, McGwin G Jr, Long C, Leon-Ortega J, Graf CM, et al. (2004) Subjective and objective optic nerve assessment in African Americans and whites. Invest Ophthalmol Vis Sci 45: 2272–2278. PMID: 15223805
10. Girkin CA, Leon-Ortega JE, Xie A, McGwin G, Arthur SN, et al. (2006) Comparison of the Moorfields classification using confocal scanning laser ophthalmoscopy and subjective optic disc classification in detecting glaucoma in blacks and whites. Ophthalmology 113: 2144–2149. PMID:16996609 11. Vessani RM, Moritz R, Batis L, Zagui RB, Bernardoni S, et al. (2009) Comparison of quantitative
imag-ing devices and subjective optic nerve head assessment by general ophthalmologists to differentiate normal from glaucomatous eyes. J Glaucoma 18: 253–261. doi:10.1097/IJG.0b013e31818153da
PMID:19295383
12. Azuara-Blanco A, Katz LJ, Spaeth GL, Vernon SA, Spencer F, et al. (2003) Clinical agreement among glaucoma experts in the detection of glaucomatous changes of the optic disk using simultaneous ste-reoscopic photographs. Am J Ophthalmol 136: 949–950. PMID:14597063