The Performance between XEN-HVM, XEN-PV and
Open-VZ during live-migration
Igli Tafa, Elinda Kajo, Ariana Bejleri, Olimpjon Shurdi, Aleksandër Xhuvani Polytechnic University of Tirana,
Faculty of Information Technology, Computer Engineering Department, Tirana, Albania
Abstract— The aim of this paper is to compare the performance between three hypervisors: XEN-PV, XEN-HVM and Open-VZ. We have simulated the migration of a virtual machine by using a warning failure approach. Based on some experiments we have compared CPU Consumption, Memory Utilization, Total Migration Time and Downtime. We have also tested the
hypervisor’s performance by changing the packet’s size from
1500 byte to 64 byte. From these tests we have concluded that Open-VZ has a bigger CPU Consumption than XEN-PV, but the Total Migration time is smaller than in XEN-PV. XEN-HVM has a worse performance than XEN-PV, especially regarding to Downtime parameter.
Keywords- Hypervisor; XEN-PV; XEN-HVM; Open-VZ; CPU Consumption; Memory Utilization; Downtime.
I. INTRODUCTION
One of the most interesting technologies in the field of information technology nowadays is Virtualization. This technology gives some advantages regarding cost, source and energy consumption, tolerance to failures, isolation to different attacks etc. Anyway, in this technology there are some black holes which have to do with the performance of the applications related to communication speed, sources or their energy consumption.
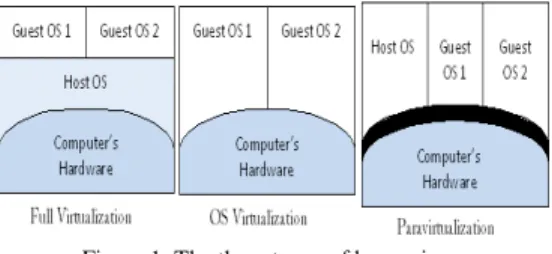
To realize a virtualization, it‟s needed to establish a
hypervisor. The hypervisor is the administrator and the manager of the sources used by the virtual machines. The hypervisor can be established above the hardware and this is called full virtualization, or it can be established above the operating system and this is called OS virtualization. The full virtualization has got the advantage to integrate physical machines with different characteristics for example Intel x86 with AMD without doing any modification in Operating
System‟s kernel. The performance offered by this type of
virtualization is not high (i.e the communication with I/O devices is slow etc).
To increase the performance, para-virtualization approach is used. This approach requires the modification of the kernel of Guest Operating Systems. It is also required that the processors have the same characteristics. In this way, the communication between applications in virtual machines and I/O devices will be realized through virtual I/O drivers which rise above the hypervisor. This will give an increase of communication speed between applications and I/O devices.
One of the most important points in the technology of virtualization is live migration. This means that if a virtual machine which is running an application undergoes a
discontinuity or it‟s CPU is loaded heavily, then the application
can be migrated from this virtual machine to another. The virtual machine migration includes the transfer of page memories that are working; the transfer of the sources that are participating in this application (i.e network card, disc etc) and
CPU‟s status. Each virtual machine has got its own CPU, its own physical memory (which is shared between different virtual machines), its own I/O etc. Memory migration is the
most crucial point of virtual machine‟s migration. There are
some methods of its migration, but the most used is the iteration method with Pre-Copy approach. In this method, at first the modified pages are transferred, which are registered from a table in memory which is managed by XEN. This table
is created with bitmap method which marks with „‟1‟‟ anytime a memory page is written. The modified pages are iterated
again until the end when CPU‟s status is transferred. In this method, the interruption time “downtime” because of the
migration is not high, it is calculated in the order of milliseconds, despite of migration capacity.
In our article we have studied three types of hypervisors
and we have measured their performance regarding the file‟s
time of transfer, CPU efficiency and memory utilization from a virtual machine to another in the same physical host or between virtual machines in different physical hosts. The tested hypervisors are Xen-PV, Xen-FV and OpenVZ,. Xen hypervisor rises above the bare hardware, whereas OpenVZ is a hypervisor which rises above the Host Operating System.
Figure 1. The three types of hypervisors
Xen Hypervisor can pass from a PV level to FV if we raise
Xen/Qemu. This will make possible the emulation of I/O
drivers in user‟s space. To achieve this is needed that the
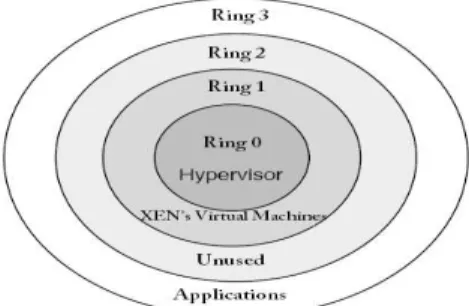
This means that a GuestOS can be a Windows XP. These processors use VTX/SVM instructions. Generally Full Virtualization decreases the communication‟s performance with I/O disks. This technique used by Xen is often called Xen-HVM. Usually HostOS is called Dom0 and GuestOS is called DomU. Unlike Xen-HVM where an application uses two system calls to access a hardware driver, Xen-PV uses special calls who will offer the possibility to access virtual drivers who are managed by Dom0 and can be connected directly with the hardware. Referring to XenPV, the hypervisor lies in ring 0, whereas GuestOS lie in ring 1. The applications are in the third
ring, the second ring is not used, like it‟s shown in Figure 2. In
Xen-HVm the ring 0 is reserved for GuestOS and the virtualized hardware lies in ring 1.
Figure 2. The rings of x86 architecture and the way they are used by XEN
OpenVZ is an OS Virtualization. GuestOS is called container or Virtual Private Server. Unlike Xen where each Guest has got its own kernel, in OpenVZ all the containers have one kernel in common with the HostOS. Anyway every GuestOS has got its own IP, its own I/O and its own memory. Since every GuestOS is a process in OpenVZ hypervisor, this method offers a better possibility than Xen in scalability but
weaker in isolation. OpenVZ can modify the Linux‟s kernel
giving to every unmodified Linux-based OS the possibility to be executed as a process in Linux.
All the above hypervisors support the SMP (Symmetric Multi-Processor) technique. This means that some GuestOS can use some host processors at the same time.
II. RELATED WORKS
In reference [15] is shown the difference between OpenVZ and XEN and is analyzed their performance. From the experiments it can be seen that OpenVZ has got a higher speed then Xen. The speed in reading is almost the same. OpenVZ has got a good performance because the hypervisor introduces a smaller complexity then XEN, expect that GuestOS in OpenVZ are treated like processes and have a common kernel with the host.
In [3] are used different measurements using different tools
like „’pktgen’’, a module that incorporates in Linux‟s kernel and serves to generate traffic (packets with different sizes) from one host to another. Another benchmark called ‘’ stress tool’’ is used to measure CPU consumption and memory
utilization. It is noticed that when packet‟s size decreases from
1500B to 64B, it is not utilized the whole bandwidth offered for all the hypervisors, anyway OpenVZ has the best performance. In [3] is tested the case when are used different streams using packets with different sizes for both hypervisors
from a virtual machine to another in a computer network connected with a gigabit switch. In all the tested cases, OpenVZ has the best performance.
In [2] is tested the performance between XEN and OpenVZ. In this system is built for the first time the multilayer approach where Web Server works in a layer, DB works in another layer and the PHP interface works in another layer. Using this multi-layer approach, the system‟s performance in scalability, isolation and speed is higher than in analogue cases [4]. The tool used to measure their performance is called
RUBIS. When the number of the applications increases, the average response time of the packets RTT in OpenVZ is four times smaller than in the first case. This occurs because XEN has a bigger overhead than OpenVZ. Based on [2] there are a lot of miss cache for instruction in L2 cache. Anyway, from [2] is seen that OpenVZ consumes more CPU because of the common kernel between the host and guests and because of the fair CPU sharing between containers. To measure the overhead here is used the tool ‘’Oprofile’’. This tool generates data anytime there is a Hardware event, i.e anytime it happens a miss cache. This tool [5] is adapted to the XEN performance
and is called „’Xenoprof’’. To measure the CPU consumption in XEN is used the tool ‘’ xentop –b’’ which gives detailed information about the CPU consumption of every GuestOS.
There isn‟t any specific tool to measure the CPU consumption of the containers in OpenVZ, anyway here the data here are measured from the generation of the time report which gives the time CPU spends in every container in /proc/vz/vstat. To measure the performance of every hypervisor is used RUBIS
benchmark which can increase the CPU load increasing the number of threads generated by a script in C. Is measured the throughput, the response time of the packets and CPU consumption. In all of these three cases is concluded again that OpenVZ has the best performance.
In [6] is shown that the creation of a multilayered disc increases the migration performance of virtual machines. Xen has lower scalability than OpenVZ, because for OpenVZ the GuestOSs are processes, although they consume a lot of memory and processing [4]. In reference [8] is compared the performance of CPU consumption for the same applications between XEN-PV, Xen-FV. It is seen that XEN-PV consumes less CPU. To measure the CPU performance here is used the tool ‘’SAR’’. XEN-PV has the highest speed of writing SAS disc.
III. BACKGROUND
In this article we want to test three parameters: CPU Consumption, Memory Utilization and the Migration time of the virtual machine due to a warning failure. To create a warning failure is used a tool of CentOS 5.5 called
„’Heartbeat’’. Using this tool we will get notified if a machine
has „‟dead‟‟ and so the Hypervisor will migrate the applications
(actually not only the applications) that were running in the
„‟dead‟‟ machine to maintain the continuity. In our article we will realize a script in C which will simulate the stop of the virtual machine in the physical host, regardless the fact that in
reality it hasn‟t stopped yet. So, the virtual machine in the first
host will finish it‟s execution only in the moment that the
where it is migrated. In this case the performance will be better
than the case when „‟Heartbeat‟‟ acts normally [9]. The case
of the study of an uncontrolled failure will be a study object in the future. However, we will examine the case when the virtual machine is relocated in the same physical host, without passing
the network. The virtual machine‟s migration passes some
steps:
a) The migration of memory pages that are in RAM who belong to the application that was being executed in the virtual machine.
b) The migration of the drivers of I/O devices.
c) The migration of virtual I/O discs as part of the activity of the virtual machine.
d) The migration of CPU-statuses.
This method is called pre-copy [10]. The purpose is that during the migration of the applications, to reduce the time of the interrupt down-time as much as possible. In pre-copy approach, the down-time is lower, but there is a problem with the total time of the migration as a result of the iteration of dirty pages, which are saved in a bitmap table in RAM. As we know all the virtual machines have the possibility to share the common memory, I/O discs, CPU etc and all these processes are managed by the hypervisor. The application that is going to be tested is a 180MB application played online (game). We will examine the parameters mentioned above using the hypervisors:
XEN-PV, Xen-FV, Open-VZ
We have used a computer and have exploited it in all the possible cases. The parameters of the computer we have used are:
Intel Core i7 920, Quad Core +, L2 4x256 KB, L3 = 8 MB, Asus, Three Channel DDR3 1600 Mhz, RAM 3x2GB, 64 bit processor, Hyperthread Technology, Freq 3.2 Ghz, VT Support, Turbo Boost Support.
We will start the experiment with XEN-PV and then with the two other hypervisors. The purpose is to find the hypervisor with the better performance during the migration of a virtual machine.
IV. THE EXPERIMENTAL PHASE
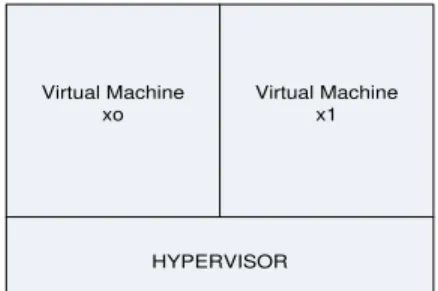
A. The simulation of warning failure in x0 virtual machine Referred to figure 3, initially we will prepare a warning failure of x0 virtual machine. It means that x0 virtual machine in reality is operating, but the hypervisor and the other virtual machine built above the hypervisor are informed from heartbeat tool which is included in CentOS 5.5, that it is stopped as we explained in section 3.To simulate a warning failure we should create a script in C programming language and we call it heartcare. This script is located in /proc and sends a message to heartbeat every time we want to execute it. At this moment heartbeat is informed for the virtual machine which should get interrupted (in our example it is x0 virtual machine), and at the same time heartbeat informs x1 virtual machine and Xen Hypervisor for this situation. Thus the hypervisor begins to migrate x0 virtual machine to x1 virtual
machine based on pre-copy approach, which is explained in section 3.
HYPERVISOR Virtual Machine
xo
Virtual Machine x1
Figure 3. Two Virtual machines that Lay above the Hypervisor
B. Xen-PV
As we explained in section 3 initially we have installed Xen as hypervisor, above it is installed Dom0 with CentOS 5.5 version and 2 virtual machines DomU (GuestOS) each has Ubuntu 10.04 Server installed. In x0 virtual machine is executed a 180 MB application.
1) CPU consumption in Xen Hypervisor before and after the migration of x0
At first we will evaluate CPU consumption of Xen Hypervisor before migrating the x0 virtual machine. The migration occurs at the moment when a warning failure signal from heartcarescript is sent to “Heartbeat” tool. To evaluate the CPU consumption in Xen first we have been located in /proc directory and typed the command xentop –b. The output results of this command are saved in a matrix form in a script called XenCProc which is located in /proc/xen. This script presents the CPU consumption for every 5 sec. At the moment when we push s key in the keyboard it will give us the average of CPU consumption up to this moment. The value is 2,23%. This is because the resources, memory consumption, virtual disks I/O, virtual network etc are not being used heavily.
After x0 virtual machine is migrated, the CPU consumption at the first moment increases slightly, then it is increased up to
9,63 %, in 1,65 sec; this is the peak of consuming, because of page faults. When the page faults increase, the CPU consumption increases too. This result depends from the iteration of dirty pages which are maintained by bitmap table in
“Grant Shared Table” located in RAM and managed by the
Hypervisor. As it looks in table 1 after 2,54 sec CPU consumption decreases to 3,11%. After 3,66 sec CPU consumption is decreased to 2,11%. This is the stabilized value. If we compare both cases before and after migration, the CPU consumption after the stabilization phase in the second case decreases up to 0,12%. The reason is the reduction of resources which were implemented to x0 virtual machine.
TAB 1.CPU CONSUMPTION IN XEN HYPERVISOR AFTER X0 VIRTUAL MACHINE IS MIGRATED TO X1.
CPU rate consumption (%) Time (sec)
2,23 % 0
9,63% 1,65
3,11% 2,54
2,11% 3,66
To evaluate the memory utilization in Xen before migration
we will use the tool named “MemAccess”located in /etc [ 11]. Initially the memory utilization is 10,6 %. After the migration of x0 virtual machine, memory utilization increases 10,7% for 1,55sec. This is the peak of memory utilization value. After that value the memory utilization will be stabilized at 10,5% at 2,04 sec ( see table 2). If we compare the memory utilization inertia with CPU consumption, it is clear that the memory has more stability because of its native nature. During the migration in memory are just added some extra code (pages migrated from x0 virtual machine). This extra code is replaced in dirty bit map table located in Grant Shared Table.
TAB 2.MEMORY UTILIZATION IN XEN HYPERVISOR AFTER X0 VIRTUAL MACHINE IS MIGRATED TO X1.
Memory Utilization Time
10,6% 0
10,7% 1,55
10,5% 2,04
As it look from table 2 the stability of memory utilization happens after 2,04 sec from the migration process. If we compare table 1 and table 2 again, the peak of memory utilization happens after 1,55 sec while the peak of CPU consumption after 1,65 sec. This is because the iteration process does not affect directly to memory but it affects CPU consumtion. Also the CPU should adapt some additional parameters during the migration such as memory management, I/O disk refresh etc.
3) Average Total Time migration of x0 virtual machine to x1.
Initially we should clarify that the migration has occured in the same physical host. At the moment when heartcare script send a message to heartbeat tool to crash x0 virtual machine, a counter is programmed to start and it is implemented into that script. This counter will evaluate the total transferring time. At the end of migration another message is sent to heartcare script. This message is sent from XenCProc script because the last of phase of pre-copy migration is dedicated to CPU status of x0 virtual machine [10].
The CPU status can be identified using XenCProc script because the CPU status is the first argument saved in stack [12]. The ID of CPU status is in the end of the transfer. At the final transfer, XenCProc sends a message to heartcare script. The total time is shown in display. The average total transferring time in our test is evaluated 2,66 sec. This is a very effective time, because the application installed is 180 MB (of course just a little size of this application is being transfered, because most of this is located in the hypervisor which is similar to a SAN device between two virtual machines, this is not part of our study).
4) Downtime during the migration of x0 virtual machine to x1 virtual machine.
This is a very critical case, because live migration phase depends from this parameter. To evaluate the downtime we will refer to XenCProc. Based on [ 10] downtime is evaluated as the transfer time of CPU status. Thus we should evaluate the total transferring time of Program Counter Register (also the same thing will be done with the execution instructions at the
moment when the warning failure occurs in x0 virtual machine) of x0 virtual machine to x1 virtual machine. PC register is encapsulated in the shared memory of the Hypervisor. So in the same manner, with total transferring time transferring we should identify the last process.
As we know when an interrupt occurs, CPU saves its status and PC counter. So we should identify the ID of the first process. This ID is recorded in XenCProc at the moment when heartbeat stops x0 virtual machine, then it passes to /proc/xentop file.
The downtime algorithm is:
a) Heartcare sends a message to XenCProc b) XenCProc saves the ID of the first process c) Then we type xentop command
d) ID process is transported to xentop file
e) CPU status iss transferred, it send automatically a sys call to the hypervisor
f) Xen look the xentop file and starts the CPU status in x1 virtual machine
g) The downtime is saved at XenCProc h) It is showed in display
The downtime is evaluated 4 ms. It is a small value. There are some reasons:
a) We are doing a migration inside a physical host b) CPU is very fast, see section 3.
c) There are some extra parameters such as Turbo BOOST
d) The application is not big (It can be considered small, only 180 MB)
e) There are no data dependency [ 13] etc.
Now we will repeat from a-d the experiments by changing the MTU (Message Transfer Unit). By changing the MTU value, the packet size will change automatically. It will affect the transferring time, downtime, memory utilization and CPU consumption too. The data packets are transferred from network virtual driver of x0 virtual machine to x1. Both virtual drivers form a team and are connected by a bridge soft which is managed by Xen. To change the packet data size we can change MTU from 1500B, which is standard of Ethernet Network Adapter, to 500 B and 64 B. For each VM we type the command:
Ifconfig eth0 mtu 500
This is a temporary value and we suppose that packet data size is 500 B. We should clarify that the results taken till now belong to the case when the packet data size is 1500 B.
MTU = 500 B
TAB 3.CPU CONSUMPTION IN XEN HYPERVISOR AFTER X0 VIRTUAL MACHINE IS MIGRATED TO X1.
CPU rate consumption (%) Time (sec)
2,26 % 0
11,47% 1,87
3,87% 2,96
TAB 4.MEMORY UTILIZATION IN XEN HYPERVISOR AFTER X0 VIRTUAL MACHINE IS MIGRATED TO X1.
Memory Utilization Time
11,3% 0
11,9% 2,30
11,2% 2,41
MTU=64 B
TAB 5.CPU CONSUMPTION IN XEN HYPERVISOR AFTER X0 VIRTUAL MACHINE IS MIGRATED TO X1.
CPU rate consumption (%) Time (sec)
9,24 % 0
21,13% 2,78
16,32% 4,50
8,03% 5,21
TAB 6.MEMORY UTILIZATION IN XEN HYPERVISOR AFTER X0 VIRTUAL MACHINE IS MIGRATED TO X1.
Memory Utilization Time
11,9% 0
12,6% 3,42
11,6% 4,05
If we compare the tables 1-6, we see that the CPU consumption increases when packet data size decreases. The same thing happens with the memory utilization. The reason is the increasing of the overhead, because small packets have more context switch and more overhead [14].
TAB.7 THE AVERAGE TOTAL MIGRATION TIME AND DOWNTIME FOR DIFFERENT MTU SIZES
Packet data size Average Total Migration time of
x0_VM
Downtime
500 B 3,37 sek 6ms
64 B 5,12 sek 9 ms
C. Xen-FV
If we want to use Xen as a Full virtual machine we should have a hardware that supports it. As we see in section 3 the parameters of our computer match with our requirements [15]. Also we should built QEMU on Xen, thus we should emulate the hardware in user space [16],[17]. The Full virtualization in Xen has the same characteristics as VMWare which means that we can build OS with different native nature and different architecture, such as Windows in DomU. Also in Full virtualization it is not necessary to modify kernel OS Host or Guest. Nevertheless Full Virtualization has some disadvantages such as the increase of access time in I/O disks, because there are 2 trap instructions to access a disk [18]. The Full virtualization includes an additive complex layer presented by QEMU emulation software. In order to emulate network drivers in both GuestOS we should install e1000 emulator in /root directory.
MTU 1500 B
TAB 8.CPU CONSUMPTION IN XEN-HVM AFTER X0 VIRTUAL MACHINE MIGRATION IN X1.
CPU rate consuming (%) Time (sec)
2,66 0
10,52 2,14
4,08 3,25
3,16 4,31
TAB 9.MEMORY UTILIZATION IN XEN-HVM AFTER X0 VIRTUAL MACHINE IS MIGRATED TO X1.
Memory Utilization Time
11,5 0
11,9 2,26
11,5 2,84
MTU = 500 B
TAB 10.CPU CONSUMPTION IN XEN-HVM AFTER X0 VIRTUAL MACHINE IS MIGRATED TO X1.
CPU rate consumption (%) Time (sec)
3,72 0
14,59 2,51
6,11 4,33
3,6 5,70
TAB 11.MEMORY UTILIZATION IN XEN-HVM AFTER X0 VIRTUAL MACHINE IS MIGRATED TO X1.
Memory Utilization Time
12,4 0
13,2 2,92
12,4 3,54
MTU=64 B
TAB 12.CPU CONSUMPTION IN XEN-HVM AFTER X0 VIRTUAL MACHINE IS MIGRATED TO X1.
CPU rate consumption (%) Time (sec)
11,8 0
24,5 3,91
19,1 6,84
11,7 8,16
TAB 13.MEMORY UTILIZATION IN XEN-HVM AFTER X0 VIRTUAL MACHINE IS MIGRATED TO X1.
Memory Utilization Time
13,02 0
13,7 5,7
12,9 6,16
If we compare the tables 8-13, the CPU consumption and memory utilization in Xen-HVM are bigger than in Xen-PV.
TAB.14 AVERAGE TOTAL MIGRATION TIME AND DOWNTIME FOR DIFFERENT
MTU SIZE
Packet data size Average Total time migration of x0_VM
Downtime
1500 B 4,10 sec 8 ms
500 B 5,24 sec 11 ms
64 B 6,08 sec 16 ms
As it look from the table 14, downtime and Average Total time are increase when the number of packet size is decrease. D. OpenVZ
1) The Evaluation of CPU consumption in OpenVZ
To evaluate the CPU consumption in OpenVZ we don‟t
It traces the active and idle processes in hypervisor by scanning the status of each process in vstat file. Each process has a wake bit in Process Status Register, if it is 1 this process is active and if it is 0 the process is idle. In Traceproc script located in /proc/vz we have implemented a formula:
The availability of the process= (Time for each active process)/(Total CPU time) x100% (1)
The sum of the availability active processes = CPU
Availability (2)
In reality this formula doesn‟t calculate the CPU
availability, because when the processes are idle they still spend CPU time, consequently their consume CPU. Thus for the idle process we should build a semaphore variable [7] in order to make them sleep. In this way they will not consume CPU. Semaphore variables are built in a script in C called
semaphore, which records the ID of all idle processes. This information is taken from Traceproc script. For each passive process we generate a thread which sends a signal to these processes.
In this manner, the passive processes are transformed in sleep processes. At the moment when CPU sends an interrupt message for one of the sleeping processes, the semaphore script is the first that takes this signal. This script reads the ID of calling processes, records it in a specific address into a specific register and then calls the specific thread. The thread wakes up the sleeping process. Thus the process can take the interrupt launched from CPU. This is a very dangerous approach because the script is implemented in user space, it means that
after the interrupt request from CPU, the generated thread can‟t
wake the process up. So the process is going to sleep forever. Nevertheless after this modification to traceproc script we will evaluate the CPU consumption by using the formula:
CPU consumption= Sum of active processes/ Total nr of process (3)
We should emphasize that this script gives us an approximately value of CPU consumption in OpenVZ hypervisor.
2) The evaluation of Memory Utilization in OpenVZ We have to use a tool named stream_tool [8] to evaluate the memory utilization. There is one problem, this tool cannot evaluate the dynamic changing i.e the iteration of dirty pages while the x0 machine migrates to x1. So we should build a script that finds the number of page faults and multiples them with the page size.
Nevertheless we cannot find the appropriate number of transferred pages in a unit of time in case a page miss occurs. So we should implement another tool called Bonnie ++, which calculates the bandwidth transfer for 2 disks. We take RAM_VM1 as first disk and RAM_VM2 as second disk and we can calculate the total number of transferred pages for each iteration by using the formula:
The nr of transferred pages= Total size transferred (B)/ Page
size (4)
The calculated from stream benchmark at 0 time:
Total memory utilization= (Time before a page fault occurs) + (Nr of transferred page while a page fault occurs) x (Nr of page faults) x (Page size) (5)
All these formulas are implemented in Mem0 script, written in C language.
3) The evaluation of transferring time and downtime To evaluate the transferring time we can use the same script we did in previous cases, but this script is located in /proc/vz.
MTU 1500 B
TAB 15.CPU CONSUMPTION IN OPENVZHYPERVISOR AFTER X0 VIRTUAL MACHINE IS MIGRATED TO X1.
CPU rate consumption (%) Time (sec)
2,24 % 0
9,67% 1,52
3,20% 2,24
2,18% 3,04
TAB 16.MEMORY UTILIZATION IN OPENVZHYPERVISOR AFTER X0 VIRTUAL MACHINE IS MIGRATED TO X1.
Memory Utilization Time
10,8% 0
10,9% 1,42
10,8% 1,57
MTU = 500 B
TAB 17.CPU CONSUMPTION IN OPENVZHYPERVISOR AFTER X0 VIRTUAL MACHINE IS MIGRATED TO X1.
CPU rate consuming (%) Time (sec)
2,28 % 0
11,48% 1,77
3,88% 2,91
2,26% 3,84
TAB 18.MEMORY UTILIZATION IN OPENVZHYPERVISOR AFTER X0 VIRTUAL MACHINE IS MIGRATED TO X1.
Memory Utilization Time
11,2% 0
11,7% 1,59
11,2% 2,22
MTU=64 B
TAB 19.CPU CONSUMPTION IN XEN HYPERVISOR AFTER X0 VIRTUAL MACHINE IS MIGRATED TO X1.
CPU rate consuming (%) Time (sec)
9,76 % 0
22,53% 2,1
17,11% 3,29
8,62% 4,27
TAB 20.MEMORY UTILIZATION IN XEN HYPERVISOR AFTER X0 VIRTUAL MACHINE IS MIGRATED TO X1.
Memory Utilization Time
11,9% 0
12,8% 3,11
11,6% 3,58
than the parameters in Xen, the reason is that all the Containers and Hosts share the same fair resources such as CPU, but the transition time in OpenVZ is smaller than that on Xen-PV, because in OpenVZ each container is considered a process.
TAB.21 AVERAGE MIGRATION TOTAL TIME AND DOWNTIME WITH DIFFERENT
MTU SIZES
Packet data size Average Total Migration time of x0_VM
Downtime
1500 B 2,06 sec 3 ms
500 B 2,57 sec 4 ms
64 B 3,72 sec 5 ms
In Tab 21 is presented the Average Total Migration time of x0_VM is smaller than that of XEN. The same thing happens with downtime. The reason is the low complexity of OpenVZ, Overhead and Context Switch; because each container is considered a process.
V. CONCLUSIONS
From the above experiments we conclude the following results:
1) CPU Consumption and Memory Utilization in XEN-PV are lower than in Open-VZ because Open-VZ uses the same kernel for Host OS and Guests OS by fair sharing the CPU. XEN has got a better sharing of the CPU between Host OS and Guests OS.
2) XEN-HVM consumes more CPU because of the emulator’s complexity (QEMU).
3) All the parameters for the three hypervisors increase with the decrease of packet’s size. This causes a slower performance.
4) The Total Migration Time and Downtime are smaller in Open-VZ than in XEN because in OPEN-VZ the overhead is smaller (every OS works as a process).
VI. FUTURE WORKS
As a future intention we would want to test and compare the performance for five hypervisors XEN-HVM, XEN-PV, Open-VZ, KVM-FV and KVM-PV in a LAN. Also we will test these hypervisors not using a warning failure, but simulating an unwarning failure.
REFERENCES
[1] Jianhua Che, Qinming He, Kejiang Ye, and Dawei Huang, “Performance Combinative Evaluation of Typical Virtual Machine Monitor”, 2010 [2] Daniel Schlosser, Michael Duelli, and Sebastian Goll,, “Performance
Comparison of Hardware Virtualization Platforms” , 2010
[3] Pradeep Padala, Xiaoyun Zhu, Zhikui Wang, Sharad Singhal, Kang G.
Shin, “Performance Evaluation of Virtualization Technologies for Server
Consolidation”, 2007
[4] Christopher Clark, Keir Fraser, Steven Hand, Jakob Gorm Hanseny,Eric
July, Christian Limpach, Ian Pratt, Andrew Warfield, “Live Migration of
Virtual Machines” , 2009
[5] A. Menon, J. R. Santos, Y. Turner, G. J. Janakiraman,and W. Zwaenepoel,
“Diagnosing performance, overheads in the Xen virtual machine environment.In Proceedings of the First ACM/USENIX
International Conference on Virtual Execution Environments(VEE), pages
13–23”, 2005
[6] Katharina Haselhorst, Matthias Schmidt, Roland Schwarzkopf, Niels
Fallenbeck, Bernd Freisleben, “Efficient Storage Synchronization for Live Migration in Cloud Infrastructures”, 2010
[7] Andrew Tanenbaum, Modern Operating System 4-th edition, chap 2, Semaphores, 2009
[8] Lucas Nussbaum, Fabienne Anhalt, Olivier Mornard, Jean-Patrick Gelas
“Linux-based virtualization for HPC clusters”, 2007
[9] Espen Braastad, “Management of high availability services using virtualization”, 2006
[10] Michael R. Hines, Umesh Deshpande, and Kartik Gopalan, “Live
migration with post copy”, 2007
[11] Jin Heo Xiaoyun, Zhu, Pradeep Padala, Ann Arbor, Zhikui Wang,
“Memory Overbooking and Dynamic Control of Xen Virtual Machines in Consolidated Environments “, 2009
[12] Andrew Tanenbaum, Modern Operating System 4-th edition, chap 2 processes, 2009
[13] John Henessy, David Peterson, Computer Organization and Design 4 –th
edition, chap 4, p. 330, “Pipeline Data Path and Control”, 2010 [14] Andrew Tanenbaum, 2009, Modern Operating System 4-th edition, chap
3, Size of Page Memory
[15] Nathan Regola, Jean-Christophe Ducom, “Recommendations for Virtualization Technologies in High Performance Computing” , 2010 [16] Chunqiang Tang, “FVD: a High-Performance Virtual Machine Image
Format for Cloud”, 2008
[17] Daniel P. Berrang´e, “Taking full advantage of QEMU in the Xen user-space”, 2007
[18] Andrew Tanenbaum, 2009, Modern Operating System 4-th edition, chap 1, Virtual Machines
AUTHORS PROFILE
Igli TAFA – Assistant Pedagogue in Polytechnic University of Tirana. PhD Student. His interesting field is Virtual and Cloud Technology.
Elinda KAJO – Pedagogue in Polytechnic University of Tirana. She is graduated in PhD at 2008. She is interesting in JAVA Technology and C Programming
Ariana BEJLERI - Pedagogue in Polytechnic University of Tirana. She is interesting in Programming Languages Technology
Olimpion SHURDI - Pedagogue in Polytechnic University of Tirana. He is very interesting in Hardware and Computer Network Technology
Aleksander XHUVANI - Professor in Polytechnic University of Tirana. He is lider of Software Laboratory in University. His interesting field is