Acta Limnologica Brasiliensia, 2011, vol. 23, no. 1, p. 74-85 doi: 10.4322/actalb.2011.021
1. Introduction
Around the world, several biological indices were created to assess water quality of streams and rivers: Saprobic system, Biotic and Diversity indices, Biomarkers, Toxicity Tests, Fluctuating Asymmetry, Multimetric Approaches, Multivariate Approaches, Functional Feeding Groups, Multiple Biological Traits, Benthic Secondary Production and Leaf-Litter Decay, among others, using different theoretical assumptions, types of information and
costs for application (Metcalfe, 1989; Rosenberg and Resh, 1993; Barbour et al., 1996; Bonada et al., 2006; Melo, 2008). Among these, a group of biotic indices was adapted from the Trent Biotic Index (TBI) (Woodiwiss, 1964) used mainly in Europe: the Indice Biotico Esteso (IBE), in Italy, adapted by Ghetti (1986, 1997), the Biotic Score, in England, adapted by Chandler in 1970, the Indice Biotique, in France, adapted by Tufferi and Davaline in 1970,
Application of the biotic index IBE-IOC for water quality
assessment in wadeable streams in south-east Brazil
Uso do índice biótico IBE-IOC para a avaliação da
qualidade da água de riachos no sudeste do Brasil
Riccardo Mugnai1,2, Daniel Forsin Buss1, Renata Bley Oliveira1, Cristiane Sanfins1, Alcimar do Lago Carvalho2 and Darcilio Fernandes Baptista1
1Laboratório de Avaliação e Promoção da Saúde Ambiental, Departamento de Biologia, Fundação Oswaldo Cruz – Fiocruz,, Av. Brasil, 4365, Manguinhos, CEP 21045-900, Rio de Janeiro, RJ, Brazil
e-mail: mugnai.riccardo@gmail.com; dbuss@ioc.fiocruz.br; reoliveirabio@gmail.com; csanfins@gmail.com; darcilio@ioc.fiocruz.br
2Museu Nacional, Universidade Federal do Rio de Janeiro – UFRJ, Quinta da Boa Vista, São Cristóvão, CEP 20940-040, Rio de Janeiro, RJ, Brazil
e-mail: alagoc@acd.ufrj.br
Abstract: Aim: This work presents the results of the first water quality assessment using the biotic index Índice Biótico Estendido – Instituto Oswaldo Cruz (IBE-IOC) for 1st to 4th order streams in the Serra dos Órgãos region, Rio de Janeiro State, Brazil. The aims were to evaluate the sensitivity of IBE-IOC, verifying its ability to assess anthropogenic impacts over the stream gradient and along the year; Methods: The sensitivity of the index was evaluated according to the degree of interquartile overlap in Box-and-Whisker plots; Results: The index is able to distinguish different types of environmental integrity and different impacts by deforestation and organic pollution; Conclusions: Our results supported the recommendation of IBE-IOC as a useful tool for water quality assessment of wadeable streams in this region.
Keywords: bioindicators, macroinvertebrates, River Guandu, Atlantic Forest, Rio de Janeiro.
Resumo: Objetivo: Este trabalho apresenta o resultado do primeiro biomonitoramento de qualidade da água realizado através do uso do Índice Biótico Estendido – Instituto Oswaldo Cruz (IBE-IOC), adaptado para riachos de 1ª a 4ª ordem da região da Serra dos Órgãos, Estado do Rio de Janeiro, Brasil. O objetivo principal foi avaliar a sensibilidade do IBE-IOC verificando a capacidade de detecção de impactos de origem antropogênica ao longo do gradiente do rio e nas diferentes épocas do ano; Métodos: A sensibilidade do índice foi avaliada de acordo com o grau de sobreposição do interquartil nos Box-and-Whisker plots; Resultados: O índice tem capacidade de distinguir diferentes tipologias de integridade ambiental e diferentes tipos de impactos devidos ao desmatamento e poluição orgânica; Conclusões: Os resultados suportam a recomendação do IBE-IOC como ferramenta útil para o monitoramento de riachos nesta região.
Palavras-chave: bioindicadores, macroinvertebrados, Rio Guandu, Floresta Atlântica, Rio de Janeiro.
Chemical L
imnolog
Helicopsychidae, Hydroptilidae, Hydropsychidae and Leptoceridae presented tolerant genera in the regular and poor classes.
Today in many countries more complex multimetric indexes are used and in the Rio de Janeiro State (Brazil) a Multimetrix Index for Serra dos Órgãos Mountains (SOMI) (Baptista et al., 2007) was proposed, but its complex calculation system difficults extensive application in a development country. An adaptation of IBE´s methodology could represent a rapid and cost-effective assessment instrument and simple tools for use as routine monitoring, and could be employed routinely in large monitoring plans, while a quantitative approach to community-level analysis could be used only in cases of particular interest or like a metric in multimetric indexes (Fenoglio et al., 2002, Vlek et al., 2004, Skoulikidis et al., 2004, Baptista et al., 2007).
In general, a biotic index is applicable only in the geographical area where it was developed (Ravera, 2001), and in order to assure the appropriate sensitivity to detect small variations in the composition and structure in the aquatic community in other areas, the indices need to be tested and/or adapted.
Testing of IBE-based indices was performed in Central and South Americas (e.g., in Nicaragua) (Fenoglio et al., 2002), and IB-PAMP for Pampean rivers in Argentina – (Rodríguez Capítulo et al., 2001). According to Alba-Tercedor (1996) and Ghetti (1986), prior to the use in routine monitoring programs, biological indices must be assessed for: i) the existence of natural variation in the assemblage structure related to altitude, stream size, geological characteristics, among others; ii) the existence of temporal instabilities in assemblage organization. The incorrect interpretation of those variations can bias the application of Biotic Indices in water quality assessment programs. Therefore, the aims of this study were to evaluate the sensitivity of IBE-IOC developed by Mugnai et al. (2008), verifying its ability to assess anthropogenic impacts over spatial and temporal gradients of tributaries of the Guandu River in Rio de Janeiro State.
2. Study Area
In order to test the IBE-IOC index two study areas were selected in the Guandu River basin, a different basin from those where the index was adapted. The first area was located in the urban area of Paracambi (22° 35’ 22” S and 43° 40’ 43” W), and the second in the Biological Permanent Preservation Extending Biotic Index, in England, adapted by
Woodiwiss in 1978, the Belgian Biotic Index, adapted by DePauw and Vanhooren in 1983 (Ghetti, 1986).
Biotic indices derived from the TBI are based on two general assumptions: i) that more stable assemblages have high diversity values, while unstable ones present low diversity; ii) stability, and therefore diversity, may be used as an indication of environmental integrity (Ravera, 2001). The evaluation of the biological quality of water bodies is based on specific sensibilities of some taxa used as references, ordered according to its tolerance to stress factors, and richness value in Systematical Units (SU).
According to the application procedure, the calculation of the biological quality value of a water body is accomplished through the use of a table with two entrances: a vertical – corresponding to the value of the Richness found; and a horizontal – corresponding to the less tolerant SU to stress factors. The biological quality value can be transformed into quality class through the conversion table. Systematical units registered with only one or two specimens were excluded, avoiding a possible increment of the richness due to drift phenomenon (Ghetti and Bonazzi, 1981; Ghetti, 1986; Mugnai et al., 2008).
76 Mugnai, R. et al. Acta Limnologica Brasiliensia
according to the RCE index. Sites with intermediate conditions were also sampled in order to test the ability of the index to distinguish these sites from the other two environmental conditions.
According to these criteria, the following sites were chosen: Reference sites (S1 and S2) located in the Permanent Preservation Area of the Biological Reserve of Tinguá, and Impaired sites (S7, S8, S9, S10, S11, S12, S13 and S14) located in the urban area of Paracambi city. Intermediate impaired sites were separated in order to represent two conditions: sites with low impairment (sites S3 and S4), located close to the limit of the Biological Reserve, but not considered as ‘reference’ sites; and sites subjected to high deforestation and dominated by pastures (S5 and S6) (Figure 1).
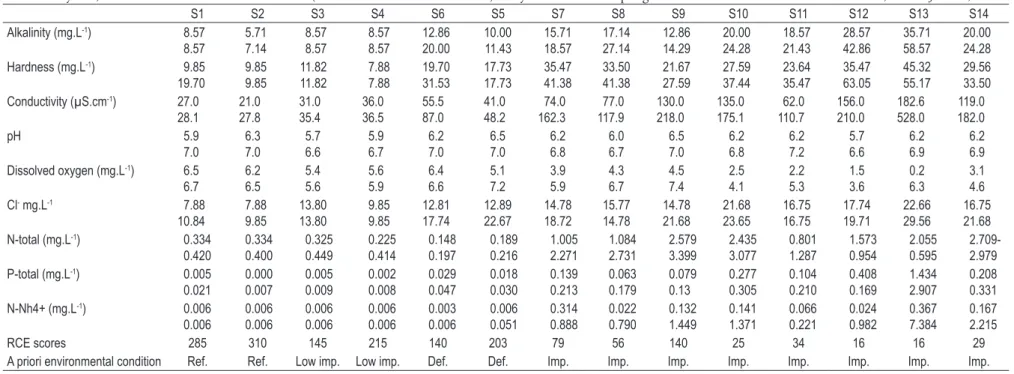
In order to assess the water and environmental qualities of sites, the following physical and chemical variables were measured: Hardness, Conductivity, Alkalinity, pH, Dissolved Oxygen, Cl-, N-Total, P-Total, N-NH4+, according to the standard methods defined by the former environmental agency of the Rio de Janeiro State (FEEMA, 1982). We also calculated for each site the scores of the RCE index, a visual index which valued the physical conservation of bed and river channel (Table 1).
At each sampling site, six macroinvertebrate samples were taken using a Kick Net sampler (500 µm mesh size, 30 × 30 cm frame) from two meso-habitats. Three samples in riffle areas, with big and medium size stones and leafs, and three in pool areas with silt, sand, gravel and leaf litter. Each sample was performed in an area of approximately l m2 and samples were pooled in order to represent one composite sample per site. All samples were preserved in the field with ethanol at 80%.
In the laboratory, macroinvertebrates were sorted and identified using a stereoscopic microscope to the taxonomic level required by the IBE-IOC index. The identification was accomplished with the available taxonomic keys: Merritt and Cummins (1996), Nieser and Melo (1997); Carvalho and Calil (2000); Angrisano and Korob (2001); Olifiers et al. (2004); Salles et al. (2004a, b). Rare taxa, represented by one or two specimens, were excluded from all analyses in order to avoid accidental sampling caused by drift, as recommended by Ghetti (1986).
3.2. Application of the IBE-IOC index
Biological quality values and class was calculated for each sampling site and for all three periods of year. According to the application procedure (Mugnai et al. 2008) the calculation of the biological Area of Tinguá (22° 32’ to 22° 38’ S and 43° 31’ to
43° 31’ W).
The urban area of Paracambi has around 40,000 inhabitants (IBGE, 2000), virtually no sewage treatment, and almost all the untreated sewage from the region are discharged in the Macacos Stream. One of its tributaries, André Martins River, receives textile industry waste. All of the rivers sections chosen in this area present, in general, an accentuated deforestation and in some section there is total loss of the original rocky substratum caused by sediment accumulation, with relatively homogeneous bed and prevailing deposition areas, with unstable margins and without retention devices.
The Biological Preservation Area of Tinguá (REBIO - IBAMA) is situated approximately at 70 km of Rio de Janeiro city. The REBIO possesses an area of 26,000 ha. The rivers investigated, Santo Antônio and Douro, are partially located in the REBIO. Their sections located inside the Preservation Area present beds formed by stones, gravels and sand, margins well preserved and consolidated with stable banks and characterized by the existence of distinct meso-habitats of riffles and pools. The sections of those two rivers located outside the REBIO suffer impacts by deforestation and organic pollution.
The precipitation pattern in the area is characterized by the presence of only two seasons: a rainy season from November to February (more than 250 mm.month-1), and a dry season from June to September (less than 100 mm.month-1). The annual mean is more than 1,500 mm. The annual medium temperature is between 20 and 25 °C.
3. Material and Methods
3.1. Field and laboratory procedures
To calculate the mean of intermediate values of biological quality it was used the conversion table present in Appendix 4 as 9/8 = 8.6 and 8/9 = 8.4; to transform the mean in value of biological quality we proceed in a contrary way. In case of fraction of 0.5 it is attributed to the smaller class for instance 8.5 = 8/9. For fractions from 8.0 to 8.3 correspond the value 8 and from 8.7 to 9.0 correspond the value 9 (Spiaggiari and Franceschini, 2000). 3.3. Data analysis
The ability of the index to differentiate the different levels of impairment was judged based on the unpaired t test and the degree of interquartile overlap in Box-and-Whisker plots. According to Barbour et al. (1996) the Box-and-Whisker plots allow the visualization of the index value variation between reference, intermediate impacted and impaired sites of the IBE-IOC values.
To estimate possible existence of seasonal variation of quality class and index values, US richness and the most sensitive US found for each sites in each sampling periods was valued. To allow the comparison between our results and the ones of other IBE indices performed in Central and South Americas (Fenoglio et al, 2002; Rodríguez Capítulo et al., 2001) the Spearman correlation quality value of a water body is accomplished
in three steps. Step 1 - Calculation of Richness corresponding to the sum of SU found (Systematic Unit, at family or genus level; Appendix 1). Step 2 - Calculation of biological quality class through the use of a table with two entrances (Appendix 2): a vertical - corresponding to the value of the SU Richness and a horizontal - corresponding to the less tolerant SU to the stress factor present. Step 3 - Determination of quality class using the conversion table (Appendix 3).
In this work, like recommended by Ghetti (1986), the SU registered with only one or two specimens were included in the data analysis only after compared data of all season, avoiding a possible increment of the Richness due to drift phenomenon. That is especially important when the variation due this SU can result in variation of quality class.
The calculation of IBE-IOC annual mean biological values and annual mean classes can allow to realize maps in small scale and/or to accompany index that use among the descriptors the annual mean of physiochemical variable. To calculate the mean values of biological quality it was employed a modified version of the table found in the Italian Legislative Decree No. 152/99 and described in Spiaggiari and Franceschini (2000) (Appendix 4).
Figure 1. Location of sampling sites: S1 and S2 Reference, S3 and S4 Low impaired, S5 and S6 Deforested, S7, S8, S9, S10, S11, S12, S13 and S14 Impaired. Above the arrow indicate the study area in the Rio de Janeiro State. Below the checkered gray area indicate the Permanent Preservation Area of the Biological Reserve of Tinguá, Rio de Janeiro State, Brazil.
mountainous region São Pedro
São Pedro River
12 13
14 10 11
1 3
2 4 5
6
7 8 9
Rio de Janeiro
0
0
100 km
10 km
Eng. Paulo de Frontin
22° 30’ 44° 30’
Paracambi
Macacos River
São Pedro River
mountainous region São Pedro
Sto. Antônio N
S
78
M
ugnai, R. et al.
A
cta L
imnologica B
rasiliensia
Table 1. Physical, chemical and environmental variables (minimum and maximum values) analyzed at the 14 sampling sites in the tributaries of the Guandu River, Rio de Janeiro, Brazil.
S1 S2 S3 S4 S6 S5 S7 S8 S9 S10 S11 S12 S13 S14
Alkalinity (mg.L-1) 8.57
8.57 5.71 7.14 8.57 8.57 8.57 8.57 12.86 20.00 10.00 11.43 15.71 18.57 17.14 27.14 12.86 14.29 20.00 24.28 18.57 21.43 28.57 42.86 35.71 58.57 20.00 24.28 Hardness (mg.L-1) 9.85
19.70 9.85 9.85 11.82 11.82 7.88 7.88 19.70 31.53 17.73 17.73 35.47 41.38 33.50 41.38 21.67 27.59 27.59 37.44 23.64 35.47 35.47 63.05 45.32 55.17 29.56 33.50 Conductivity (µS.cm-1) 27.0
28.1 21.0 27.8 31.0 35.4 36.0 36.5 55.5 87.0 41.0 48.2 74.0 162.3 77.0 117.9 130.0 218.0 135.0 175.1 62.0 110.7 156.0 210.0 182.6 528.0 119.0 182.0 pH 5.9 7.0 6.3 7.0 5.7 6.6 5.9 6.7 6.2 7.0 6.5 7.0 6.2 6.8 6.0 6.7 6.5 7.0 6.2 6.8 6.2 7.2 5.7 6.6 6.2 6.9 6.2 6.9 Dissolved oxygen (mg.L-1) 6.5
6.7 6.2 6.5 5.4 5.6 5.6 5.9 6.4 6.6 5.1 7.2 3.9 5.9 4.3 6.7 4.5 7.4 2.5 4.1 2.2 5.3 1.5 3.6 0.2 6.3 3.1 4.6
Cl- mg.L-1 7.88
10.84 7.88 9.85 13.80 13.80 9.85 9.85 12.81 17.74 12.89 22.67 14.78 18.72 15.77 14.78 14.78 21.68 21.68 23.65 16.75 16.75 17.74 19.71 22.66 29.56 16.75 21.68
N-total (mg.L-1) 0.334
0.420 0.334 0.400 0.325 0.449 0.225 0.414 0.148 0.197 0.189 0.216 1.005 2.271 1.084 2.731 2.579 3.399 2.435 3.077 0.801 1.287 1.573 0.954 2.055 0.595 2.709-2.979
P-total (mg.L-1) 0.005
0.021 0.000 0.007 0.005 0.009 0.002 0.008 0.029 0.047 0.018 0.030 0.139 0.213 0.063 0.179 0.079 0.13 0.277 0.305 0.104 0.210 0.408 0.169 1.434 2.907 0.208 0.331
N-Nh4+ (mg.L-1) 0.006
0.006 0.006 0.006 0.006 0.006 0.006 0.006 0.003 0.006 0.006 0.051 0.314 0.888 0.022 0.790 0.132 1.449 0.141 1.371 0.066 0.221 0.024 0.982 0.367 7.384 0.167 2.215
RCE scores 285 310 145 215 140 203 79 56 140 25 34 16 16 29
A priori environmental condition Ref. Ref. Low imp. Low imp. Def. Def. Imp. Imp. Imp. Imp. Imp. Imp. Imp. Imp.
The results of the IBE-IOC index application are present in Table 2. In this table the stress sensibility of the most sensitive US found in each sampling site decrease with the US Richness. The evaluation of the biological quality value, quality class and SU richness in each sampling site in all sampling periods, with the exception of S2, show low fluctuations, without evidences of a seasonal pattern.
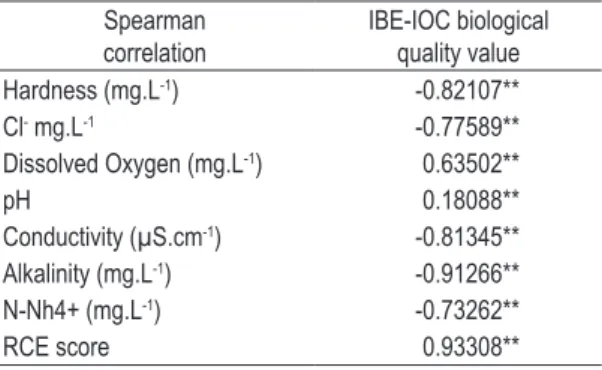
The results of the Spearman Correlation Analysis between IBE-IOC biological quality values and physical and chemical parameters and RCE score are present in Table 3.
5. Discussion
In Central and South America some biotic indices for stream quality assessments were tested, like BMWP, BMWP-ASPT, EPT and Family Biotic Index (Thorne and Williams, 1997; Silveira et al., 2005; Junqueira et al., 2010). The results of such studies showed the theoretical applicability of those indexes in the Neotropical Region but adaptations to suit the local fauna are necessary to greatly enhance their performance (Thorne and Williams, 1997; Fenoglio et al., 2002; Mugnai et al., 2008).
In recent years there has been an upsurge in interest in rapid assessment techniques for the biological monitoring of water quality, emphasizing a low cost approach, achieved by reduced sampling and efficient data analysis (Resh et al., 1995; Thorne and Williams, 1997; Nichols and Norris, 2006; between the index values and the physical and
chemical parameters was applied.
4. Results
The application of the IBE-IOC for each site (Table 2) revealed that the index was able to distinguish the four different levels of environmental integrity (reference, low impaired, deforested and impaired sites). The t test indicates that the values of biological quality between sites with different levels of environmental integrity are statistically different (p < 0.05). According to Barbour et al. (1996), the ability of the index to differentiate the different levels of impairment is judged based on the degree of interquartile overlap in Box-and-Whisker plots (Figure 2). An index show a decreasing sensitivity when: 1) no overlap existed in interquartile range; 2) there was some overlap in interquartile range but both medians were outside the interquartile range overlap; 3) there was moderate overlap of interquartile range but one median was outside the interquartile range overlap; 4) one range was completely overlapping the other interquartile range but one median was outside the interquartile range overlap; 5) both medians were inside interquartile range overlap.
In general calculations of the index indicated class I to the reference sites. Class II to the intermediately impaired sites and classes III-V to impaired sites located in urban area. For the intermediate impaired and impaired sites was evidenced the decrease of the water quality along the longitudinal gradient over the stream and their tributaries according to the physical, chemical and RCE variables measured (Table 1). As consequence of the waste products dejected from Engenheiro Paulo de Frontin, a city located upstream Paracambi, the waters of Macacos River inflowing in the municipal area presented quality class IV (S7). After crossing the whole extension of the urban and peri-urban area, the water quality falls to class V (S14) before the Guandú River.
The decrease of water quality along the longitudinal gradient was also detected in the tributaries of Macacos River: the André Martins River close to the spring (S5) was classified in class III and downstream after suffering the impact of the textile industry (S9) was classified in class IV; the Sabugo River in the upstream site (S6) was classified in class IV, as a consequence of deforestation and low organic pollution, and downstream (S11) with the increase of the deforestation and the elevation of the organic waste was classified in class V.
Figure 2. Box-and-whisker plots with the values of IBE-IOC calculated for streams of the four levels of environmental integrity: Ref (reference) 6 samples, Low (low impaired) 6 samples, Def (deforested) 6 samples and Imp (impaired) 24 samples.
15 14 13 12 11 10 9 8 7 6 5 4 3 2 1 0
IBE-IOC values
Ref Low Def Imp
Non-outlier max Non-outlier min
75% 25%
80
M
ugnai, R. et al.
A
cta L
imnologica B
rasiliensia
Table 2. Results of the application of the IBE-IOC index for each site of the Serra do Mar Mountains, State of Rio de Janeiro, Brazil, sampled in June 2004, November 2004 and March 2005, in streams.
Sites Sampling periods Annual
mean value (class)
June 2004 November 2004 March 2005
SU richness
Most sensitive taxa
Value (class)
SU richness
Most sensitive taxa
Value (class)
SU richness
Most sensitive taxa
Value (class)
S1 37 Gripopteryx / Kempnyia 12
(I)
39 Gripopteryx / Tupiperla 12
(I)
36 Gripopteryx/ Kempnyia 12/11 (I) 11/12 (I)
S2 35 Gripopteyx 10/11 (I) 40 Gripopteyx / Kempnya 12/13 (I) 26 Paragripopteyx / Caenis 9/8
(II)
10/11 (I)
S3 28 Paragripopteyx / Caenis 9
(II)
33 Paragripopteyx 10
(I)
29 Anacroneuria / Farrodes 8
(II)
9 (II)
S4 28 Thraulodes / Caenis 9
(II)
32 Gripopteryx 10
(I)
22 Kempnyia 8
(II)
9 (II)
S5 20 Massartella 6/7
(III)
16 Farrodes 5/4
(IV)
24 Farrodes 6
(III)
6 (III)
S6 16 Hydrobiosidae / Farrodes 5/4
(IV)
18 Baetidae / Leptohyphes 4 (IV)
19 Farrodes 5
(IV)
4/5 (IV)
S7 14 Baetidae / Hydropsychidae 3
(IV)
11 Hydropsychidae 3
(IV)
13 Baetidae / Hydropsychidae 3 (IV)
3 (IV)
S8 20 Baetidae / Hydropsichidae 4
(IV)
16 Baetidae / Hydropsychidae 4/3 (IV)
19 Baetidae / Hydropsychidae 4 (IV)
4 (IV) S9 20 Hydroptilidae / Hydropsychidae 4/5
(IV)
16 Hydropsychidae 3/4
(IV)
20 Farrodes 5/6 (IV) 4
(IV)
S10 12 Chironomidae 1/2
(V)
7 Baetidae 3
(V)
7 Baetidae 3
(IV)
2/3 (V)
S11 16 Chironomidae 2/3
(V)
5 Oligochaeta 1
(V)
6 Oligochaeta 1
(V)
1/2 (V)
S12 8 Chironomidae 1
(V)
2 Other 0
(V)
5 Oligochaeta 1
(V)
1 (V)
S13 9 Chironomidae 1
(V)
10 Other 0
(V)
7 Chironomidae 1
(V)
1 (V)
S14 10 Chironomidae 1
(V)
9 Baetidae / Hydroptilidae 3 (V)
10 Oligochaeta 1/2
(V)
The evaluation of IBE-IOC biological quality values, quality class and SU richness in each sampling site in all sampling periods did not evidence a seasonal pattern. This result corroborates other studies performed in the Atlantic Rain Forest biome (Baptista et al., 2001, 2007; Silveira, 2001; Buss et al., 2002; Egler, 2002; Buss et al., 2004) that showed seasonality in the community’s structure and in the abundance of taxa, without generating significant changes in the composition.
In our study the seasonal fluctuations of the IBE-IOC biological quality values presented low intensity, with exception of Site 2, probably due of nature of sampling site with big stones and strong flow that difficult sampling activity. In function of that only in few cases such fluctuations reflected in variations in the quality class. That characteristic enable the application of index in that area throws the whole year without seasonal correction like necessary in other country (Helms et al., 2009; Rossaro and Petrangelo, 2004; Zamora-Munõz et al., 1995).
In conclusion, the ability to discriminate different degrees of impact, the seasonal stability and the good correlation between IBE-IOC values and physical and chemical parameters support the recommendation of IBE-IOC as a useful tool for the water quality assessment of 1st to 4th order rivers located in the Serra dos Órgãos, State of Rio de Janeiro, Brazil.
References
ALBA-TERCEDOR, J. 1996. Macroinvertebrados acuaticos y calidad de las aguas de los rios. IV Simposio del agua em Andalucia (SIAGA). Almeira, no. 2, p. 203-213.
ANGRISANO, EB. and KOROB, PG. 2001. Trichoptera. In FERNANDEZ, HR. and DOMINGUEZ, E., eds.
Guia para la determinación de los artrópodos bentônicos
sudamericanos. p. 55-92. (Serie Investigaciones de
la UNT. Subserie: Ciências Exatas y Naturales, Tucumán).
BAPTISTA, DF., BUSS, DF., DORVILLÉ, LFM. and NESSIMIAN, JL. 2001. Spatial and temporal organization of aquatic insect assemblages in the longitudinal gradient of a tropical river. Revista
Brasileira de Biologia, vol. 61, no. 2, p. 295-304. http://
dx.doi.org/10.1590/S0034-71082001000200012 BAPTISTA, DF., BUSS, DF., EGLER, M.,
GIOVANELLI, A., SILVEIRA, MP. and NESSIMIAN, JL. 2007. A multimetric index based on benthic macroinvertebrates for evaluation of Atlantic Forest streams at Rio de Janeiro State, Brazil.
Hydrobiologia, vol. 575, p. 83-94.
Petkovska and Urbanic, 2009; Oliveira et al., 2011). Fenoglio et al. (2002) showed that the indexes derived from IBE are well correlated with other indexes, with the additional advantage of a quick application, not requiring quantitative sampling or a deep knowledge of the ecological characteristics of all taxa (required in the case of the FBI).
Index like Score systems are largely influenced by the number of taxa in the sample, affected by sample size, sampling effort and sample processing efficiency (Hawkes, 1997; Petkovska and Urbanic, 2009). Diversity indexes although had often been questioned, especially in case of low impact (Pinder and Farr, 1987; Melo, 2008). Therefore, the importance of using indexes derived from TBI, that are based in number of SU and the specific sensibility of some taxa, is because they are less sensitive to diversity variation.
The data collect from June 2004 to March 2005 demonstrated that the IBE-IOC, adapted for 1st to 4th order streams in the Serra dos Órgãos Mountains, State of Rio de Janeiro, Brazil (Mugnai et al., 2008), is able to distinguish different types of environmental integrity and can be used like metric in a multimetric index. The results of the correlation analysis, showed that the index present a good correlation with RCE index, Total Hardness, Chlorides, Total Alkalinity, Conductivity and Dissolved Oxygen, and a poor correlation with pH. Rodrigues Capítulo et al. (2001) and Buss et al. (2002) found similar results in their studys in Argentina and Brazil. The high correlation with RCE index values in our work was expected in relation to the adaptation process of the IBE-IOC using the RCE index as main parameter.
Table 3. Results of the of the Spearman Correlation Analysis comparing the IBE-IOC biological quality values with values of physical and chemical parameters and of RCE for each site of the Serra do Mar Mountains, State of Rio de Janeiro, Brazil, sampled in June 2004, November 2004 and March 2005, in streams.
Spearman correlation
IBE-IOC biological quality value Hardness (mg.L-1) -0.82107**
Cl- mg.L-1 -0.77589**
Dissolved Oxygen (mg.L-1) 0.63502**
pH 0.18088**
Conductivity (µS.cm-1) -0.81345**
Alkalinity (mg.L-1) -0.91266**
N-Nh4+ (mg.L-1) -0.73262**
RCE score 0.93308**
82 Mugnai, R. et al. Acta Limnologica Brasiliensia
GHETTI, PF. 1997. Manuale di applicazione Indice
Biotico Esteso (I.B.E.). Trento: Provincia Autonoma
di Trento. 222 p.
GHET TI, PF. and BONAZZI, G. 1981. I macroinvertebrati nella sorveglianza ecologica dei corsi
d´acqua. Roma: Consiglio Nazionale delle Ricerche
CNR. 165 p. Collana del Progetto Finalizzato
“Promozione della qualitá dell´ambiente”. Manuale
di applicazione.
HAWKES, HA. 1997. Origin and development of the biological Monitoring Working Party score system.
Water Research, vol. 32, no. 3, p. 964-968.
HELMS, BS., SCHOONOVER, JE. and FEMINELLA, JW. 2009. Seasonal variability of land use impacts on macroinvertebrate assemblages in streams of western Georgia, USA. Journal of the North American
Benthological Society, vol. 28, n. 4, p. 991-1006.
http://dx.doi.org/10.1899/08-162.1
Instituto Brasileiro de Geografia Estatística - IBGE. 2000.
500 anos de povoamento. Rio de Janeiro: IBGE. 222
p. Apêndices de estatística.
JUNQUEIRA, MV., FRIEDRICH, G. and PEREIRA DE ARAUJO, PR. 2010. A saprobic index for biological assessment of river water quality in Brazil (Minas Gerais and Rio de Janeiro states).
Environmental Monitoring and Assessment, vol. 163,
p. 545–554. http://dx.doi.org/10.1007/s10661-009-0857-1
MELO, AS. 2008. O que ganhamos ‘confundindo’ riqueza de espécie e equabilidade em um índice de diversidade?. Biota Neotropica, vol. 8, n. 3.
MERRIT, W. and CUMMINS, KW. 1996. An
introduction to the aquatic insects of North America.
3th ed. Dubuque, Iowa: Kendal/Hunt Editor. 361p. METCALFE, JL. 1989. Biological water quality assessment of running waters based on macroinvertebrates communities: history and present status in Europe.
Environmental Pollution, vol. 60, p. 101-139. http://
dx.doi.org/10.1016/0269-7491(89)90223-6 MUGNAI, R., OLIVEIRA, RB., CARVALHO, AL.
and BAPTISTA, DF. 2008. Adaptation of the Indice Biotico Esteso (IBE) for water quality assessment in rivers of Serra do Mar, Rio de Janeiro State, Brazil.
Tropical Zoology, vol. 21, p. 57-74.
NICHOLS, SJ. and NORRIS, RH. 2006. River condition assessment may depend on the subsampling method: Field live-sort versus laboratory sub-sampling of invertebrates for bioassessment. Hydrobiologia, vol. 572, p. 95-213.
NIESER, N. and MELO, AL. 1997. Os heterópteros
aquáticos de Minas Gerais. Belo Horizonte: Editora
UFMG. 180p. Guia introdutório com chave de identificação para as espécies de Gerromorpha e Nepomorpha.
OLIFIERS, MH., DORVILLÉ, LFM., NESSIMIAN, JL. and HAMADA, N. 2004. A key to Brazilian BARBOUR, MT., GERRITSEN, J., GRIFFITH, GE.,
FRYDENBORG, R., MCCARRON, E., WHITE, JS. and BASTIAN, ML. 1996. A framework for biological criteria for Florida streams using macroinvertebrates. Journal of the North American
Benthological Society, vol. 15, no. 2, p. 185-211.
http://dx.doi.org/10.2307/1467948
BONADA, N., PRAT, N., RESH, VH. and STATZNER, B. 2006. Developments in aquatic insect biomonitoring: a comparative analysis of recent approaches. Annual Review of Entomology, vol. 51, p. 495-523. http://dx.doi.org/10.1146/annurev. ento.51.110104.151124
BUSS, DF., BAPTISTA, DF., SILVEIRA, MP. and NESSIMIAN, JL. 2002. Influence of water chemistry and environmental degradation on macroinvertebrate assemblage in a river basin in Southeast Brazil.
Hydrobiologia, vol. 481, p. 125-136.
BUSS, DF., BAPTISTA, DF. and SILVEIRA, M. 2004. Substrate specificity, environmental degradatíon and disturbance structuring macroinvertebrate assemblages in Neotropical streams. Hydrobiologia, vol. 518, p. 178-188.
CARVALHO, AL. and CALIL, ER. 2000. Chaves de identificação para as famílias de Odonata (Insecta) ocorrentes no Brasil, adultos e larvas. Papéis Avulsos
de Zoologia, vol. 41, no. 15, p. 223-241.
CHANDLER, JR. 1970. A biological approach to water quality management. Water Pollution Control, vol. 69, p. 415-422.
De PAUW, N. and VANHOOREN, G. 1983. Method for biological quality assessment of water courses in Belgium. Hydrobiologia, vol. 100, p. 153-168. EGLER, M. 2002. Utilizando a fauna de macroinvertebrados
como indicadores de integridade ambiental em uma área
de agricultura intensiva em Nova Friburgo. Rio de
Janeiro: Escola Nacional em Saúde Publica, Fundação Oswaldo Cruz. [Dissertação de Mestrado em Saúde Pública].
Fundação Estadual de Engenharia do Meio Ambiente - FEEMA. 1982. Métodos de Análises físico-químicas da
água. Vol. III. Rio de Janero: FEEMA. 86 p. Súmula
no 08/82.
FENOGLIO, S., BALDINO, G. and BONA, F. 2002. Benthic macroinvertebrate communities as indicator of river environment quality: an experience in Nicaragua. Revista de Biologia Tropical, vol. 50, no. 3-4, p. 1125-1131.
GHETTI, PF. 1986. I macroinvertebrati nell´analisi di
qualitá dei corsi d´acqua. Trento: Provincia Autonoma
SALLES, FF., RIBEIRO DA-SILVA, E., HUBBARD, MD. and SERRÃO, JE. 2004b. Systematics, morphology and physiology. Baetidae (Ephemeroptera) na Região Sudeste do Brasil: novos registros e chaves para os gêneros no estágio ninfal. Neotropical Entomology, vol. 33, no. 5, p. 725-735.
SKOULIKIDIS, NT., GRITZALIS, KC., KOUVARDA, T. and BUFFAGNI, A. 2004. The development of an ecological quality assessment and classification system for Greek running waters based on benthic macroinvertebrates. Hydrobiologia, vol. 516, p. 149-160.
SILVEIRA, M. 2001. Utilizando a Comunidade de Macroinvertebrados Bentônicos na Avaliação da
degradação de ecossistemas de rios em áreas agrícolas.
Rio de Janeiro: Escola nacional de Saúde Pública. Fundação Oswaldo Cruz. [Dissertação de Mestrado em Saúde Pública].
SILVEIRA, MP., BAPTISTA, DF., BUSS, DF., NESSIMIAN, JL. and EGLER, M. 2005. Application of biological measures for stream integrity assessment in South-East Brazil. Environmental Monitoring and
Assessment, vol. 1-3, p. 117-128.
SPIAGGIARI, R. and FRANCESCHINI, S. 2000. Procedure di calcolo dello stato ecologico dei corsi d´acqua e di rappresentazione grafica delle informazioni. Biologia Ambientale, vol. 14, no. 2, p. 1-6.
THORNE, RSTJ. and WILLIAMS, PW.1997. The response of benthic macroinvertebrates to pollution in developing countries: a multimetric system of bioassessment. Freshwater Biology, vol. 37, no. 3, p. 671-686. http://dx.doi.org/10.1046/j.1365-2427.1997.00181.x
TUFFERI, G. and DAVALINE PM. 1970. Niveau Faunistique Le plus eleve et índice de diversité biotique. In: Diagnose écologique en cours d´eaux a
salmonidae. CECPI 6°ed., Cracovie, Pologne.
VLEK, HE., VERDONSCHOT, PFM. and NIJBOER, RC. 2004. Toward a multimetric index for assessment of Dutch stream using benthic macroinvertebrates.
Hydrobiologia, vol. 516, p. 173-189. http://dx.doi.
org/10.1023/B:HYDR.0000025265.36836.e1 ZAMORA-MUÑOZ, C., SÁINZ-CANTERO, CE.,
SÁNCHEZ-ORTEGA, A. and ALBA-TERCEDOR, J. 1995. Are biological indices BMWP and ASP and their significance regarding water quality seasonally dependent? Factors explaining their variation. Water
Research, vol. 29, n. 1, p. 285-290.
WOODIWISS, FS. 1964. The biological system of stream classification used by the Trent River Board.
Chemistry and Industry, vol. 11, p. 443-447.
WOODIWISS, FS. 1978. Second Technical Seminar
– Background information. Commission of the
European Communities.
Received: 18 December 2009 Accepted: 16 August 2011 genera of Plecoptera (Insecta) based on nymphs.
Zootaxa, vol. 651, p. 1-15.
OLIVEIRA, RBS., MUGNAI, R., CASTRO, CM. and BAPTISTA, DF. 2011. Determining subsampling effort for the development of a rapid bioassessment protocol using benthic macroinvertebrates in stream of Southeastern Brazil. Environmental Monitoring
and Assessment, vol. 175, p. 75-85. http://dx.doi.
org/10.1007/s10661-010-1494-4
PETERSEN, RC. 1992. The RCE: a Riparian, Channel, and Environmental Inventory for small stream in the agricultural landscape. Freshwater
Biolog y, vol. 27, p. 295-306. http://dx.doi.
org/10.1111/j.1365-2427.1992.tb00541.x
PETKOVSKA, V. and URBANIC, G. 2009. Effect of fixed fraction subsampling on macroinvertebrate bioassessment of rivers. Environmental Monitoring
and Assessment, vol. 169, no. 1-4, p. 179-201.
PINDER, LCV. and FARR, IS. 1987. Biological surveillance of water quality. The influence of organic enrichment on the macroinvertebrates of a small chalk stream. Archiv für Hydrobiologie, vol. 109, p. 619-637.
RAVERA, O. 2001. A comparison between diversity, similarity and biotic indices applied to the macroinvertebrate community of small stream: the Ravella river (Como Province, Northern Italy).
Aquatic Ecology, vol.35, p. 97-107. http://dx.doi.
org/10.1023/A:1011433813309
RESH, VH., NORRIS, RH. and BARBOUR, MT. 1995. Design and implementation of rapid assessment approaches for water resource monitoring using benthic macroinvertebrates. Australian Journal
of Ecology, vol. 20, p. 108-121. http://dx.doi.
org/10.1111/j.1442-9993.1995.tb00525.x
ROSENBERG, DM. and RESH, VH., eds. 1993. Freshwater biomonitoring and benthic
macroinvertebrates. New York: Chapman and Hall.
488 p.
ROSSARO, B. and PIETRANGELO, A. 2004. Macroinvertebrate distribution in streams: a comparison of CA ordination with biotic indices.
Hydrobiologia, vol. 662, n. 1, p. 109-118
RODRÍGUEZ CAPÍTULO, A. TANGORRA, M. and OCÓN, C. 2001. Use of benthic macroinvertebrates to assess the biological status of Pampean streams in Argentina. Aquatic Ecology, vol. 35, p. 109-119. SALLES, FF., RIBEIRO DA-SILVA, E., HUBBARD,
MD. and SERRÃO, JE. 2004a. As espécies de Ephemeroptera (Insecta) registrada para o Brasil.
Biota Neotropic, vol. 4, no. 2, p. 1-34. Available from:
84 Mugnai, R. et al. Acta Limnologica Brasiliensia
Appendix 1. Taxonomic level required for each macroinvertebrate group for the calculation of richness in Systematic Units (SU) for the application of the IBE-IOC index. Extract from Mugnai et al. (2008).
Taxa Taxonomic level
BLATTARIA presence
COLEOPTERA family
DIPTERA family
EPHEMEROPTERA genus family for Baetidae
HETEROPTERA genus
LEPIDOPTERA family
MEGALOPTERA genus
NEUROPTERA family
ODONATA genus
PLECOPTERA genus
TRICHOPTERA family
CRUSTACEA family
HIRUDINEA presence
MOLLUSCA genus
OLIGOCHAETA presence
TRICLADIDA presence
Appendix 3. Water quality class conversion table, description of environmental condition and suggested color. Based on the IBE-IOC index values. Extract from Mugnai et al. (2008).
IBE-IOC value Quality class Description Color
10, 11, 12, 13, 14 I Unpolluted Blue
8, 9 II Slightly polluted Green
6, 7 III Moderately polluted Yellow
3, 4, 5 IV Heavily polluted Orange
0, 1, 2 V Very heavily polluted Red
Appendix 2. Table of two entries with the values used for Biological quality value calculation in IBE-IOC index. In the lines presented the most sensitive faunistic group found in the samples. In the columns presented the richness in SU per sample, according to the taxonomic level (described in the Appendix 1). Extract from Mugnai et al. (2008).
Faunistic groups Total Taxa richness SU
SU 1-10 11-15 16-20 21-25 26-30 31-35 36-40 41-45 > 45 PLECOPTERA
except Anacroneuria and
Paragripopteyx
> 1 - - 8 9 10 11 12 13 14
only 1 - - 7 8 9 10 11 12 13
EPHEMEROPTERA
except Baetidae, Leptohyphidae,
Hylister, Miroculis and Farrodes, including Paragripopteyx
> 1 - - 7 8 9 10 11 12
-only 1 - - 6 7 8 9 10 11
-TRICHOPTERA except Calamoceratidae,
Glossosomatidae, Helicopsychidae, Hydroptilidae, Hydropsychidae and Leptoceridae, including Anacroneuria
> 1 - 5 6 7 8 9 10 11
-only 1 - 4 5 6 7 8 9 10
-AMPHIPODA
including Baetidae, Hylister, Miroculis, Farrodes, Leptohyphidae, Calamoceratidae, Glossosomatidae, Helicopsychidae, Hydroptilidae, Hydropsychidae and Leptoceridae
- 3 3 4 5 6 7 8 -
-OLIGOCHAETA / CHIRONOMIDAE - 1 2 3 4 5 - - -
-Appendix 4. Values for the calculation of annual mean: a) to transform the value of IBE-IOC in numerical value; b) to transform the numerical value in IBE-IOC value.
a b
IBE-IOC Value IBE-IOC Valor Value IBE-IOC Value IBE-IOC Value IBE-IOC
14/13 13.6 7/8 7.4 1.0-1.3 1 5.4-5.5 5/6 9.6 10/9
13/14 13.4 7/6 6.6 1.4-1.5 1/2 5.6 6/5 9.7-10.3 10
13/12 12.6 6/7 6.4 1.6 2/1 5.7-6.3 6 10.4-10.5 10/11
12/13 12.4 6/5 5.6 1.7-2.3 2 6.4-6.5 6/7 10.6 11/10
12/11 11.6 5/6 5.4 2.4-2.5 2/3 6.6 7/6 10.7-11.3 11
11/12 11.4 5/4 4.6 2.6 3/2 6.7-7.3 7 11.4-11.5 11/12
11/10 10.6 4/5 4.4 2.7-3.3 3 7.4-7.5 7/8 11.6 12/11
10/11 10.4 4/3 3.6 3.4-3.5 3/4 7.6 8/7 10.7-11.3 12
10/9 9.6 3/4 3.4 3.6 4/3 7.7-8.3 8 12.4-12.5 12/13
9/10 9.4 3/2 2.6 3.7-4.3 4 8.4-8.5 8/9 12.6 13/12
9/8 8.6 2/3 2.4 4.4-4.5 4/5 8.6 9/8 12.7-13.3 13
8/9 8.4 2/1 1.6 4.6 5/4 8.7-9.3 9 13.4-13.5 13/14