Received: 2 0 September, 2012. Accepted: 28 November, 2013
ABSTRACT
Forest fragmentation affects biological communities by reducing habitat and increasing edges, thus reducing the ef-fective size of the habitable zones. The subtropical atlantic Araucaria forest, typical on the southern Brazil, in some regions has been reduced to less than 1% of its original size lasting only in small isolated fragments. This study aimed to analyse the impact the edge has on vascular epiphyte ensemble in a remnant of Araucaria forest. We surveyed 40 host trees in four transects: one at the edge; and three at 15, 30 and 60 m from the edge. On each host tree we estimated the epiphyte biomass, using four size classes. We compared the transects using Jackknife estimator of absolute species number, diversity indices, non-metric multi-dimensional scaling and multi-response permutation procedure analysis. We recorded 85 epiphytes species. Absolute species richness and diversity were lower at the edge and higher at 60 m in from the edge. Shannon’s evenness did not differ significantly among transects and Simpson’s evenness values were inconsistent. The vascular epiphyte community under study was significantly altered by the edge.
Key words: Disturbed areas, Araucaria forest, subtropical Atlantic Forest, fragmentation
Edge effect on vascular epiphytes in a subtropical Atlantic Forest
Juliana Santos Bianchi1 and Rodrigo de Andrade Kersten2,3
1 Pontifícia Universidade Católica do Paraná, Centro de Ciências Biológicas, Curitiba, PR, Brazil
2 Pontifícia Universidade Católica do Paraná, Centro de Ciências Biológicas e da Saúde, Herbário HUCP, Curitiba, PR, Brazil 3 Author for correspondence: [email protected]
Introduction
The Araucaria forest is a subtropical Atlantic Forest, found in southern Brazilian highlands, mainly at Paraná state, which originally contained the largest extension of this formation (Hueck 1972). This forest begins near the coast shore, on the west slope of the Serra do Mar moun-tain range, and extends almost through the state (Maack 1968). Less than 1% of the original Araucaria at Paraná is well-preserved and the large majority of the remnants are small and isolated, indicating the severity of the situation concerning this type ecosystem (Castela & Britez 2004).
The term “disturbance”, widely used to describe changes in the natural environment, can have a number of different meanings including any condition that causes death or a loss of biodiversity. It can also be defined as the result of events that kill, displace or damage individuals. Disturbances are regularly categorised as being anthropogenic; a term widely used as a synonym for changes caused by human activity (Dornelas et al. 2011). However, disturbances also occur naturally within preserved ecosystems.
Disturbances are important phenomena and play a fundamental role in patterns of diversity and ecosystem processes (Dornelas et al. 2011), moderate periodic distur-bance can facilitated competitive coexistence and increase diversity (Holt 2008) and promote coexistence of species adapted to different conditions (Connel 1978). Given the
importance of diversity in relation to ecosystems, particu-larly to their resilience (Folke et al. 2004), obtaining accurate measurements of the effect of disturbances on diversity is essential for the management and conservation of natural resources.
the edge, the difference having been reported to level out at approximately 20 m from the edge. Light intensity is probably the factor that becomes most quickly stabilised along the fragment edge. Edges are also drier than are the interiors. The width of the stretch in which humidity is lower is generally greater than is that of the stretch in which the light intensity is lower. Both stretches form a gradient within the forest interior. At the edge, the light intensity is high and the humidity is low; from the edge toward the interior, there is then a zone in which the light intensity is lower but the humidity remains, beyond which there is then a zone in which the light intensity remains low but the humidity increases (Rodrigues 1998).
The edge can affect organisms in a forest fragment by causing changes to the biotic and abiotic conditions. If exposure to the edge causes changes to the characteristics of the forest beyond the natural tolerance limits of the or-ganism, the modified region will no longer be suitable for the original ecosystem and the proportion of the fragment in which the conditions are conducive to preservation will effectively be reduced (Murcia 1995).
Vascular epiphytes can be used as indicators of the conservation status of an ecosystem as they depend on the substrate, humidity and the shade provided by the tree species (Triana-Moreno et al. 2003) and to what extent their abundance and diversity are influenced by changes in ecological conditions along altitudinal, latitudinal and continental gradients. Forest disturbances have distinct negative effects on flora, forcing a shift from mesic to drought tolerant species, thereby reducing biodiversity and epiphytic biomass. However, vascular epiphytes show signs of resistance when timber extraction activity spares large-scale individuals (Wolf 2005). Because this flora contributes to the diversification of niches and microhabitats, increases the available amount of physical space and nutrients, and provides reproductive refugia for many types of animals (Benzing 1986), the resulting impact on the ecosystem is greater than a mere change in its structural patterns.
Although some studies on vascular epiphytes have al-ready been conducted on the Araucaria forest this ecosystem has not been extensively studied on its structural or ecologi-cal aspects and most published paper are floristic surveys like Dittrich et al. (1999) and Hefler & Faustioni (2004) in Municipal Parks, Borgo & Silva (2003) in forest fragments in Curitiba; Kersten and Kuniyoshi (2006) in Iguaçu river ba-sin; Kersten & Rios (2006) in the ecotone between Araucaria
forest and deciduous forest in Argentina; and by Kersten & Waechter (2011b) and Bianchi et al. (2012), both in an eco-tone between Araucaria forest and Atlantic Forest. The only studies that have considered ecological relationships were conducted by Kersten & Silva (2002), who described the population structure of a floodplain forest, and by Kersten
et al. (2009), who studied the various successional forests seres on the the Iguaçu River floodplain. Only two surveys considered edge influence on vascular epiphytes (Bataghin
et al. 2008; Bernardi & Budke 2010), both conducted in the extreme south Brazil.
Based on the hypothesis that the epiphyte community is negatively influenced by the fragmentation of habitats, the purpose of this work was to analyse changes in the diversity and abundance of epiphytes across an edge-interior gradient in a fragment of Araucaria forest in an advanced phase of regeneration in the state of Paraná.
Material and methods
The study area (25°39’S; 49°16’W) is an advanced Arau-caria forest remnant, at an elevation of approximately 920 m. According to the Köppen classification, the climate is Cfb (humid subtropical mesothermal), with annual average temperature of 16.5°C, ranging from 12.2°C in the coldest month (June) and 19.9°C in the hottest (February). The annual rainfall is 1410.1 mm, with only 74 mm on August, the dryer month (IAPAR 1994).
Forty individual host trees were selected, ten in each of four separate transects, beginning at an edge area created by a 30 m road. The transects were delineated as edge: comprising host trees with crowns and trunks exposed at the edge; 10 m: comprising host trees whose trunk bases were located 10-15 m from the edge; 30 m: comprising host trees whose trunk bases were located 30-35 m from the edge; and 60 m: comprising host trees whose trunk bases were located > 60 m from the edge. We randomly selected ten host trees in each transects and conducted a detailed survey of each host tree, divided into five ecological zones (Kersten & Waechter 2011a): lower trunk, mid trunk, up-per trunk, lower crown and upup-per crown. For each zone, the biomass of the epiphytic species was evaluated in four size classes—very small, small, medium and large—which were subsequently converted to a score (1, 5, 15 and 35, re-spectively). We evaluated the epiphytes by climbing the host trees, with the aid of a (7-m) ladder and/or climbing tecnics, as well as by binocular observation, from various points on the tree, from the ground and from neighbouring trees.
Three aspects are of primary interest on a diversity study (Buckland et al. 2005): number of species, overall abundance, and species evenness. We evaluated various parameters in an attempt to fully cover those three factors. The four transects species richness were compared, using the Jackknife first order estimator. This parameter assumes that not all species in the area are properly recorded and is based on the number of single-occurrence (singleton), a process chosen for its stability with low sample size (Magur-ran & McGill 2011). This estimator, including its standard error, was calculated with EstimateS, version 8.0.
given that D =(ni/N)
2), based on richness and evenness in equal proportions (Maurer & McGill 2011). In those formu-las, S is the observed richness; n1 is number of individuals
of species i; and N is the total number of individuals. The frequency of on vertical zones and not on individual trees, as usual (Kersten & Waechter 2011a) was used because it is a better approximation for the number of individuals,. We compared the indices two-by-two using the bootstrap, with 1000 replications. Simpson’s dominance (D), rather than Simpson’s diversity index (1/D), was used for comparisons. Diversity calculations were made using the PAleontological STatistics (PAST) program, version 2.12, except for Simp-son’s evenness, which was calculated manually and therefore not compared through statistical methods. In addition, for a visual comparison between the transects, we created a spe-cies abundance distribution diagram based on the absolute frequencies (Whittaker Diagram).
Abundance was calculated using the sum of the biomass. The difference between the total abundances in transects was tested using the chi-square. Considering epiphyte abun-dance on the host trees we performed an ordination analysis using non-metric multidimensional scaling (NMDS) with Bray-Curtis distance as a measure of similarity and correct-ing the value by log(n+1) in order to increase the homoge-neity of variance. We used the multi-response permutation procedure (MRPP), also based on the Bray-Curtis distance, as an a posteriori test for all transects and for making the paired (two-by-two) comparisons. The MRPP reports a test statistic (T) describing the separation between groups and a measure of effect size (A) describing within-group agree-ment. Species with single occurrences (singleton species) were excluded in both cases. The calculations were made using the PC-ORD program, version 6.0.
Results
We registered 85 epiphytic species, 26 of which were observed in all four transects. Three species were exclusive to the edge, five were exclusive to the 10-m transect, eight were exclusive to the 30-m transect, and 17 were exclusive to the 60-m. The observed and estimated richness, Margalef ’s index, total abundance and average abundance were lowest at the edge, highest in the 60-m transect, and intermediate in the 10-m and 30-m transects (Tab. 1). Shannon’s evenness did not differ among the transects and Simpson’s index did not differ between 10-m and 30-m.
The abundance distribution diagram shows that the communities were quite similar in terms of the frequency of species (Fig. 1), indicating high levels of evenness and diversity. The greater length and shallower slope of the curve for the internal transect indicate the higher richness and greater diversity observed in the centre of the fragment. In addition to the ecological descriptors the community structure was also significantly affected by the disturbance, a result which can be observed not only by species abundance
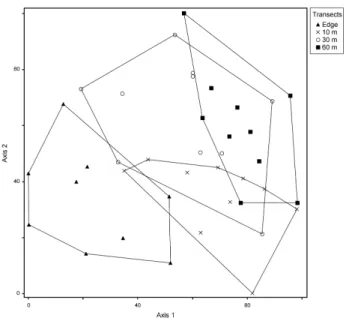
(Fig. 2) but also by the multidimensional scaling (Fig. 3). The species with the greatest abundance were Vriesea friburgensis, Microgramma squamulosa and Pleopeltis hirsutissima at the edge; Aechmea distichantha, Rhipsalis campos-portoana and Microgramma squamulosa in the 10-m transect; Philodendron loefgrenii, Pleopeltis hirsutis-sima and Vriesea friburgensis in the 30-m transect; and
Philodendron loefgrenii, Vriesea friburgensis and Aechmea distichantha in the 60-m transect. The 26 species that were recorded in all four transects corresponded to 80% of the total abundance (approximate number of individuals) in the study area.
In the NMDS analysis (Fig. 3), the stress at four di-mensions was 0.13. One edge host tree was discarded as an outlier. There was a clear separation between the edge and the 60-m transect (axis 1), whereas the 10-m and 30-m transects formed less cohesive groups (separated from each other by axis 2),. Although the overall MRPP results showed differences among the groups (T=−7.96;
A=0.0810; p<0.001), the two-by-two comparisons (Tab. 2) indicated that there were differences between all of the transects, in terms of the epiphyte communities, except for transects 30-m and 60-m.
Figure 1. Whittaker Diagram displaying the distribution of species abundance, based on the frequency of occurrence of the species in each transect. Table 1. Diversity indicators for the vascular epiphytes in the various transects evaluated in the edge effect study.*
Index Edge 10 m 30 m 60 m
Observed species richness 37a 47b 52b 64c
Estimated richness** 44.2a 61.4b 66.4b 87.4c
Margalef ’s richness index (SMg) 6.72a 8.20b 9.21b 11.04c
Total abundance 562a 1819b 1852b 2613c
Mean abundance 2.8a 7.1b 7.3b 8.8c
Shannon’s evenness (J’) 0.91 0.88 0.88 0.89
Simpson’s diversity index (1/D) 21.31a 22.28a 23.48a 31.32b
Discussion
Despite recent reviews stating that richness is not sensitive to sudden changes (Dornelas et al. 2011), the three parameters (observed richness, estimated richness and Margalef ’s index) varied progressively from the edge to the interior on the study area. Thus, we can clearly state that epiphytic species richness is significantly affected by habitat fragmentation, with a ma-jor loss of species in the edge. Species loss is one of the most evident factors in disturbed areas and has various effects on the communities. Cardinale et al. (2006) suggested that reduc-tions in richness affect ecosystemic processes such as biomass production and efficacy of resource use. Other properties, such as invasiveness, temporal stability and resilience, have also been associated with richness (Hillebrand et al. 2008).
In addition to richness, abundance also was affected by the disturbance. The edge, as an environment with higher light intensity, dryer air and moderately strong wind blowing through the branches, sustained approximately 4.6 times less biomass than the 60-m transect and 3.3 times less than did the 10-m and 30-m transects, a result that agrees with the findings of Williams-Linera (1990), who reported that the most significant changes occur at 2.5-15 m in from the edge of the fragment.. Biomass is related to primary production, niches diversity and the carrying capacity of the ecosystems (Cardinale et al. 2006). In the present study, two factors contributed to this: large species occurred less frequently at the edge; and the individuals at the edge tended to be smaller than those of the same species in inner transects what somehow agrees with other studies (Harper et al. 2005) that described greater growth and recruitment of some spe-cies but reduced growth or increased mortality of others.
Evenness is the parameter that reflects symmetry between species abundance, maximum evenness occur when all species have equal abundance. Although absolute abundance and richness might vary between transects, the proportion between each species remains similar (Shannon’s evenness, Tab. 1) or does not vary on a consistent basis (Simpson’s evenness). This result is radically different to that reported by Hilldebrand et al. (2008), who stated that even-ness responds more quickly to anthropogenic disturbances than richness, leading to an increased amount of dominance
Table 2. Two-by-two comparison (multi-response permutation procedure) among the transects evaluated in the edge effect study of vascular epiphytes.*
Transects Edge 10 m 30 m
T A T A T A
10 m −6.26 0.085
30 m −5.76 0.070 −2.63 0.026
60 m −8.64 0.112 −2.72 0.028 n.s. n.s.
T – degree of separation between the groups, higher negative values indicating greater separation A – level of within-group agreement, comparing the distance within and between the groups, higher values indicating greater separation. *All values are significant (p>0.05), unless otherwise indicated (n.s.)
Figure 2. Abundance of the main species recorded in the different transects evaluated in order to study the edge effect in vascular epiphytes, organised in decreasing order by according to the level of abundance in the 60-m transect.
in disturbed areas. A similar result was recorded Bernardi & Budke (2010) in which diversity did not vary from the edge to the interior of the area studied. Apparently, this is related to the tropical ombrophilous climate in this study. A well-distributed rainfall throughout the year, with no water deficit, is, despite the edge still a good environment for epiphytes. Eventhough being more restrictive than the inner transects we found no evidence of any highly domi-nant species, as has been reported, for example, for tree on nearby floodplain forests (Curcio et al. 2007).
Simpson index, like any diversity index takes both rich-ness and evenrich-ness into account and behaved exactly as ex-pected: as a union of the richness (highly affected) and even-ness (effected not conclusive). The influence of the edge was less perceptible and only difference indicated by this index was for the innermost transect (60 m), whereas all other were statistically equal and the lower contrast certainly influenced by the overall evenness. Therefore, when attempting to calcu-late a series of indices, it is important to understand, a priori, what calculations are actually required and what each index signifies, as has been previously reported (Maguran & McGill 2011, Dornellas et al. 2011). The components of the indices of diversity, richness and evenness are often orthogonal and can be treated as such (i.e., used separately).
Abundance was the parameter with higher variation among transects. The estimated biomass was 3 times greater at 10 and approximately 5 times greater at 60 than in the edge. Although biomass is a key factors in community ecology (Guo 2007) different guilds might not respond to similar patterns in the same ways Paciencia & Prado (2004) studying pteridophytes demonstrated that abundance was not altered by the edge although species number was, and Williams-Linera (1990) findings indicated that basal area was greater at the edge of the forest..
Despite that epiphyte biomass rarely accounting for more than 2% of the dry mass of a forest, its photosynthetic biomass, photosynthesis rate and ion capture rate can equal, or even surpass, that of the trees (Nadkarni 1984; Coxson & Nadkarni 1995, Benzing 1990, Hofstede et al. 1993). In certain forests, epiphytes comprise up to 63% of the photosynthetic biomass (Walker & Ataroff 2002) and 45% of the mineral content (Nadkarni, 1984). Additionally, epiphytes can inter-cept and accumulate substantial quantities of dead organic material, a rich source of nutrients for fauna and vegetation existing above the ground, influence water dynamics and the microclimate (Pócs 1980, Hofstede et al. 1993; Bohlman et al.
1995, Freiberg & Freiberg 2000). Epiphytes play an important role in the primary productivity and nutrient cycling within ecosystems, contributing significant quantities of biomass. By absorbing nutrients from rain, mist or suspended particulate matter (Nadkarni 1984), epiphytes are capable of rapidly reintegrating energy and ions into an ecosystem (Matelson
et al. 1993). Thus, they are not only influenced by the envi-ronmental changes caused by the edge effect but also play an important and decisive role in effecting those changes.
Differences cause by disturbances on communities can be measured in various different ways. Metrics based on diversity, although providing important information about community despise species identity. Distinct species however present distinct susceptibility, So describing the community with multivariate analysis, using abundances as variables, make the detection of different effects possible, which univariate analysis in unable to do.
In the NMDS analysis, neither axis 1 or axis 2 are cor-rectly represented by richness, diversity or abundance, although axis 1 is closely associated to the latter. In the MRPP, the overall within-group agreement (WGA = A) was low, suggesting that WGA was only slightly lower than between the groups. In ecology studies, it is common to see
A < 0.1, whereas values of A > 0.3 are considered quite high (McCune & Mefford 2006).
Together, the results of the NMDS analysis and the MRPP indicates a gradual change in the epiphyte com-munity composition from edge to inward. Clear separation between transects at extremes, with less contrast between those in the intermediate zone, is an expected result due to gradients of light intensity, humidity and other environ-mental factors (Rodrigues 1998),. Therefore, the increase in the quantity of edges caused by fragmentation is not only reducing the richness and diversity of epiphytes but also quite probably destroying populations of species that are not adapted to these environments. Another potentially ongoing factor is represented by the “extinction debt” (Wearn et al.
2012): changes that are sometimes not perceived within the community until many years after the disturbance. There is no way of knowing whether the epiphyte community will continuously react to such changes and to suffer from the edge influence or whether the community is already is stabilised and adapted to the new conditions .
One should note that the studied fragment was created by road and distance to the next forest fragment is no more than 30 m, resulting in shaded edge during the evening. Matlack (1994) found that the edge effects on vegetation were much greater for edges facing north (which receive more light). It is therefore reasonable to assume that if our study had been conducted in one of the edge areas that face existing regional crop areas, the effect could have been more pronounced and observed at shorter distances.
References
Bataghin, F.A.; Fiori, A. & Toppa, R.H. 2008 Efeito de borda sobre epífitos vasculares em Floresta Ombrófila Mista, Rio Grande do Sul, Brasil. O Mundo da Saúde 32:329-338.
Benzing, D. 1986. The vegetative basis of vascular epiphytism. Selbyana 9: 23-43.
Benzing, D. H. 1990. Vasculars epiphytes:general biology and related biota. Cambridge, Cambridge University Press.
Bernardi, S. & Budke, J. C. 2010. Estrutura da sinúsia epifítica e efeito de borda em uma área de transição entre Floresta Estacional Semidecídua e Floresta Ombrófila Mista. Floresta 40: 81-92.
Bianchi, J.S.; Michelon, C. & Kersten, R.A. 2012. Epífitas vasculares de uma área de ecótono entre as Florestas Ombrófilas Densa e Mista, no Parque Estadual do Marumbi, PR. Estudos de Biologia – Ambiente e Diversidade34: 37-44.
Bohlman, S.A.; Matelson, T.J. & Nadkarni, N.M. 1995. Moisture and tem-perature patterns of canopy humus and forest floor soil of a montane cloud forest, Costa Rica. Biotropica27: 13-19.
Borgo M. & Silva S.M. 2003. Epífitos vasculares em fragmentos de Flo-resta Ombrófila Mista, Curitiba, Paraná, Brasil Revista Brasileira de Botânica 26: 391-401.
Buckland, S.T., Magurran, A.E. Green, R.E. & Fewster, R.M. 2005. Moni-toring change in biodiversity through composite indices. Phil. Trans. R. Soc. B360: 243-254
Cardinale, B.J.; Srivastava, D.S.; Duffy, J.E.; Wright, J.P.; Downing, A.L.; Sankaran, M. & Jouseau, C. 2006. Effects of biodiversity on the functioning of trophic groups and ecosystems. Nature 443: 989-992. Castela, P.R. & Britez, R.M. 2004. A floresta com Araucária no estado do
Paraná. Brasilia, Ministério do Meio Ambiente.
Connel, J.H. 1978. Diversity in Tropical Rain Forests and Coral Reefs.
Science199: 1302-1310.
Coxson D.S. & Nadkarni, N.M. 1995. Ecological roles of epiphytes in nutri-ent cycles. Pp 73-106. In: Lowman, M.D. & Nadkarni, N.M. (Eds.).
Forest Canopies. San Diego, Academic Press.
Curcio, G.R.; Galvão, F.; Bonnet, A.; Barddal, M.L. 2007. Fitotipias em am-biente fluvial do rio Iguaçu e suas relações com os padrões geomórficos e tipos de solos. Revista Brasileira de Biociências5: 516-518. Dittrich, V.A.O.; Kozera, C. & Silva, S.M. 1999. Levantamento florístico
de epífitos vasculares no Parque Barigüi, Paraná, Brasil. Iheringia, Série Botânica 52: 11-22.
Dornelas, M.; Soykan, C.U. & Ugland, K.I. 2011. Biodiversity and distur-bance. Pp 237-251. In: Magurran, A.E. & McGill, B.J. (Eds.) Frontiers in measuring biodiversity. New York, Oxford University Press. Fischer, J & Lindenmayer, D.B. 2007. Landscape modification and habitat
fragmentation: a synthesis. Global Ecology and Biogeography 16: 265–280.
Folke, C,; Carpenter, S.; Walker, B.; Scheffer, M.; Elmqvist, T.; Gunderson, L. & Holling, C.S. 2004. Regime shifts, resilience and biodiversity in ecosystem management. Annual Review Ecology Evolution Sys-tematics35: 557-581.
Freiberg M. & Freiberg E. 2000. Epiphyte diversity and biomass in the canopy of lowland and montane forests in Ecuador. Journal of Tropi-cal Ecology 16: 673-688.
Gentry, A.H. & Dodson C.H. 1987. Diversity and biogeography of neotropi-cal vascular epiphytes. Ann Missouri Botanical Gardens 74:205-223. Gotelli, N.J. & R.K. Colwell. 2011. Estimating species richness. Pp 39-54. In: Magurran A.E. & McGill, B.J. (Eds.). Frontiers in measuring biodiversity. New York, Oxford University Press.
Guo, Q. 2007. The diversity–biomass–productivity relationships in grassland management and restoration. Basic and Applied Ecology 8: 199-208.
Hammer, Ø. 2010. PAST Paleontological Statistics - Reference Manual. v. 2.02. 1999 – 2010. Publicado on-line, disponível em http://folk.uio. no/ohammer/past/ Klingenberg Lab.
Harper, K. A.; Macdonald, S. E.; Burton, P. J.; Chen, J., Brosofske, K. D.; Saunders, S. C. & Esseen, P. A. 2005. Edge influence on forest structure and composition in fragmented landscapes. Conservation Biology 19: 768-782.
Hefler, S. & Faustioni, P. 2004. Levantamento Florístico de Epífitos Vascu-lares do Bosque São Cristovão – Curitiba – Paraná – Brasil. Estudos de Biologia 26: 11-19.
Hillebrand, H.; Bennett, D.M. & Cadotte, M.W. 2008. Consequences of dominance: a review of evenness effects on local and regional eco-system processes. Ecology 89: 1510-1520
Hofstede, R.G.M.; Wolf, J.H.D; Benzing, D.H. 1993. Epiphytic biomass and nutrient status of a Colombian upper montane rain forest. Selbyana 14: 37-45.
Holt, R.D. 2008. Theoretical perspectives on resource pulses. Ecology 89: 671-681.
Hueck, K. 1972. Florestas da América do Sul: ecologia, composição e importância econômica. Brasília, Universidade de Brasília. IAPAR. 1994. Cartas climáticas básicas do Estado do Paraná. Londrina,
Fundação Instituto Agronomico do Paraná.
Kersten, R.A. & Silva, S.M. 2002. Florística e estrutura do componente epifítico vascular em floresta ombrófila mista aluvial do rio Barigüi, Paraná, Brasil. Revista Brasileira de Botânica 25: 259-267. Kersten, R.A. & Kuniyoshi, Y.S. 2006. Epífitos vasculares na bacia do alto
Iguaçu - composição florística. Estudos de Biologia 28: 55-71. Kersten, R.A. & Rios, R.C. 2006. Epífitas vasculares de duas áreas protegidas
em Missiones, Argentina. In: Anais do 57º Congresso Nacional de Botânica. Gramado, RS. Sociedade Botanica do Brasil.
Kersten, R.A.; Kuniyoshi, Y.S. & Roderjan, C.V. 2009. Comunidade epífita em duas formações florestais do Rio São Jerônimo, Bacia do Rio Iguaçu, municípios de Guarapuava e Pinhão, Paraná. Iheringia, Série Botânica 64: 33-43.
Kersten. R.A. & Waechter, J.L. 2011a. Métodos quantitativos no estudo de comunidades epifíticas. Pp. 231-254. In: Felfili-Fagg, J.M. Eisen-lohr, P.V. Melo, M.M.R.F. Andrade, L.A. & Meira Neto, J.A.A. (Eds.).
Fitossociologia no Brasil: métodos e estudos de caso. v.1. Viçosa, Editora UFV.
Kersten. R.A. & Waechter, J.L. 2011b Florística e Estrutura das epífitas vasculares em zona ecotonal entre as Florestas Ombrófilas Mista e Densa, vertente oeste da Serra do Mar paranaense. Pp. 479-503. In: Felfili, J.M. Eisenlohr, P.V. Melo, M.M.R.F. Andrade, L.A. & Meira Neto, J.A.A. (Eds.). Fitossociologia no Brasil: métodos e estudos de caso. Viçosa, Editora UFV.
Laurance, W.F. & Yensen, E. 1991. Predicting The impacts of edge effects in fragmented habitats. Biological Conservation 55: 77-92. Maack, R. 1968. Geografia física do estado do Paraná. Rio de Janeiro,
José Olympio.
Magurran, A.E. & McGill, B.J. 2011. Frontiers in measuring biodiversity. New York, Oxford University Press.
Matelsotn, J.; Naukarnanid, N.M. & Longino, J.T. 1993. Survivorship of fallen epiphytes in a Neotropical cloud forest, Monteverde, Costa Rica.
Ecology 74: 265-269.
Matlack, G.R. 1994. Vegetation dynamics of the forest edge – trends in space and successional time. Journal of Ecology 82: 113-123. Maurer, B.A. & McGill, B. 2011. Measurement of especies diversity. Pp
55-65. In: Magurran A.E. & J. McGill, B. (Eds.). Frontiers in measuring biodiversity. New York, Oxford University Press.
Mccune, B. & Mefford, M.J., 2006. PC-ORD. Multivariate Analysis of Ecological Data. Gleneden Beach, Oregon.
Metzger, J. 1999. Estrutura da paisagem e da fragmentação: Análise bib-liográfica. Anais da Academia Brasileira de Ciências 71: 445-463. Murcia, C. 1995. Edge effects in fragmented forests: implications for
con-servation. Trends in Ecology and Evolution 10: 58-62.
Nadkarni, N.M. 1984. Epiphyte Biomass and Nutrient Capital of a Neo-tropical Elfin forest. Biotropica 16: 249-256.
Pócs, T. 1980. The epiphytic biomass and its effect on the water balance of two rain forest types in the Uluguru Mountains (Tanzania, East Africa). Acta Botanica Hungarica 26: 143-167.
Ranney, J.W.; Bruner, M.C. & Levenson, J.B. 1981. The importance of edge in the structure and dynamics of forest islands. Ecological Studies 41: 67-95.
Triana-Moreno, L.A.; Garzón-Venegas, N.J.; Sánchez-Zambrano, J. & Vargas, O. 2003. Epífitas vasculares como indicadores de regeneración en bosques intervenidos de la amazonía Colombiana. Acta Biológica Colombiana 8: 31-42.
Walker, R & Ataroff, M. 2002. Biomasa epifita y su contenido de nutrientes em uma selva nublada andina, Venezuela. Ecotropicos 15: 203-210. Wearn, O.R.; Reuman, D.C. & Ewers, R. M. 2012. Extinction Debt and
Windows of Conservation Opportunity in the Brazilian Amazon.
Science337 (6091): 228-232.
Williams-Linera, G. 1990. Vegetation structure and environmental con-ditions of forest edges in Panama. Journal of Ecology78: 356-373. Wolf, J.H.D. 2005. The response of epiphytes to anthropogenic disturbance
of pine-oak forests in the highlands of Chiapas, México. Forest Ecol-ogy and Management 212: 376-393