Horse grazing systems: understory biomass and plant biodiversity of a
Pinus
Antonio Rigueiro-Rodríguez, Rabia Mouhbi, José Javier Santiago-Freijanes, María del Pilar González-Hernández, María Rosa Mosquera-Losada*
ABSTRACT: Horse grazing systems may affect productivity and biodiversity of understory devel-oped under Pinus radiata D. Don silvopastoral systems, while acting as a tool to reduce the risk of fire. This study compared continuous and rotational grazing systems effect upon biomass, fractions of stem, sprouts, leaves and woody parts of Ulex europaeus L. and alpha (Species Rich-ness, Shannon-Wiener) and beta (Jaccard and Magurran) biodiversity for a period of four years in a P. radiata silvopastoral system. The experiment consisted of a randomized block design of two treatments (continuous and rotational grazing). Biomass, and species abundances were measured - biodiversity metrics were calculated based on these results for a two years of grazing and two years of post-grazing periods. Both continuous and rotational grazing systems were useful tools for reducing biomass and, therefore, fire risk. The rotational grazing system caused damage to the
U.europaeus shrub, limiting its recovery once grazing was stopped. However, the more intensive grazing of U. europaeus plants under rotational had a positive effect on both alpha and beta biodi-versity indexes due to the low capacity of food selection in the whole plot rather than continuous grazing systems. Biomass was not affected by the grazing system; however the rotational grazing system is more appropriate to reduce U. europaeus biomass and therefore forest fire risk at a long term and to enhance pasture biodiversity than the continuous grazing system.
Keywords: silvopastoral, species richness, livestock management, shrub biomass control, fires
Introduction
Livestock production plays an important role for in-creasing the value and multifunctional management of for-ests (Havstad et al., 2007; Rigueiro-Rodríguez et al., 2009). However, the use of domestic animals in extensively man-aged forest systems of Europe is not widely used due to the shortage of shepherds and economic changes driven mostly by subsidy. Galician endangered horse breed can be raised in forests with a clear understory dominance of Ulex europaeus L. (gorse). Gorse is the most important type of understory found in the forests of the North of Spain (Zas and Alonso, 2002) usually related to fire ignition and dis-persion of forest fires in Galicia, one of the most fired re-gions of Europe (Rigueiro-Rodríguez et al., 2009).
The effects of land-use change of Pinus radiata D.
Don afforested lands on production, C sequestration and biodiversity have been evaluated in the Atlantic re-gion of Europe (Mosquera-Losada et al., 2009 and 2010; Fernández- Núñez et al., 2010). Nevertheless, the effects
of grazing systems in mature P. radiata stands on these
variables have not been studied yet. Continuous and rotational grazing system management modifies herba-ceous plant productivity, depending on the stocking rate (Parsons and Penning, 1988; Briske et al., 2008); but few studies have been carried out comparing grazing systems in woody pastures. Continuous management is preferred by farmers because it is easy to manage and it has less establishment costs compared with the rotational. Pas-ture recovery during the rest periods under rotational management and animal higher selection capacity under
radiata
stand
Received January 07, 2010 Accepted November 28, 2011
Universidad de Santiago de Compostela/Escuela Politécnica Superior – Depto. de Produción Vegetal – Campus de Lugo – 27002 – Lugo – Spain.
*Corresponding author <mrosa.mosquera.losada@usc.es>
Edited by: Gerson Barreto Mourão
the continuous grazing system are important factors that would modify the productivity and biodiversity evolu-tion of gorse understory (Karki et al., 2000; Holechek et al., 2001; Dumont et al., 2007; Mayer et al., 2009)
This study aimed to evaluate how continuous and rotational horse grazing affect biomass, fractions (woody part, leaves, sprouts and stems) and biodiversity of the
gorse understory developed under a mature P. radiata
stand during four years.
Materials and Methods
This study was conducted in the San Breixo forest (Lugo, Spain, 43º09’ N, 7º48’ W, and 500 m a.s.l.) in the bioclimatic Atlantic region of Europe (EEA, 2003). The forest stand used in this study is privately owned by a forest community that signed a contract with the pub-lic administration, which performed the forest manage-ment. Before planting, grassland was the main land use of the area, but animals did not graze after planting until the present experiment was established. The initial tree
density was 833 trees ha–1, as it was artificially afforested
with P. radiata planted at a distance between trees of 3
and 4 m. No thinning or pruning had taken place since the stand was established in 1970. The total mean annual precipitation and mean annual temperature for the last 30 years are 1,300 mm and 12.2 ºC, respectively. Soil was classified as Umbrisol (FAO, 1998) with a sandy clay tex-ture (63 % sand, 20 % clay and 17 % silt). The initial water pH (1:2.5) was 4.51. The initial understory vegetation was
2000 2001 2002 2003 2004
JUL AUG SEP OCT NOV DEC JAN FEB MAR APR MA
Y
JUN JUL AUG SEP OCT NOV DEC JAN FEB MAR APR MA
Y
JUN JUL AUG SEP OCT NOV DEC
PVIII PIX
PI PII PIII PIV PV PVI PVII POST
GRAZING GRAZING
This study was conducted from Jul. 2000 to Dec. 2004 on 24 ha. The design was a randomized block with two treatments: continuous and rotational grazing. Each treatment had two replicates (blocks) of 6 ha each. Each replicate of the 6-ha rotational plots was sub-divided into four plots of 1.5 ha each. A global stoking rate of 0.33
animal ha–1 was used for continuous and rotational
graz-ing treatments; while 1.33 animal ha–1 represented the
instantaneous stocking rate in the rotational grazing sys-tem. Stocking rate was chosen based on previous study results (Rigueiro et al., 1999), which indicates that around one horse every 4 ha should be used in these systems to reduce fire risk. There were four water sources homoge-neously distributed per replica. No salt blocks were placed in the plots. The initial weight of the horses was approxi-mately 300 ± 20 kg. Horses began to graze in Jul. Jul. 2000 (Figure 1). Animals grazed in the whole plot (6 ha) in the continuous grazing treatment. In the rotational graz-ing treatments, horses had free access to one subplot (1.5 ha) per month; the other three subplots were not grazed within the same rotation. During the first grazing period, the animals had free access to one rotational subplot for two months, and the total rest period was approximately six months due to the initial high pasture biomass avail-ability. Grazing was ceased in Dec. Dec. 2002.
U. europaeus biomass production was estimated
by harvesting three randomly selected quadrats of 1 × 1 m, per treatment and replica, with a brushcutter at 2.5 cm every month from Jul. 2000 to Dec. 2002. Dur-ing the grazDur-ing period and in the rotational grazDur-ing sys-tem, samples were taken before the horses entered each subplot. Three exclusion cages (2 × 2 m) were used to quantify understory biomass production in continuous plots by harvesting an inner quadrat of 1 m × 1 m at 25 mm with a brushcutter. After sampling in the continu-ous grazing system, cages were randomly moved within each experimental unit. Samples were taken monthly at the same time as in the rotational grazing subplots. In the post-grazing period, two samplings were carried out in Sep. 2003 and Feb. 2004. All samples were labeled, transported and weighed in the laboratory, and plant biomass was classified by species to perform biodiver-sity analyses for each year except 2003. Additionally, 100
g of U. europaeus per sample of shrub material was taken
and separated into two fractions: stems (diameter > 5 mm) and sprouts (diameter < 5 mm). Each fraction was then split into woody part (sum of woody components in
the fractions above and below 5 mm) and leaf subfrac-tions (sum of leaf components in the fracsubfrac-tions above and below 5 mm). The fractions were oven-dried (48 h at 60 ºC) and weighed to determine the dry matter (DM) biomass production overall and for each fraction. Stem and sprout fraction percentages were calculated relative to the sum of the stem and sprout weight. Similarly leaf and woody part fractions were also estimated relative to the sum of the leaf and woody part fractions.
Plant biodiversity analyses were carried out using the relative proportion of each species based on weight. Species richness (SR) and the Shannon-Wiener Alpha bio-diversity indexes as well as Jaccard and Magurran Beta diversity indexes were determined as Magurran (2004). Species richness is the most used biodiversity index when vascular plants are evaluated. Shannon-Wiener al-pha biodiversity index is also a widely used alal-pha biodi-versity index, which takes into account the rare species in a more specific way than SR. Jaccard index allows us to evaluate the relative percentage of shared species between two situations (treatments but also initial and final period). Finally, Magurran beta index allows us to obtain an index which is increased when the number of species increases in two different situations (treatments or initial and final situation) but also when the species in the two different situations are different.
Biomass variables and diversities were grouped within each of the six grazing periods or rotation in order to compare the global stocking rates in both rotational and continuous grazing system during the grazing (2000-2002) and post-grazing (only 2004) periods, respectively. All variables were statistically analyzed with repeated measures ANOVA with the PROC GLM procedure (SAS Institute, 2001).
Results
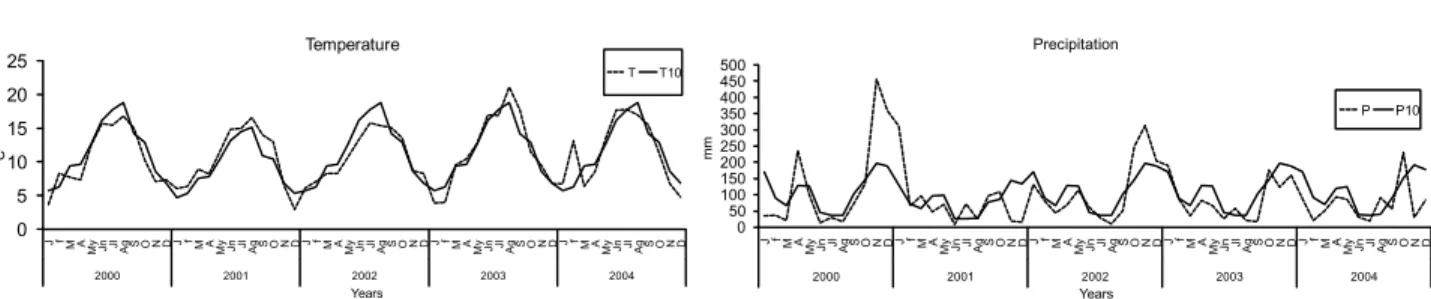
Monthly distributions of temperature and rainfall (Figure 2) during the study period showed a drought between Jul. and August and cold temperatures (below 6 ºC) in winter 2001, and as consequence understory
growth was reduced. Before grazing, the initial total U.
europaeus biomass production available for animals was
similar in the continuous and rotational treatments
(ap-proximately 2.5 t ha–1). Throughout the grazing period,
a reduction in total U. europaeus biomass production
was found in both continuous and rotational treatments
since the second grazing period. However, the average production at the end of the first grazing period (PI) was
statistically higher for rotational grazing (2.1 t ha–1) than
for continuous (1.3 t ha–1) grazing (p < 0.05), indicating
a reduction of U. europaeus biomass through continuous
grazing compared with rotational grazing. This differ-ence was not kept in the second grazing period although a similar tendency was found, but the differences
be-tween treatments were reduced to less than 0.1 t ha–1
during the following grazing periods (from PIII to PVII).
Total mean for U. europaeus biomass production of the
last two periods (PVIII and PIX), and therefore biomass
recovery, was higher (p < 0.05) in the continuous
graz-ing system (2.35 t ha–1) relative to the rotational grazing
system (1.7 t ha–1).
The percentage of UDM, which is considered a fire risk index, was highly variable throughout the graz-ing periods in the experiment, with a mean value of 57
% (Figure 3). UDM was affected by grazing treatment (p
< 0.05) but only in PII and PIII, when continuous graz-ing had a higher proportion of dry matter in the under-story relative to rotational grazing.
The percentage of stems and sprouts were affected
by the treatment and period interaction (p < 0.001), and
the amount of sprouts was independently and affected
by the treatments (p < 0.05) and period (p < 0.001)
fac-tors (Figure 4). U. europaeus stem biomass production
and the percentage of stems were higher in the rota-tional grazing system relative to the continuous grazing
system between PI and PIII (p < 0.05 for PI and PII; and
p < 0.01 for PIII) and between PII and PIV (p < 0.001
for PII and PIII; p < 0.05 for PIV), respectively. Sprout
biomass production was higher in the rotational than in
the continuous grazing system in the first period (p <
0.05). However, when the sprout percentage was taken into account, the continuous grazing system was found to have a higher percentage of this component than the
rotational grazing system in the second (p < 0.001), third
(p < 0.001) and fourth (p < 0.05) grazing periods
(Fig-ure 4). Production of the woody part component of U.
europaeus was not affected by the treatments (Figure 5).
However, when the production of leaves (period: p <
0.001; treatment: p < 0.05) and the percentage of the
total woody part and leaves fractions were taken into account, the period and treatment interaction was found
to affect these variables (p < 0.01). Biomass and the
per-centage of leaves were higher in the rotational system than in the continuous system for the two first grazing periods. There were no differences between treatments regarding the biomass or percentage of stems, sprouts (Figure 4) or woody parts (Figure 5) variables when the post-grazing period was considered. However, the recov-ery of sprout (Figure 4) and leaf (Figure 5) biomass were higher under continuous grazing one year after grazing was stopped.
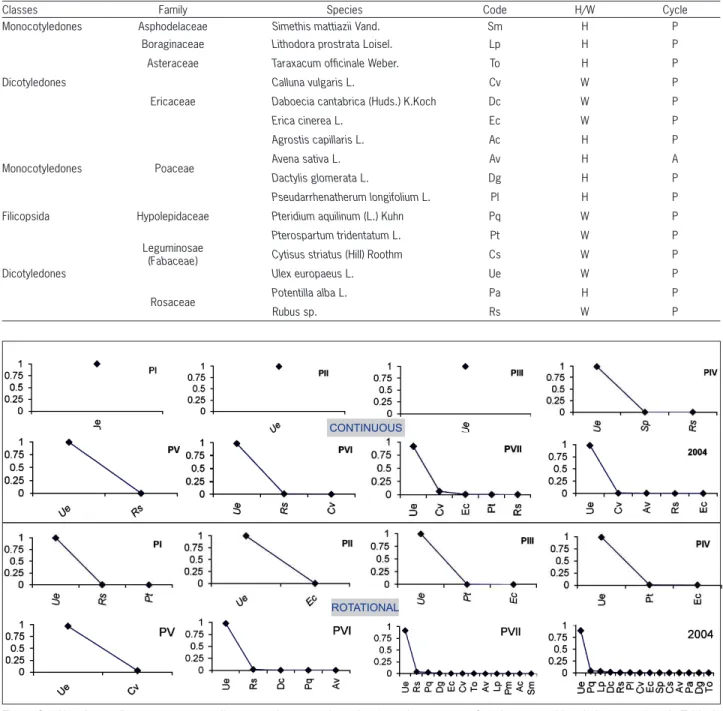
Throughout the four years of study, a total of 5 and 14 species were registered in plots where continu-ous and rotational grazing systems, respectively, were implemented (Table 1). The appearance rate of new spe-cies was progressive in both types of grazing systems, but was slower in the continuous grazing system. During all
periods, a clear dominance of U. europaeus, which was
al-ways above 96 % (Figure 6), was seen. Only species from the Leguminosae, Ericaceae, Asphodelaceae, Poaceae and Rosaceae families appeared in both treatments. Species from the Boraginaceae, Asteraceae and Hypolepidaceae families appeared only under the rotational grazing sys-tem. Species of the Ericaceae family began to appear later in the plots of the continuous grazing system than in the rotational grazing system. Only two Ericaceae species
Figure 2 – Monthly mean rainfall and temperature recorded in the experimental grazing system, where T is average monthly temperature , P is average monthly precipitation during the study (2000-2004), and T10 and P10 are average monthly temperature and precipitation, respectively, for the 30 years leading up to the start of the experiment (Ministry of the Environment; Stations (Parga-Guitiriz)).
Figure 3 – Biomass (t DM ha–1) and dry matter (% DM) of U. europaeus under continuous (C) and rotational (R) grazing systems. PI: period 1. PII: period 2. PIII: period 3. PIV: period 4. PV: period 5. PVI: period 6; PVII: period 7. PVIII: period 8. PIX: period 9. Different letters indicate differences between treatments within each period.
0 5 10 15 20 25
JfM A
MyJn JlAgS ON DJf MA
My JnJlAg SON DJ fMA
MyJnJl AgSO NDJ fM A
MyJn JlAgS OND JfM A My JnJlAg SON D
2000 2001 2002 2003 2004
ºC
Years Temperature
T T10
0 50 100 150 200 250 300 350 400 450 500
J f M A
My JnJl AgS O N D J f M A My JnJl Ag S O N D J f M AMy Jn JlAg S O N D J f M A My JnJlAg S O N D J f M A My JnJl AgS O N D
2000 2001 2002 2003 2004
mm
Years Precipitation
P P10
b
a a
b b
b a
a
0 25 50 75 100
0.0 0.5 1.0 1.5 2.0 2.5 3.0
Jul-Dec Jan-May Jun-Sep Oct-Jan Jan-Jun Jun-Sep Sep-Nov Sep Feb
PI PII PIII PIV PV PVI PVII PVIII PIX
2000 2001 2002 2003 2004
Biomass C Biomass R % UDM R % UDM C
Figure 4 – Biomass and percentage of the total percentage of stems and sprouts of U. europaeus under continuous and rotational grazing systems. PI: period 1. PII: period 2. PIII: period 3. PIV: period 4. PV: period 5. PVI: period 6; PVII: period 7. PVIII: period 8. PIX: period 9. Different letters indicate differences between treatments within each period.
Figure 5 – Biomass and proportion of woody part fractions and leaves of U. europaeus under continuous and rotational grazing systems. PI: period 1. PII: period 2. PIII: period 3. PIV: period 4. PV: period 5. PVI: period 6; PVII: period 7. PVIII: period 8. PIX: period 9. Different letters indicate differences between treatments within each period.
y n v
Rotational Continuous a
a
b
b
Leaves
b b
a a
Woody part
0 25 50 75 100
Jul-Dec Jan-May Jun-Sep Oct-Jan Jan-Jun Jun-Sep Sep-Nov Sep Feb
PI PII PIII PIV PV PVI PVII PVIII PIX
2000 2001 2002 2003 2004
Proportion
period 0
1 2
Jul-Dec Jan-May Jun-Sep Oct-Jan Jan-Jun Jun-Sep Sep-Nov Sep Feb
PI PII PIII PIV PV PVI PVII PVIII PIX
2000 2001 2002 2003 2004
Biomass
Leaves
period
0 1 2
Jul-Dec Jan-May Jun-Sep Oct-Jan Jan-Jun Jun-Sep Sep-Nov Sep Feb
PI PII PIII PIV PV PVI PVII PVIII PIX
2000 2001 2002 2003 2004
Biomass
Woodypart
period a
a a b
b b
t ha–1
Stems
0 1 2
Jul-Dec Jan-May Jun-Sep Oct-Jan Jan-Jun Jun-Sep Sep-Nov Sep Feb
PI PII PIII PIV PV PVI PVII PVIII PIX
2000 2001 2002 2003 2004
Biomass
period
a
b b
t ha–1
Sprout
a
0 1 2
Jul-Dec Jan-May Jun-Sep Oct-Jan Jan-Jun Jun-Sep Sep-Nov Sep Feb
PI PII PIII PIV PV PVI PVII PVIII PIX
2000 2001 2002 2003 2004
Biomass
period
b b b
a a
a Sprout
0 25 50 75 100
Jul-Dec Jan-May Jun-Sep Oct-Jan Jan-Jun Jun-Sep Sep-Nov Sep Feb
PI PII PIII PIV PV PVI PVII PVIII PIX
2000 2001 2002 2003 2004
Proportion
% Rotational
Continuous
period
a a a
b b
b
Stems
0 25 50 75 100
Jul-Dec Jan-May Jun-Sep Oct-Jan Jan-Jun Jun-Sep Sep-Nov Sep Feb
PI PII PIII PIV PV PVI PVII PVIII PIX
2000 2001 2002 2003 2004
Proportion
%
Figure 6 – Abundance diagrams corresponding to continuous and rotational grazing systems. Species name abbreviations are given in Table 1. PI: period 1. PII: period 2. PIII: period 3. PIV: period 4. PV: period 5. PVI: period 6; PVII: period 7. PVIII: period 8. PIX: period 9. Different letters indicate differences between treatments within each period.
ROTATIONAL CONTINUOUS
Table 1 – Species that appear during the seven periods of grazing and the two periods of post grazing in scrub of U. europaeus. W= woody species, H= herbaceous, Cycle: P = perennial species A= annual species. PI: period 1, PII: period 2, PIII: period 3, PIV: period 4, PV: period 5, PVI: period 6, PVII: period 7, PVIII: period 8, PIX: period 9.
Classes Family Species Code H/W Cycle
Monocotyledones Asphodelaceae Simethis mattiazii Vand. Sm H P
Dicotyledones
Boraginaceae Lithodora prostrata Loisel. Lp H P
Asteraceae Taraxacum officinale Weber. To H P
Ericaceae
Calluna vulgaris L. Cv W P
Daboecia cantabrica (Huds.) K.Koch Dc W P
Erica cinerea L. Ec W P
Monocotyledones Poaceae
Agrostis capillaris L. Ac H P
Avena sativa L. Av H A
Dactylis glomerata L. Dg H P
Pseudarrhenatherum longifolium L. Pl H P
Filicopsida Hypolepidaceae Pteridium aquilinum (L.) Kuhn Pq W P
Dicotyledones
Leguminosae (Fabaceae)
Pterospartum tridentatum L. Pt W P
Cytisus striatus (Hill) Roothm Cs W P
Ulex europaeus L. Ue W P
Rosaceae Potentilla alba L. Pa H P
Rubussp. Rs W P
were observed under continuous grazing: Calluna vulgaris
L. and Erica cinerea L. after PVI and PVII, respectively.
However, E. cinerea was recorded in PII, and C. vulgaris
and Daboecia cantabrica (Huds.) K.Koch. were recordedin
PV and PVI, respectively, under rotational grazing (Figure 6). Rotational grazing had a greater positive effect on spe-cies richness than continuous grazing.
Plant biodiversity indexes under both grazing sys-tems were modified throughout the four years of study; the changes in the plant biodiversity indexes were high-est under the rotational grazing system (Figure 7). Species richness (SR) was affected by the period and treatment
interaction (p < 0.0001). The Shannon-Wiener index
Figure 7 – Species Richness and Shannon-Wiener indexes determined for the continuous and rotational grazing. P: period 1. PII: period 2. PIII: period 3. PIV: period 4. PV: period 5. PVI: period 6. PVII: period 7. PIX: period 9. Different low case letters indicate differences between periods in the same treatment. Different capital letters indicate differences between treatments within the same period.
d d d cd d
bcd
ab a
d d d ab d c b
a 0
5 10 15
Jul-Dec Jan-May Jun-Sep Oct-Jan Jan-Jun Jun-Sep Sep-Nov Feb
PI PII PIII PIV PV PVI PVII PIX
Species Richness Rotational
Continuous
period
A
B
biodiversity described in terms of SR (4.88 in rotational
vs. 2.05 in continuous), and Shannon-Wiener index (0.19
in rotational vs. 0.07 in continuous) was higher under the rotational grazing system.
The Jaccard index indicated that under rotational grazing, only 13 % of species were shared between the initial (2000) and final periods (2004). Under continuous grazing, however, this percentage was increased to 25 % (Table 2). The low number of shared species between the initial and final period as well as the greater number of total species in the rotational grazing system compared with the continuous caused an increase of the Magurran index in the rotational grazing system. Beta biodiversity (Jaccard, and Magurran indexes) differences between the initial and the final grazing periods were higher (Ta-ble 3) than differences between the final grazing period and the post-grazing period for both systems. When we compared the Jaccard index between treatments within each rotation (Table 4), we found that treatments gener-ally share only 30 % of species. The Magurran index was increased at the end of the experiment (Table 4), mainly due to the increase of the number of species and the reduction of the proportion of shared species.
Discussion
The initial U. europaeus biomass in this study was
below that described by Rigueiro-Rodríguez et al. (2009)
in Pinus sylvestris L. and Pinus pinaster Ait. understories
(25-50 t DM ha–1). This is due to the high initial stand den-This is due to the high initial stand
den-sity in this study and the tree structure of P. radiata, which
intercepts a higher quantity of light, limiting understory development (Knowles et al., 1999; Rozados-Lorenzo et
al., 2007). On the other hand, the initial production of U.
europaeus (woody+leaf biomass) in our study is within
the optimal rank for offered herbaceous pasture for
graz-ing (between 2 and 4 t DM ha–1) for one harvest according
to Mosquera-Losada and González-Rodríguez (1998). This is indicative of the low more palatable leafly biomass
pro-duction for animal grazing of U. europaeus species under
P. radiata, which had a height of approximately 1 m
com-pared with 20-30 cm for herbaceous pasture. Moreover,
Table 2 – Jaccard Index (Ij) and Magurran index (β) determined by the initial situation (2000) and final situation (PIX) of the established plots where: a2000 = species present in the plots at the beginning of the experiment (2000 PI); b2004= species present at the end of the experiment (2004) and c = number of species present in both situations.
a 2000 b 2004 c Ij β
Continuous 1 5 1 0.25 3.75
Rotational 3 14 2 0.13 14.33
Table 3 – Jaccard Index (Ij) and Magurran index (β)) determined for both treatments (continuous and rotational gazing systems) during the grazing and post grazing periods where: a PI = species present in the first period of grazing time; b PVII = species present in the last period of grazing time for grazing period; a PVII = species present in the last period of grazing time; b 2004 = species present in the period of post grazing time; c = number of species present in both situations
Grazing
a PI b PVII c Ij β
Continuous 1 5 1 0.20 4.8
Rotational 3 12 2 0.15 12.70
Post grazing
a PVII b 2004 c Ij β
Continuous 5 5 4 0.66 3.33
Rotational 12 14 11 0.73 6.93
0.01). Under the continuous and rotational grazing sys-tems, SR and Shannon-Wiener indexes were increased from the first grazing period until the last grazing period (PVII). When the global period was taken into account,
Table 4 – Jaccard Index (Ij), Magurran index (β) and Complementarity index (CAB) determined for each period of the study where: acontinuous = species present in the continuous grazing systems; brotational = species present in the rotational grazing systems and c = number of species present in both systems.
Period a continuous b rotational c Ij β
PI 1 3 1 0.33 2.67
PII 1 2 1 0.50 1.50
PIII 1 3 1 0.33 2.67
PIV 3 3 1 0.20 4.8
PV 2 2 1 0.33 2.67
PVI 3 5 2 0.33 5.33
PVII 5 12 4 0.31 11.77
2004 5 14 4 0.26 13.93
b b
b b
b b
ab a
b b b b b ab
a
ab 0
0.2 0.4 0.6 0.8
Jul-Dec Jan-May Jun-Sep Oct-Jan Jan-Jun Jun-Sep Sep-Nov Feb
PI PII PIII PIV PV PVI PVII PIX
Shannon-Wiener Index
period
A
when sprout or leaf production is considered, the initial
biomass is actually ~1 t ha–1, which is very low for this
type of pasture and also reveals a very low potential for productive grazing systems.
U. europaeus biomass was higher in rotational than
in continuous grazing systems in the first grazing period due to the free access of animals in continuous grazing to the whole plot. However, total biomass was reduced in both treatments, particularly since the second and third grazing periods. Biomass reduction as a result of grazing by lignivorous animals has been recorded in many exper-iments and is considered an important tool for reducing fire risk in the Atlantic and Mediterranean biogeographic regions of Europe (Etienne et al., 1996; Scarascia-Mug-nozza et al., 2000; Moreira et al., 2001; Pardini et al., 2007; Rigueiro-Rodríguez et al., 2009). This is especially important in this experiment because gorse dry matter content above 60 % could cause a burn that would leave the area clear (Richardson and Hill, 1998) and therefore could be associated with high fire risk as in most of the periods of this study. Rotational grazing is not superior to continuous grazing for plant or animal production across numerous rangeland ecosystems world-wide, when her-baceous pastures are considered (Briske et al., 2008). A similar response was found in our experiment with a shrubby understory. Nevertheless, continuous grazing system is more advisable for forest farmers due to the lower cost of the establishment and the easier manage-ment than the rotational grazing system.
As a result of grazing and the consequent U.
euro-paeus biomass reduction, the production of sprouts and
stems was lowered in the two treatments studied after the initial grazing. However, this reduction occurred ear-lier for the more palatable fraction of sprout biomass than for stems and was more important in continuous than in rotational grazing systems. Rotational grazing
caused an instantaneous strong intake of U. europaeus
sprouts as animals can only graze in 1.5 ha every month and they are not allowed to choose the more palatable parts of the plants (Briske et al., 2008) in the rest peri-ods. Moreover, the rotational grazing system drastically
reduced the proportion of photosynthetic tissue of U.
eu-ropaeus, coinciding with other author´s findings
(Hodg-kinson and Bass Becking, 1978; Holechek et al., 2001), which is not able to recover despite the rest periods in the rotational grazing system. Furthermore, when the leaf and woody part fractions were taken into account, the rotational grazing system showed a higher propor-tion of leaves than continuous grazing system, due to the higher proportion of fractions with a diameter greater than 0.5, where most leaves are concentrated. Howev-er, the initial higher proportion of leaves did not allow
U. europaeus recovery in the rotational grazing system
in the subsequent grazing periods. When U. europaeus
grazing is not so intense (animals are allowed to graze and therefore to choose their food in the whole plot of 6
ha), as occurs in continuous grazing plots, U. europaeus
plants are able to respond by increasing the proportion
of sprouts to reach equilibrium between the fractions of stems and sprouts (Hodgkinson and Bass Becking, 1978).
Moreover, low damage caused to U. europaeus plants
un-der the continuous treatment during the grazing period
would explain the faster U. europaeus recovery, once
grazing ceased in the continuous grazing system com-pared with the rotational treatment.
All plant biodiversity indexes were generally low. Species richness was low when compared with perma-nent or sown grasslands (Calvo et al., 2002) in Galicia
(NW Spain), but similar to that found in P. radiata forests
once tree canopy cover is high enough to limit light in-puts into the understory (Mosquera-Losada et al., 2009). Moreover, a good diversity level is characterized by a Shannon-Wiener index between 3 and 4 (Magurran, 2004). In our study, this index did not exceed 0.75, which is also much lower than those described in Galicia sown (2.80) and permanent grasslands (2.94) as shown Calvo et al. (2002). The low value of the Shannon-Wiener in-dex is explained by the low number of species involved
and the high dominance of U. europaeus shown in the
abundance diagrams, probably due to the reduced light inputs to the understory.
The grazing strategies affected U. europaeus
un-derstory biodiversity differently. Approximately 87 % of species were registered in the rotational grazing system compared with 31 % in the continuous grazing system, being the proportion of shared species (Jaccard and Magurran indexes) between treatments also low.
Due to the reduced instantaneous grazing in the continuous system compared with the rotational
treat-ment, the dominance of U. europaeus persisted until
the third rotation under the continuous grazing system (Figure 3). This can be explained by the free access of animals to the whole plot, which increases their capacity for selection and, therefore, their ability to choose high
quality sprouts, causing less damage to the U. europaeus
plants. Under the continuous grazing system, the vegeta-tion developed is mainly composed of woodv species, better adapted to shading species. These species include
U. europaeus, Calluna spp., Erica spp., Rubus spp. and
Pterospartum tridentatum, which are very well adapted to
acidic and very poor acidic soils. When a selective dietary choice occurs, the animal interferes with the competitive advantage of the plant species by direct removal of the phytomass (Briske et al., 2008). If available, herbaceous species are usually palatable and preferred by the horses in this study area. These species can be more easily con-sumed by the animal before flowering in the continuous grazing system due to the lack of the rest period, thereby reducing dispersion.
Dumont et al. (2007) also found that herbivore presence did not affect the disappearance of species, but continuous grazing systems inhibited the regeneration of new species. On the other hand, rotational grazing produced an increase in most of the biodiversity
in-dexes due to the greater damage to U. europaeus plants,
horse ha–1) for a month diminished the density of U.
eu-ropaeus, allowing other woody and herbaceous species
growth during the rest periods. Species such as Daboecia
cantabrica and Rubus sp. appeared under the rotational
grazing system. According to Stokes et al. (2003), this is a transitory type of vegetation that is interposed between
communities of U. europaeus. There are also other
ani-mal activities, such as uneven distribution of liquid or solid excrement (Buttler et al., 2009), which has a direct influence on the fertility of the soil, that modify biodi-versity, allowing more nitrophilous herbaceous species to develop in these areas compared with less nitrop-hilous woody species. Within a shrub community the herbaceous layer showed higher diversity than the shrub
layer under P. radiata (Gómez et al., 2009).
Grazing systems can induce changes in the seasonal dynamics of the productivity and relative proportion of species (González-Hernández et al., 1998). Increased
dam-age to U. europaeus caused by the rotational grazing system
with a rest period allowed the establishment of herbaceous species with better qualities for animal production as well as enhanced biodiversity, as highlighted by the alpha and beta indexes calculated in this study. In addition to biomass reduction, rotational grazing systems relative to continuous grazing systems resulted in better pasture quality and bio-diversity. This trend continued two years after grazing was stopped. Moreover, SR was low during most of the grazing period, but more recovery could be observed under the ro-tational grazing system relative to the continuous grazing system by the end of the experiment. A rotational graz-ing system with horses should be promoted and preferred relative to continuous grazing systems for reducing fire risk and enhancing pasture quality and biodiversity when high stocking rates are applied.
Acknowledgements
This research was funded by the CICYT and by the Rural Development Galician Government (Xunta de Galicia).
References
Briske, D.D.; Derner, J.D.; Brown, J.R.; Fuhlendorf, S.D.; Tergue, W.R.; Havstad, K.M.; Gillen, R.L.; Ash, J.A.; Willms, W.D. 2008. Rotational grazing on rangelands: reconciliation of perception and experimental evidence. Ecology and Management 61: 3–17.
Buttler, A.; Koher, F.; Gillet, F. 2009. The Swiss Mountain Wooded
Pastures: Patterns and Prodesses. p. 377–390. In:
Rigueiro-Rodriguez, A.; McAdam, J.; Mosquera-Losada, M.R., eds. Agroforestry in Europe, Springer, Dordrecht, Netherlands. Calvo, I.R.; González, A.; Fraga, M.I. 2002. A survey of forage
quality in relation to floristic composition on lowlands pastures in NW of Galicia (NW Spain). In: Lowland and grasslands of Europe: utilization and development, FAO, Rome, Italy.
Available at http://www.fao.org/DOCREP/006/AD236E/
ad236e18.htm#bm44 [Accessed Jul. 7, 2011]
Dumont, B.; Farruggia, A.; Garel, P. 2007. Biodiversity of permanent pastures within livestock farming systems. Rencontres Recherches Ruminants 14: 17–24.
Etienne, M. 1996. Western European Silvopastoral Systems. INRA, Paris, France.
European Environment Agency [EEA]. 2003. Europe’s Environment: the Third Assessment. EEA, Copenhagen,
Denmark. Available at: http://www.eea.europa.eu/
publications/environmental_assessment_report_2003_10/ en/kiev_chapt_00.pdf [Accessed Dec. 12, 2003]
Fernández-Núñez, E.; Rigueiro-Rodríguez, A.; Mosquera-Losada, M.R. 2010. Carbon allocation dynamics one decade
after afforestation with Pinus radiata D. Don and Betula
alba L. under two stand densities in NW Spain. Ecological engineering 36: 876–890.
Food and Agriculture Organization [FAO]. 1998. World Referent Base for Soil Resources. FAO, Rome, Italy. (World
Soil ResourcesReports, 84).
Gómez, P.; Hahn, S.; San Martin, J. 2009. Structure and
floristic composition of a shrub under Pinus radiata D. Don
plantation in Central Chile. Gayana Botanica 66: 265–268. González Hernández, M.P.; Silva-Pando, F.J.; Casal Jiménez,
M. 1998. Production patterns of understory layers in several Galician (NW Spain) woodlands. Seasonality, net productivity and renewal rates. Forest Ecology and
Management109: 251–259.
Havstad, K.M.; Peters, D.P.C.; Skaggs, R.; Brown, J.; Bestelmeyer, B.; Fredrikson, E.; Herrick, J.; Wright, J. 2007. Ecological services to and from rangelands of the United States. Ecological Economics 64: 261–268.
Holechek, J.L.; Pieper, R.D.; Herbel, C.H. 2001. Range
Management: Principles and Practices. 4ed. Prentice Hall,
Upper Saddle River, USA.
Hodgkinson, K.C.; Bass Becking, H.G. 1978. Effect of defoliation on root growth of some arid zone perennial plants. Australian Journal of Agricultural Research 29: 31–42.
Karki, J.B.; Jhala, Y.V.; Kahanna, P.P. 2000. Grazing lawns in Terai grasslands, Royal Bardia National Park, Nepal. Biotropica 32: 423–429.
Knowles, R.L.; Horvath, G.C.; Carter, M.A.; Hawke, M.F. 1999. Developing a canopy closure model to predict overstorey/
understorey relationships in Pinus radiata silvopastoral
systems. Agroforestry Systems 43: 109–119.
Magurran, A.E. 2004. Measuring Biological Diversity. Blackwell, Oxford, UK.
Mayer, R.; Kaufmann, R.; Vorhauser, K.; Erschbamer, B. 2009. Effects of grazing exclusion on species composition in high-altitude grasslands of the Central Alps. Basic and Applied Ecology 10: 447–455.
Moreira, F.; Rego, F.C.; Ferreira P.G. 2001. Temporal (1958-1995) pattern of change in a cultural landscape of northwestern Portugal: implications for fire occurrence. Landscape Ecology 16: 557–567.
Mosquera-Losada, M.R.; Rodríguez-Barreira, S.; López-Díaz, M.L.; Fernández-Núñez, E.; Rigueiro-Rodríguez, A. 2009. Biodiversity and silvopastoral system use change in very acid soils. Agriculture, Ecosystems and Environment 131: 315–324.
Mosquera-Losada, M.R.; Castro, S.; Mosquera-Losada, M.R. 2010. Effect of dose and period of sewage sludge application
on soil, tree and pasture components in a Pinus radiata D. Don
silvopastoral system. Agroforestry Systems 79: 237–247. Pardini, A.; Natali, F.; Tallarico, R. 2007. Horse grazing in
firebreaks sown with Trifolium brachycalycinum (Katznl
& Morley) and Cynodon dactylon (L.) Pers. Agroforestry
Systems 70: 17–24.
Parsons, A.J.; Penning, P.D. 1988. The effect of the duration of regrowth on photosynthesis, leaf death and the average rate of growth in a rotationally grazed sward. Grass and Forage Science 43: 15–27.
Richardson, R.G.; Hill, R.L. 1998. The biology of Australian weeds. 34. Ulex europaeus L. Plant Protection Quartely 13: 46–58.
Rigueiro-Rodriguez, A.; McAdam, J.; Mosquera-Losada, M.R. 2009. Agroforestry in Europe. Springer, Dordrecht, Netherlands.
Rigueiro-Rodríguez, A.; Silva-Pando, J.; Rodríguez-Soalleiro,
R.; Castillón-Palomeque, P.A.; Álvarez-Álvarez, P.;
Mosquera-Losada, M.R.; Romero-Franco, R.; González-Hernández, M.P. 1999. Silvopastoral Systems Mannual. Escuela Politécnica Superior, Lugo, Spain (in Spanish). Rozados-Lorenzo, M.J.; González-Hernández, M.P.;
Silva-Pando, F.J. 2007. Pasture production under different tree species and densities in an Atlantic silvopastoral system. Agroforestry Systems 70: 53–62.
SAS Institute. 2001. SAS/Stat User´s Guide: Statistics. SAS Institute, Cary, NC, USA.
Scarascia-Mugnozza, G.; Oswald, H.; Piussi, P.; Radoglou, K. 2000. Forests of the Mediterranean region: gaps in knowledge and research needs. Forest Ecology and Management 132: 97–109.
Stokes, V.R.; Bullock, J.M.; Watkinson, A.R. 2003. Ulex gallii
Planch. and Ulex minor. Roth. Journal of Ecology 91: 1106–
1124.