PLANOSOL SOIL SAMPLE SIZE FOR COMPUTERIZED
TOMOGRAPHY MEASUREMENT OF PHYSICAL PARAMETERS
Alceu Pedrotti1*; Eloy Antonio Pauletto2; Silvio Crestana3; Paulo Estevão Cruvinel3; Carlos
Manoel Pedro Vaz3; João de Mendonça Naime3; Alvaro Macedo da Silva3
1
UFS - Depto. Engenharia Agronômica, Av. Mal. Rondon, s/n, Campus Universitário - 49100-000 - São Cristovão, SE - Brasil.
2
UFPel/FAEM - Depto. de Solos, C.P. 354 - 96001-970 - Pelotas, RS - Brasil.
3
Embrapa Instrumentação Agropecuária, C.P. 741 - 13560-970 - São Carlos, SP - Brasil. *Corresponding author <apedroti@ufs.br>
ABSTRACT: Computerized tomography (CT) is an important tool in Soil Science for noninvasive measurement of density and water content of soil samples. This work aims to describe the aspects of sample size adequacy for Planosol (Albaqualf) and to evaluate procedures for statistical analysis, using a CT scanner with a 241Am source. Density errors attributed to the equipment are 0.051 and 0.046 Mg m-3 for horizons A and B, respectively. The theoretical value for sample thickness for the Planosol, using this equipment, is 4.0 cm for the horizons A and B. The ideal thickness of samples is approximately 6.0 cm, being smaller for samples of the horizon B in relation to A. Alternatives for the improvement of the efficiency analysis and the reliability of the results obtained by CT are also discussed, and indicate good precision and adaptability of the application of this technology in Planosol (Albaqualf) studies.
Key words: lowland, albaqualf, bulk density, compaction, soil moisture
TAMANHO DE AMOSTRAS PARA A DETERMINAÇÃO
DE PARÂMETROS FÍSICOS EM PLANOSSOLO POR
TOMOGRAFIA COMPUTADORIZADA
RESUMO: A técnica da tomografia computadorizada (TC) permite medir a densidade e a umidade de amostras de solo, constituindo uma importante ferramenta na Ciência do Solo. Este trabalho tem como objetivos descrever os aspectos da adequação do tamanho de amostras de um Planossolo e os procedimentos de avaliação e estudos por análise estatística, empregando-se um minitomógrafo computadorizado de raios gama com fonte de 2 4 1Am. O valor do erro atribuído ao equipamento são 0,051 e 0,046 Mg m-3, respectivamente, para os horizontes A e B. O valor teórico da espessura da amostra do Planossolo para uso na técnica de TC com fonte de 2 4 1Am é, aproximadamente, 4,0 cm para os horizontes A e B. Já a espessura ideal de amostras é de aproximadamente 6,0 cm, sendo menor para amostras do horizonte B em relação ao A. Obteve-se boa precisão e adaptabilidade no emprego da TC para estudos de Planossolos.
Palavras-chave: várzea, Planossolo, densidade do solo, compactação, umidade do solo
INTRODUCTION
Lowland soils, varying from flat to smoothly un-dulated lands and originated under various conditions of draining deficiency (hydromorphic), are found in river and lagoon plains, extend along large areas of the State of Rio Grande do Sul, Brazil (approximately 5,676,100 ha), and represent 22.85% of the state. They are mainly found along the coastline, southeast hillside, central depression and wide plains (Pedrotti et al., 2001).
Lowland soils are significantly diverse regarding mineralogical and morphological characteristics and physical and chemical properties, as a result of hetero-geneities of original constituents and different levels of their hydromorphic state, requiring to be grouped in cat-egories of different limitations for agricultural uses
(Klamt et al., 1985). Among these soils, the Planosol class comprises the largest area (3,022,500 ha or 56% of the lowland soils), representing around 11% of the total state area (Pinto et al., 1999).
Computerized tomography (CT) does not disturb natural structure of the samples, having also good sensi-bility and high resolution. It enables the detection of het-erogeneities and extreme values of densities and water content, in a relatively fast, accurate and practical man-ner (Sposito & Reginato, 1992). The description of this technique, concerning principles, potentialities, opera-tional aspects, methodology, methods of image recon-struction and nuclear radiation can be found in Crestana (1985), Cruvinel (1987), Vaz (1989), Aylmore (1993), Chieppe Jr. (1993), Cássaro (1994), Naime (1994), Ander-son & Hopmans (1994), Biassussi (1996), Pedrotti (1996) e Pedrotti et al. (2001).
Because of interactions between the ionizing ra-diation (gamma or X-ray beams) and the soil sample con-stituents, absorption or attenuation occurs with part of the incident radiation, i.e., a number of photons passes through the sample without interacting, and another part totally or partially transfers energy to the sample. Lam-bert-Beer’s law relates I
o, the count of incident photons
per second (cps), I (cps) of the emergent beam, sample
thickness x (cm) to calculate the linear attenuation
coef-ficient - LAC or µl (cm -1):
⋅
=
I
I
x
l
0
ln
1
µ
(1)This coefficient depends on various parameters, and the most relevant are: the radiation energy (source feature), the atomic number of the sample components and the density of the absorber (soil). Once the energy of the radiation to be used and the material to be ana-lyzed are defined, ml is only a function of sample den-sity (ρ):
ρ
µ
µ
l=
m.
(2)w here µ m (cm
2 g-1) is the mass attenuation coefficient
(MAC). In the soil, µl depends on the relative
composi-tion of the different chemical elements within the sample and on the water present in the pores. Eq. 03 enables the calculation of both density and water content of a soil sample analyzed by attenuation:
θ
µ
ρ
µ
µ
l=
m−m.
+
m−l.
(3)where: µm-m (cm2 g-1) is the MAC of solid part (soil); µ m-l
(cm2 g-1) is the MAC of liquid (water) and θ (cm3 H 2O
cm-3 soil) is the volumetric water content of the sample
(Pedrotti, 1996).
CT can be used to measure density and porosity, which is related to the level of compaction and to the wa-ter content of soil samples of irregular shape. It is thus necessary to know the MAC for each soil type.
Measure-ment errors can also be minimized with the selection of adequate sample sizes. One of the factors that can be used to verify optimal conditions of the equipment is the evalu-ation of the standard devievalu-ation values of measurements obtained with the CT scanner (Ferraz & Mansell, 1979).
This work aims to establish procedures to opti-mize regular sample sizes and evaluate statistical proce-dures to utilize an X and gamma ray CT miniscanner, for density measurements of horizons A and B of a Planosol (Albaqualf).
MATERIAL AND METHODS
Soil characteristics
Soil samples were collected in an experiment of irrigated rice under different cultivation systems, managed since 1985, at Capão do Leão, RS, Brazil, where the con-trol plot (soil not submitted to farming) was chosen. The area is located in the physiografic region of the coastline of the south of the Rio Grande do Sul State (31°52’00’’S, 52°21’24’’W; average altitude 13.2 m). The soil consists of high activity clay, medium clay texture, a tipical low-land soil (Pedrotti et al., 2001) classified as a Hydromophic Eutrophic solodic Planosol (Pinto et al., 1999) corresponding to a solodic Planosol (Brasil, 1986) and an Albaqualf (Soil Survey Staff, 1990).
Twenty five structured samples were collected by the hydraulic structured soil sampling method – HSSSM (Pedrotti et al., 1994), using 100 mm diameter PVC pipes for depths 0-30 cm. Samples were sealed with paraffin and their spatial orientations or the field profile marked. Subsequently, they were cut in different heights to attend the objectives of the present work. Some disturbed samples were collected and used for the calibration of the CT miniscanner.
Description of the equipment
A first generation CT miniscanner was used, con-figured as a 241Am gamma ray source (energy 59.6 keV
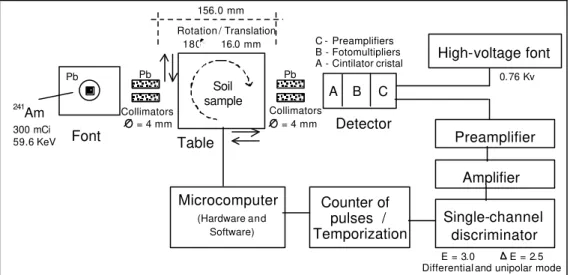
and activity 300 mCi); one NaI (Tl) scintillation crystal detector coupled to a photomultiplier and a preamplifier base; amplifier, discriminator, pulse counter and a com-puter. Resident softwares controlled the scanning mecha-nism, the nuclear counting system and mathematically reconstructed tomographic images (Cruvinel, 1987). Gamma-ray beams were obtained from two 20 mm-long collimators with 4 mm diameter orifices (Crestana, 1985; Cruvinel, 1987; Cruvinel et al., 1990; Crestana et al., 1992; and Vaz et al., 1992), one placed in front the source and the other in front of the detector (Figure 1).
reconstruc-tion program) and the linear attenuareconstruc-tion coefficients, mea-sured by direct transmission (20 replicates per each ma-terial), using aluminum, benzine, water and sieved samples of air-dried Planosol, froms horizons A and B (30 replicates per horizons).
Soil density values by CT
Scannings were performed for 11 hours in each selected cross section. Images were reconstructed (Cruvinel, 1987) from an attenuation data file. A tomo-graphic image represents a map of TU values calculated for each pixel (4 mm x 4mm). The image is formed by the linear assignment of TU to 16 grayscale values, white representing the highest attenuation value and black the lowest (air). An example of a tomographic image is shown in Figure 2.
Selection of the ideal sample size for a Planosol
The most signific ant sample dimension for CT scanning is the thickness x (cm) crossed by the radiation
beam. For each horizon of the Planosol, x was calculated
by equation (04) as proposed by Ferraz (1974) using the radiation energy of Americium (59.6 keV). Respectively,
µm-s e µm-l correspond to soil and water mass attenuation
coefficients (MAC), ρ to soil bulk density (Mg m-3) and θ to the volumetric water content (m3 m-3):
)
.
.
(
2
θ
µ
ρ
µ
m s m lx
−
−
+
=
(4)For the calculation, average density values were determined by volumetric rings and average soil water contents by the gravimetric method.
Sample size optimization was carried out with 5 samples of thicknesses 20, 40, 60, 80 and 100 mm. Im-age reconstruction provides a file of bidimensional maps of TU values. Soil density values were calculated
aver-aging 90 pixels (6 x15 pixels) for each sample. To find the proper sample size (which leads to minimum error in parameter evaluation), the standard deviation values, co-efficients of variation and errors were applied in associ-ated form, for each thickness, each horizon, according to Ferraz (1974) and Miyazaki et al. (1991). The optimum thickness band was selected by the minimum values of the set of parameters. The product: µm-s . x ≤ 1 was also used in the evaluation, because it is an indication of the ideal condition (Ferraz, 1974).
RESULTS AND DISCUSSION
To optimize sample size allied to the condition of minimum error, it is necessary to obtain precise den-sity values, and to have accurate tomographic measure-ments of density and moisture, values of MAC have also to be precisely determined. Table 1 shows the average MAC (µm) values for horizons A and B of the Planosol
and for other materials, with their respective standard de-viations and the theoretical value for water. Water, a ho-mogeneous medium, presented the lowest standard devia-tion values, and that indicates the good precision of the measurements. These results are function of the collima-tion and count rates, close to the ideal condicollima-tion reported by Appoloni & Cesareo (1994).
According to Ferraz & Mansell (1979), horizons rich in Fe and Ca compounds and mineral clays contrib-ute to raise MAC values. These authors reported that val-ues lower than those presented in their work, point to bad collimation and detection procedures. In addition, high standard deviations may indicate not only heterogeneity of samples, but also insufficient number of measurements or low intensity of radiation beams. Further information on the influence of soil chemical composition on MAC val-ues can be found in Reginato & Van Bavel (1964). Soil
Figure 1 - Block diagram of the X and gamma-ray CT miniscanner. 241
Am
Font Table
Collimators Collimators
Detector
Pb Pb Pb
Microcomputer
High-voltage font
Counter of pulses / Temporization
Single-channel discriminator
Amplifier Preamplifier
Rotation / Translation
E = 3.0 E = 2.5
Differential and unipolar mode 0.76 Kv
= 4 mm
180 16.0 mm
= 4 mm 300 mCi
59.6 KeV
A - Cintilator cristal C - Preamplifiers B - Fotomultipliers 156.0 mm
(Hardware and Software)
A B C
heterogeneity, particle size distribution (texture) and com-position itself may also constitute error sources. In these cases, a great number of measurements becomes necessary. The theoretical value of LAC for most soils is 0.25 cm-1 (Ferraz, 1974). To obtain preliminarily values
of LAC, a 7.5 cm thickness was assumed to be crossed by the energy beam; LAC values obtained for horizons A and B were relatively close to the ideal (Table 1). When compared to theoretical values, it can also be seen that the ideal thickness is close to the attained value.
The calibration of the miniscanner was made through the linear regression between LAC and TU for different materials (Table 1 and Figure 3), according to Crestana et al. (1986; 1996):
TU = 5.34(±4.38) + 986.16(±0.01) . µl (05)
Admitting homogeneous soil chemical composi-tion and including the contribucomposi-tion of water content, we have:
TU = 986.16 . (µm - s . r + µm - l . θ) (06)
In equation (06), TU is the average value of each scanning line (average of 5 pixels or columns), taken from the tomographic map generated for each sample. To mini-mize variations of TU values, an option is the increase of the number of columns (pixels in line). However, when showing distinct regions of the central column is desired the whole tomographic map must be observed to get dis-crepant values and variables that may reveal heterogene-ities.
With the results of MAC and the calibration line the following equations were obtained to calculate den-sities of the Planosol:
Horizon A: ρs = [(TU / 986.2)-(0.20 . θ)] / 0.27 (07)
Horizon B: ρs = [(TU / 986.2)-(0.20 . θ)] / 0.30 (08)
Sample size optimization
The theoretical, ideal sample thickness was esti-mated to be 4.4 and 3.8 cm, respectively for horizons A and B (Eq. 04). These values come near to those found by Ferraz & Mansell (1979) at 60 keV, and point the im-portance of the determination of the ideal sample size, previously and approximately admitted to be 7,5 cm, to minimize errors. The good results obtained are attributed to the high beam intensity (20.200 photons/minute), higher than 10,000 photons/minute, recommended by Ferraz (1974), and a consequence of the choice of an ad-equate source activity and collimation geometry between source and detector (156 mm), always recommended to be as close as possible.
The ideal thickness of soil samples not only de-pends on water content and bulk density, but mainly on their mass attenuation coefficients, which depend on to-tal porosity and on soil chemical composition (Ferraz, 1974). Table 2 shows soil bulk density values obtained at positions between 2 and 10 cm along the height of the sample. The ideal thickness band was selected within the range of 4 to 6 cm, by the combination of the lowest stan-dard deviation values, coefficients of variation and per-centage error relative to five chosen sample sizes (Table
Figure 3 - Linear correlation between tomographic units and the linear attenuation coefficients.
100 200 300 400 500 600 700 800
100 200 300 400 500 600 700 800
UT = 5.34 (± 4. 38) + 986.16 (± 0.01) . Linear Attenuation Coefficient
R2 = 0.9998 - SD = 5.45 - N = 5 - P = 3. 15 X 10-6
Planosol - Horiz. A Planosol - Horiz. B
Water
Benzin
Aluminum
Tomographics Units (UT)
Linear Attenuation Coefficient x 1000 (cm-1)
Figure 2 - Tomographic map showing the TU variations in a sample of Planossol.
Material Mass attenuation coefficient cm2 g-1
Distilled water 0.1999 (± 0.002)a Water - Theoretical value
(Ferraz, 1974) 0.2052
Aluminum 0.7506 (± 0.030)b
Benzine 0.1250 (± 0.002)b
Planossol - horizon A 0.2670 (± 0.009)b Planossol - horizon B 0.2974 (± 0.010)b Table 1 - Average values of MACs obtained for different
materials, measured with CT miniscanner, at 59.6 keV.
2), (Ferraz, 1974). Results agree with various authors cited by Ferraz (1974) and Appoloni & Cesareo (1994), assuming the criterion “µ1 . x” always ≤ 1. This product determines the magnitude of the incident beam besides influencing the contrast quality of the resulting image. The acceptable value of the product µ1 . x is between 1 and 6, corresponding, respectively, to attenuation between 65.0 and 99.7% (Appoloni & Cesareo, 1994).
When analyzing bulk density, water content and porosity of horizons A and B of a Planosol, through CT (Table 2) recommended sample thickness show come near 6.0 cm. This value is consistent, because it is within the interval obtained with Eq. 04. The ideal thickness of ho-rizon B should be somewhat smaller than hoho-rizon A, since the subsurface horizon presents higher values for LAC, meaning a higher beam attenuation as compared to hori-zon A. This difference results from the chemical and tex-tural composition of the horizons. As a consequence, it can be assured that for horizon B error values are higher as compared to horizon A, even for the same thickness crossed by the beam. Therefore, it is very important to define the optimal thickness, especially for the low en-ergy of the 241Am radiation, according to Ferraz &
Mansell (1979).
The optimal thickness values obtained for the Pl-anosol samples are very close to those found by Miyazaki et al. (1991), for sandy soils of Japan, also using a 241Am
source and a similar equipment configuration, and by Ferraz & Mansell (1979) for Fe- and organic matter-rich soils of São Paulo State, Brazil. For these soils, the authors recommend maximum error values similar to those found herein. Considering the 60 keV energy of 241Am and the
optimal condition for thickness between 4 and 8 cm for most Brazilian soils, the first step to reduce errors in the measurement of bulk density and moisture by CT, is the precise and accurate determination of MACs.
CONCLUSIONS
The ideal sample thickness for physical param-eters analysis of a Planosol for CT measurements, using the energy of 60 keV (241Am), is approximately 6.0 cm,
20% lower for horizon B in comparison to A. For best results, the free beam count should be over 10,000 pho-tons/second. Furthermore, source and detector should be well collimated, parallel to the cross section plane and the detector as close as possible to the source.
ACKNOWLEDGMENTS
To staff of the Laboratory of Soil Physics and from Soil Department of FAEM-UFPel, Embrapa Clima Temperado (Capão do Leão-RS), and Embrapa Instrumentação Agropecuária (São Carlos-SP). Also for the financial support of DS-FAEM, FAU, UFPel, FAPESP (projects 9013773-7 and 12.094.093.00).
REFERENCES
ANDERSON, S.H.; HOPMANS, J.W. (Ed.) Tomography of soil-water-root process. Madison: SSSA, 1994. 148p.
APPOLONI, C.R.; CESAREO, R. Microscanning and microtomography with X-ray tubes. Roma: CISB-Universitá degli Studi di Roma “La
Sapienza”, 1994. 84p. (RAP, 04.94)
AYLMORE, L.A.G. Use of computer-assisted tomography in studyng water movement around plant roots. Advances in Agronomy, v.49, p.1-53, 1993.
BIASSUSSI, M. Estudo da expansão e contração de um vertissolo através da tomografia computadorizada simultânea. Pelotas: UFPel/FAEM, 1996. (Dissertação - Mestrado)
BRASIL. Ministério das Minas e Energia. Projeto RADAM Brasil: Folha SH.22 Porto Alegre e parte das folhas SH.21 Uruguaiana e SI.22 Lagoa Mirim. Rio de Janeiro, 1986. (Levantamento de Recursos Naturais, 33). CÁSSARO, F.M. Tomografia de dupla energia para caracterização físico-hídrica de meios porosos deformáveis sob diferentes graus de hidratação. São Carlos: USP/IFSC, 1994. (Dissertação - Mestrado)
CHIEPPE Jr., J. B. Estudo e comparação de diferentes métodos de determinação da umidade do solo em laboratório. Botucatu: UNESP/ FCA, 1993. (Dissertação -Mestrado)
CRESTANA, S. A tomografia computadorizada como um novo método para estudos da física da água no solo. São Carlos: USP/IFQSC, 1985. (Tese - Doutorado)
CRESTANA, S. Noninvasive measurements. In: SPOSITO, G.; REGINATO, R.J. Opportunities in basic soil science research. Madison: SSSA, 1992. p.83-85.
CREST ANA, S.; CESAREO, R.; MASCARENHAS, S. Using a computed tomograph miniscanner in soil science. Soil Science, v.142, p.56-61, 1986.
CRESTANA, S.; CRUVINEL, P.E.; VAZ, C.M.P.; CESAREO, R.; MASCARENHAS; S.; REICHARDT, K. Calibração e uso de um uomógrafo computadorizado em ciência do solo. Revista Brasileira de Ciência do Solo, v.16, p.161-167, 1992.
CRESTANA, S.; CRUVINEL, P.E.; MASCARENHAS, S.; BISCEGLI, C.I.; MARTIN NETO, L.M.; COLNAGO, L.A. (Ed.) Instrumentação agropecuária: contribuições no limiar do novo século. Brasília: EMBRAPA, SPI, 1996. 291p.
CRUVINEL, P.E. Minitomógrafo de raio X e raio gama computadorizado para aplicações multidisciplinares. Campinas: UNICAMP/FEE, 1987. 325p. (Tese - Doutorado)
Table 2 - Values of average density, standard deviation and variation coefficient of different thickness of Planossol samples, in horizons A and B (average of 5 repetitions).
Horizon thicknessSample Density DeviationStandard coefficientVariation
A
cm Mg m-3 %
2.0 1.69 ± 0.084 4.97
4.0 1.58 ± 0.039 2.47
6.0 1.62 ± 0.031 1.91
8.0 1.65 ± 0.052 3.15
10.0 1.67 ± 0.191 11.44
B
2.0 1.61 ± 0.073 4.53
4.0 1.68 ± 0.042 2.50
6.0 1.70 ± 0.054 3.18
8.0 1.75 ± 0.060 3.43
CRUVINEL, P.E.; CESARIO, R.; CRESTANA, S.; MASCARENHAS, S. X and g ray computerized minitomograph scanner for soil science. IEEE Transactions on Instrumentation and Measurement, v.39, p.745-750,
1990.
FERRAZ, E.S.B. Deterninação simultânea da densidade e umidade de solos por atenuação de raios gama do 241Cs e 241Am. Piracicaba: USP/ESALQ,
1974. 120p. (Tese - Livre Docência)
FERRAZ, E.S.B.; MANSELL, R.S. Determining water content and bulk densiy of soil by gamma ray attenuation methods. Gainesville:
University of Florida, 1979. 51p. (Technical Bulletin, 807).
KLAMT, E.; KAMPF, N.; SCHNEIDER, P. Solos de várzea no estado do Rio Grande do Sul. Porto Alegre: Universidade Federal do Rio Grande do Sul, Faculdade de Agronomia, Depto. de Solos, 1985. 43p. (Boletim Técnico de Solos, 4).
MIYAZAKI, T.; KASUBUCHI, T.; HASEGAWA, S. A statistical approach for prediting accuracies of soil properties measured by single, double and dual gamma beams. Journal of Soil Science, v.42, p.127-137, 1991. NAIME, J.M. Projeto e construção de um tomógrafo portátil para estudos de ciência do solo e plantas, em campo. São Carlos: USP/EESC, 1994. 87p. (Dissertação - Mestrado)
PEDROTTI, A. Avaliação da compactação de um Planossolo submetido a diferentes sistemas de cultivo. Pelotas: UFPel/FAEM, 1996. 96p. (Dissertação - Mestrado)
PEDROTTI, A.; PAULETTO, E.A.; BIASSUSI, M.; TURATTI, A.L. Método de amostragem indeformada para diferentes estudos na ciência do solo. In: Reunião Brasileira de Manejo e Conservação do Solo e da Água, 10. Florianópolis, 1994. Resumos. Florianópolis: SBCS, 1994.
p.326-327. Received May 27, 2002Accepted August 17, 2003
PEDROTTI, A.; PAULETTO, E.A.; GOMES, A.S.; TURATTI, A.L.; CRESTANA, S. Sistemas de cultivo de arroz irrigado e a compactação de um Planossolo. Pesquisa Agropecuária Brasileira v.36, p.709-715,
2001.
PINTO, L.F.S.; PAULETTO, E.A.; GOMES, A.S.; SOUSA, R.O. Caracterização de solos de várzea. In: GOMES, A.S.; PAULETTO, E.A. (Ed.) Manejo de solo e da água em areas de várzea. Pelotas: Embrapa Clima Temperado, 1999. p.11-36.
REGINATO, R.J.; Van BAVEL, C.H.M. Soil water measurement with gamma attenuation. Soil Science Society of America Proceedings, v.28, p.721-724, 1964
SOIL SURVEY STAFF. Keys to soil taxonomy. 4.ed. Blacksburg, 1990. 422p. (SMSS Technical Monograph, 6).
SPOSITO, G.; REGINATO, R.J. Opportunities in basic soil science research. Madison: SSSA. 1992. 109p.
VAZ, C.M.P. Tomografia computadorizada aplicada a estudos de compactação de solos. Piracicaba: USP/ESALQ, 1989. 110p. (Dissertação - Mestrado)