www.biogeosciences.net/14/467/2017/ doi:10.5194/bg-14-467-2017
© Author(s) 2017. CC Attribution 3.0 License.
Soil methane oxidation in both dry and wet temperate eucalypt
forests shows a near-identical relationship with soil air-filled porosity
Benedikt J. Fest1, Nina Hinko-Najera2, Tim Wardlaw3, David W. T. Griffith4, Stephen J. Livesley1, and Stefan K. Arndt1
1School of Ecosystem and Forest Sciences, The University of Melbourne, Richmond, 3121 Victoria, Australia 2School of Ecosystem and Forest Sciences, The University of Melbourne, Creswick, 3363 Victoria, Australia 3Forest Management Services Branch, Forestry Tasmania, Hobart, 7000 Tasmania, Australia
4School of Chemistry, University of Wollongong, Wollongong, 2522 New South Wales, Australia
Correspondence to:Benedikt J. Fest ([email protected])
Received: 5 May 2016 – Published in Biogeosciences Discuss.: 28 June 2016
Revised: 16 November 2016 – Accepted: 17 November 2016 – Published: 27 January 2017
Abstract.Well-drained, aerated soils are important sinks for atmospheric methane (CH4) via the process of CH4
oxi-dation by methane-oxidising bacteria (MOB). This terres-trial CH4 sink may contribute towards climate change
mit-igation, but the impact of changing soil moisture and tem-perature regimes on CH4 uptake is not well understood in
all ecosystems. Soils in temperate forest ecosystems are the greatest terrestrial CH4 sink globally. Under predicted
cli-mate change scenarios, temperate eucalypt forests in south-eastern Australia are predicted to experience rapid and ex-treme changes in rainfall patterns, temperatures and wild fires. To investigate the influence of environmental drivers on seasonal and inter-annual variation of soil–atmosphere CH4exchange, we measured soil–atmosphere CH4exchange
at high-temporal resolution (<2 h) in a dry temperate eu-calypt forest in Victoria (Wombat State Forest, precipita-tion 870 mm yr−1) and in a wet temperature eucalypt for-est in Tasmania (Warra Long-Term Ecological Research site, 1700 mm yr−1). Both forest soil systems were con-tinuous CH4 sinks of −1.79 kg CH4ha−1yr−1 in Victoria
and−3.83 kg CH4ha−1yr−1in Tasmania. Soil CH4uptake
showed substantial temporal variation and was strongly con-trolled by soil moisture at both forest sites. Soil CH4uptake
increased when soil moisture decreased and this relationship explained up to 90 % of the temporal variability. Further-more, the relationship between soil moisture and soil CH4
flux was near-identical at both forest sites when soil moisture was expressed as soil air-filled porosity (AFP). Soil temper-ature only had a minor influence on soil CH4uptake. Soil
ni-trogen concentrations were generally low and fluctuations in nitrogen availability did not influence soil CH4uptake at
ei-ther forest site. Our data suggest that soil MOB activity in the two forests was similar and that differences in soil CH4
ex-change between the two forests were related to differences in soil moisture and thereby soil gas diffusivity. The differences between forest sites and the variation in soil CH4exchange
over time could be explained by soil AFP as an indicator of soil moisture status.
1 Introduction
Methane (CH4)has a relatively low atmospheric
concentra-tion of approximately 1.8 ppm and is, after carbon dioxide (CO2, approx. 402 ppm), the second most abundant
green-house gas in the atmosphere (IPCC, 2013). Although its atmospheric concentration is 2 orders of magnitude lower than that of CO2, CH4accounts for approximately 18 % of
the currently observed global temperature increase (IPCC, 2013). In addition, CH4 contributes to 32 % of the current
radiative forcing created by the major greenhouse gases as it has a 25 times greater global warming potential compared to CO2(IPCC, 2013).
Forest soils are the most important land-based sink for CH4via the activity of methane-oxidising bacteria (MOB) in
well-drained, aerobic soils. Soils in temperate forest ecosys-tems play an important role in global CH4exchange between
30–50 % of the soil-based CH4sink worldwide (Ojima et al.,
1993; Dutaur and Verchot, 2007).
Major environmental factors controlling and influencing CH4uptake rates by forest soils are soil diffusivity, soil
struc-ture, soil moisstruc-ture, soil temperature and soil nitrogen status (Ball et al., 1997; Smith et al., 2003; von Fischer and Hedin, 2007; Butterbach-Bahl et al., 2002; Del Grosso et al., 2000). The main factor regulating the CH4 uptake capacity of
soils is the diffusion rate of CH4through the soil and hence
the substrate availability of CH4to the MOB across the soil
profile. CH4uptake rates have been shown to decrease with
increasing soil moisture as a result of decreasing soil gas dif-fusion rates across different ecosystems (Castro et al., 1995; Khalil and Baggs, 2005; Ball et al., 1997). Therefore, CH4
uptake is thought to be most rapid in coarse-textured forest soils with a well-developed structure and an organic surface layer that does not inhibit gas diffusion (Boeckx et al., 1997; Del Grosso et al., 2000; Smith et al., 2000). Soil bulk den-sity can also correlate with soil CH4uptake across different
ecosystems (Smith et al., 2003, 2000), which is not unex-pected since soil air-filled porosity, which is directly linked to soil diffusivity, is a function of soil bulk density and volu-metric water content.
Soil CH4 uptake at atmospheric levels generally shows
limited temperature dependency and reportedQ10values are
generally low with an average around 1.4 (Crill, 1991; Born et al., 1990; Smith et al., 2000). Another factor that influ-ences the CH4uptake capacity of soils is soil N status,
es-pecially the availability of ammonium (NH+4) (Butterbach-Bahl et al., 1998; Sitaula et al., 1995). Increasing soil N avail-ability through organic and inorganic fertiliser additions and through biological N fixation can decrease CH4uptake rates
(Niklaus et al., 2006; Dick et al., 2006).
Temperate eucalypt (broadleaved evergreen) forests in south-eastern Australia cover around 26 million hectares (Montreal Process Implementation Group for Australia and National Forest Inventory Steering Committee, 2013) and provide a large range of ecosystem services. However, de-spite a growing interest in soil CH4uptake in the last decade
there have been very few studies investigating CH4oxidation
in soils of natural Australian forest and woodland ecosys-tems, with only a relatively small number of published stud-ies on CH4uptake in temperate forest systems (Livesley et
al., 2009; Meyer et al., 1997; Fest, 2013; Fest et al., 2009, 2015a, b), tropical forest systems (Kiese et al., 2003) and sa-vanna ecosystems (Livesley et al., 2011). Moreover, there is currently no model that accurately predicts the size of the ter-restrial CH4sink in Australia or determines how the strength
of this sink will change over time. Data describing CH4
emis-sion and oxidation from Australian soils is still patchy and often lacking for important landscapes such as tropical sa-vannas, the semi-arid and arid zones and woody ecosystems (Dalal et al., 2008).
Compared to most European and North American temper-ate forest systems, forest soils in the Australian tempertemper-ate
region are generally highly weathered and very low in nu-trients and atmospheric nitrogen deposition is very low. Fur-thermore most of the temperate forest area in Australia does not experience periods of snow cover or below zero soil tem-peratures. It is therefore questionable as to whether informa-tion gathered on spatial and temporal variability of soil CH4
exchange in Northern Hemisphere temperate forest soils are transferable to those in Australia. Furthermore, it is not clear if processes that explain soil CH4 uptake in deciduous
for-est systems or coniferous forfor-est systems worldwide can be directly transferred to the eucalypt or acacia forest systems that dominate the forests and woodlands of Australia. Most estimates of soil CH4exchange in Australian forest systems
were based on infrequent (weekly–monthly) or campaign-based measurements (of 1–2 weeks), which may not fully reflect the temporal dynamics and range of environmental conditions.
This study investigates soil–atmosphere CH4 exchange
using automated chamber systems measuring at a high-temporal resolution over 1–2 years in two temperate
Euca-lyptus obliqua-dominated forest sites with contrasting annual
precipitation. The main objectives of this study were to as-sess the magnitude and temporal variation in CH4exchange
between the soil and atmosphere in temperate evergreen eu-calypt forest systems and to investigate the primary biophys-ical processes that control the seasonality in soil CH4flux.
2 Material and methods 2.1 Site description
The Tasmanian site is in the Warra Long-Term Ecological Research (LTER) site approximately 60 km west-southwest of Hobart, Tasmania, Australia (AU-WRR: 43◦5′36.78′′S,
146◦38′42.65′′E). The site is dominated byEucalyptus obli-qua(L’Her.) with an overstorey height of around 53 m and a basal area of 54 m2ha−1. The understorey is mainly com-prised ofAcacia melanoxylon(R. Br.),Nothofagus
cunning-hamii(Hook.) Oerst. andDicksonia antarctica(Labill.). The
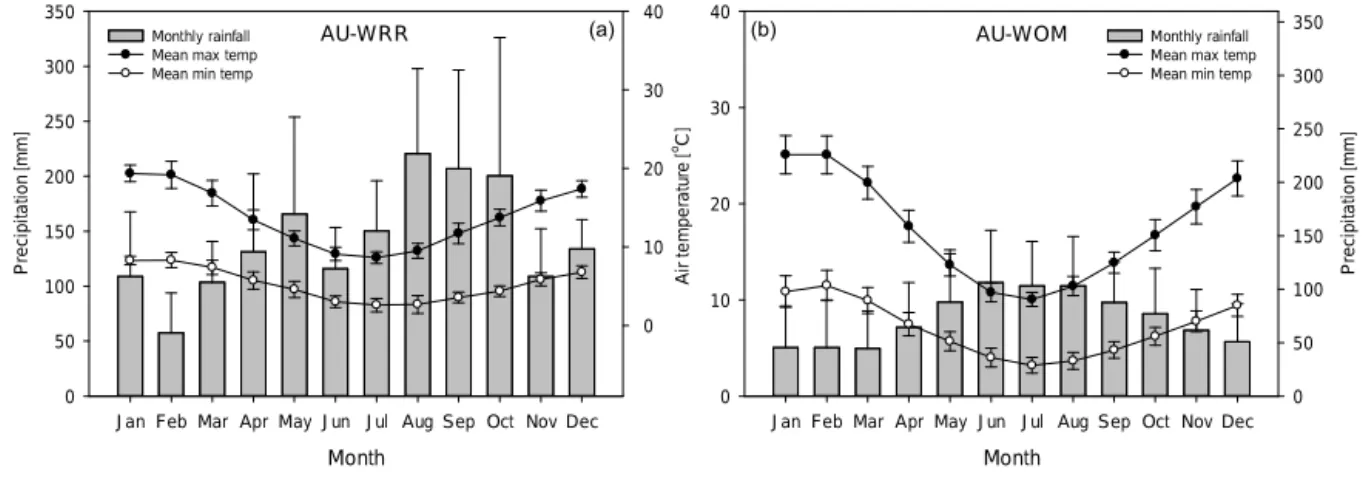
climate of AU-WRR is classified as temperate cool wet (Dunlop and Brown, 2008) with cold and wet winters and warm and wet summers. The average rainfall is approxi-mately 1700 mm yr−1 (Fig. 1a) with mean monthly maxi-mum temperatures of 19.3◦C in January (summer) and mean
minimum temperatures of 2.5◦C in July (winter). The soils
at Warra are derived from Permian siltstone with a surface texture of silty loam to silty clay loam and are classified as Kurosolic Redoxic Hydrosol (McIntosh, 2012). The average bulk density in the top 5 cm of mineral soil is 0.67 g cm−3
and soil porosity is 0.74 cm3cm−3.
The Victorian forest site is in the Wombat State Forest, approximately 120 km west of Melbourne, Australia (AU-WOM: 37◦25′20.83′′S, 144◦5′38.63′′E). AU-WOM is
AU-WRR
Month
Jan Feb Mar Apr May Jun Jul Aug Sep Oct Nov Dec
P
re
c
ip
it
a
ti
o
n
[
m
m
]
0 50 100 150 200 250 300 350
0 10 20 30 40
Monthly rainfall Mean max temp Mean min temp
AU-WOM
Month
Jan Feb Mar Apr May Jun Jul Aug Sep Oct Nov Dec
P
re
c
ip
it
a
ti
o
n
[
m
m
]
0 50 100 150 200 250 300 350
A
ir
te
m
p
e
ra
tu
re
[
C
]
o
0 10 20 30 40
Monthly rainfall Mean max temp Mean min temp
(a) (b)
Figure 1.Climate at the investigated sites of(a)Warra Long-Term Ecological Research in Tasmania (AU-WRR) and(b)Wombat State Forest in Victoria (AU-WOM). Black circles represent monthly mean maximum air temperatures. White circles represent monthly mean minimum air temperatures. Grey bars represent monthly precipitation. Error bars represent±1 SD. Data source: Bureau of Meteorology Australia, http://www.bom.gov.au (station numbers 097024 for AU-WRR and 088020 for AU-WOM).
Deane & Maiden) and Eucalyptus radiata(Sieber ex DC.) trees of approximately 20–25 m in height and 37 m2ha−1 of stem basal area. The climate is classified as Mediter-ranean to cool temperate, with warm and dry summers and wet and cool winters. The average rainfall is approximately 870 mm yr−1 (Fig. 1b) with mean monthly maximum tem-peratures of 25.6◦C in January (summer) and mean
mini-mum temperatures of 3.4◦C in July (winter). The soils of AU-WOM are derived from weathered sandstone and shale, with a surface texture of sandy clay loam, classified as an acidic-mottled, dystrophic, yellow Dermosol (Robinson et al., 2003). The average bulk density in the top 5 cm of min-eral soil is 0.90 g cm−3and soil porosity is 0.65 cm3cm−3. 2.1.1 Experimental design AU-WRR
The temporal variation in soil–atmosphere exchange of CH4
was monitored continuously from 10 October 2010 to 15 Jan-uary 2012 using a fully automated gas chromatograph (GC) measurement system attached to 10 pneumatic open-and-close chambers as described in Livesley et al. (2009). This system was supported by a remote area power system con-sisting of a 5 kW diesel generator and 12 V battery bank. The 10 chambers were randomly distributed over an area of approximately 25×25 m. Chambers were attached to a square steel-frame base (e.g. 50×50 cm) which was inserted 5 cm into the soil and a plexiglass headspace of 15 cm depth (e.g. 37.5 L chamber volume). Chambers were attached to the frame using clamps and closed cell foam. For each chamber, six flux rate measurements were made during a 24 h period, one every 4 h. Further details of the automated trace gas mea-surement system, chamber design and gas chromatograph can be found in Butterbach-Bahl et al. (1997), Papen and Butterbach-Bahl (1999) and Livesley et al. (2009). Soil tem-perature (12-Bit Temp Smart Sensor, Onset Computer Coop-eration, USA) and moisture (EC-5 Soil Moisture Smart
Sen-sor, Onset Computer Cooperation, USA) was logged at 0– 10 cm on a half-hourly basis (Hobo U30, Hobo Data Logger, Onset Computer Cooperation, USA) in the middle of the site. Chamber pneumatic lids opened automatically when rainfall, measured by a tipping bucket rain gauge, exceeded 1 mm in 5 min to avoid a potential reduction in soil moisture inside the chambers caused by the rainfall exclusion during the rel-atively long time of chamber closure (2 h).
2.1.2 Experimental design AU-WOM
Temporal variation in soil–atmosphere exchange of CH4was
monitored continuously from 1 May 2010 to 30 April 2012 using a fully automated Fourier transform infrared (FTIR) spectrometer measurement system attached to six pneumatic open-and-close chambers (Griffith et al., 2012). This system was supported by a remote area power system consisting of a 4.5 kW diesel generator and 24 V battery bank. The auto-matic chambers used followed the same design as that de-scribed at the AU-WRR site. The opening and closing of the lids via pneumatic pistons was controlled with the measur-ing software on site (Spectronous Software, Ecotech PTY Ltd). Six chambers were distributed randomly over an area of around 25×25 m and were measured in sequence with each chamber initially having a measuring period of 15 min (1 May–21 October 2010) that was later extended to 20 min to increase detection precision for other simultaneously mea-sured trace gases (22 October 2010–30 April 2012). Lids were open for both the first and the last 2 min of every 15/20 min measuring interval per chamber to flush the sam-ple lines with ambient air, resulting in a chamber incubation period of 11/16 min. One CH4flux measurement per
head-space of the chamber (closed dynamic set-up), attached airlines (0.3 L tubing volume) and the measuring cell (3.5 L cell volume) of a FTIR spectrometer set-up (Spectronus, Ecotech Pty. Ltd., Australia). The spectrometer (Bruker IR-cube with globar source and thermoelectrically cooled mer-cury cadmium telluride detector) measured concentrations of CH4, CO2, N2O, carbon monoxide and water vapour in the
air stream (Meyer et al., 2001; Griffith et al., 2012; Ham-mer et al., 2013). Measurements of the CH4 concentration
were made every minute during the 15/20 min chamber pe-riod. Further information about measuring principle, instru-ment set-up, maintenance and calibration can be found in Griffith et al. (2012). Soil temperature (thermocouple probe) and moisture (impedance probes, ML2x – Theta Probe Soil Moisture Sensor, Delta-T Devices Ltd., UK) was recorded continuously at 0–5 cm within each chamber. In addition, soil temperature (Averaging Soil Thermocouple Probe, TCAV, Campbell Scientific Australia) and soil moisture (Water Con-tent Reflectometer, CS616, Campbell Scientific Australia) were recorded on a half-hourly basis at 0–10 cm by an on-site eddy covariance system. Given the relatively short closure period of 11/16 min for each chamber during a 4 h period, we decided that automated chamber opening in response to rainfall events was not necessary.
2.2 Flux calculation
CH4flux rates were calculated for both automated measuring
systems from the rate of increase/decrease of gas concentra-tion in the chamber head space with time according to
FµL=(V /A)×(dCCH4/dt ), (1)
whereV is the volume (L) of the chamber head space plus sample lines and the FTIR sample cell,Ais the soil surface area covered by the chamber (m2)andt is time. The term
dCCH4/dt(µL L
−1h−1)was calculated from the initial linear
CH4 concentration change after chamber closure. In cases
where the fitted linear regression model had an R2<0.9, this flux measurement was excluded from further analysis. The determined flux rate (FµL)was subsequently converted
to µmol CH4m−2h−1(Fµmol)by accounting for temperature,
pressure and volume using Eq. (2) based on the ideal gas law:
Fµmol=(FµL×P )/(R×T ), (2)
where P is the atmospheric pressure in kPa at site ac-cording to altitude or direct measurement (Eddy tower),
R is 8.3144 (the ideal gas constant in L kPa−1K−1) and
T is the air temperature in kelvin (273.15+◦C). Fluxes in µmol CH4m−2h−1 were then converted to µg CH4
-C m−2h−1based on the molecular atomic mass. 2.3 Additional measurements
From within each site, composite soil samples (three 0–5 cm samples) were collected, sieved (2 mm) and sub-sampled for
1M KCl extraction (1 : 4, soil : KCl) and gravimetric wa-ter content (GWCS)determination (105◦C for 48 h) during
additional seasonal measurement campaigns spread across the measurement time frame (n=13 in AU-WOM, n=
10 in AU-WRR. KCl extracts were filtered (Whatman 42) and frozen prior to analysis for nitrate (NO−3) and am-monium (NH+4)concentration using an autoanalyser (SFA, Technicon™).
During initial site installation (and over the course of the measurement time frame), approximately 30 volumetric soil cores (0–5 cm, Ø 72 mm) were sampled at each site to de-termine soil volumetric water content (VWC) and soil bulk density (BD). The data were used to establish site dependent calibration curves between the on-site installed soil moisture sensors (HOBO Micro Station Data Logger H21 and EC-5 Soil Moisture Smart Sensor, Onset Computer Corporation, USA), hand-held impedance probes (ML2×Theta probe and HH2 Moisture Meter, Delta-T Devices Ltd., UK) and VWC (Kaleita et al., 2005). The bulk density and volumetric water content data and their relationship to the on-site installed soil moisture sensor readings and hand-held impedance probes readings were further used to calculate soil porosity, air-filled porosity and percentage water-filled pore space (%WFPS) for each plot and measuring event according to Loveday and Commonwealth Bureau of Soils (1973) as follows:
soil porosity=1−(soil bulk density/particle density), (3) where a value of 2.65 was used for particle density (g cm−3)
of rock, sand grains and other soil mineral particles; air−filled porosity=
soil porosity−volumetric water content; (4) %WFPS=
(volumetric water content×100)/soil porosity. (5) At the end of the study, a composite soil sample from five soil cores was collected at 0–5 cm at each site, air dried, sieved (2 mm) and analysed for soil particle size analysis through dispersion, suspension, settling and sequential hydrometer readings (Ashworth et al., 2001). A sub-sample of each air-dried soil was analysed for pH (1 : 5, soil : water) and for total C and N content using an elemental analyser (LECO®). 2.4 Data presentation and statistical analyses
Flux and environmental sensor data presented (if not specif-ically related to individual chambers) in the figures here af-ter are averages for respective chamber cycles where at least two-thirds of the chamber flux measurements had passed the above mentioned flux quality control (1.5/2 h cycle for the FTIR system and a 4 h cycle average for the GC sys-tem) at each site±1 SE (where error bars are present). We also calculated the coefficient of variance per chamber cycle (CV%cycle)by dividing the standard deviation of each
Table 1. Parameters and coefficients of determination (Adj.R2 is adjusted R-squared) of linear regression models explaining seasonal variability in mean chamber cycle methane flux (FCH4) at a mixedEucalyptus obliquaforest stand, Wombat State Forest, Victoria (AU-WOM) and at a mixedE. obliquaandE. regnansforest stand, Warra LTER, Tasmania, Australia (AU-WRR). Standardised coefficientsβ are in parentheses. SD refers to standard deviation of parameter; level of significance (∗p≥0.001). Predictors:T
S(soil temperature), AFP
(air-filled porosity) and soil VWC (volumetric water content). Presented constants are model intercepts and parameters represent the slopes for the predictor variables.
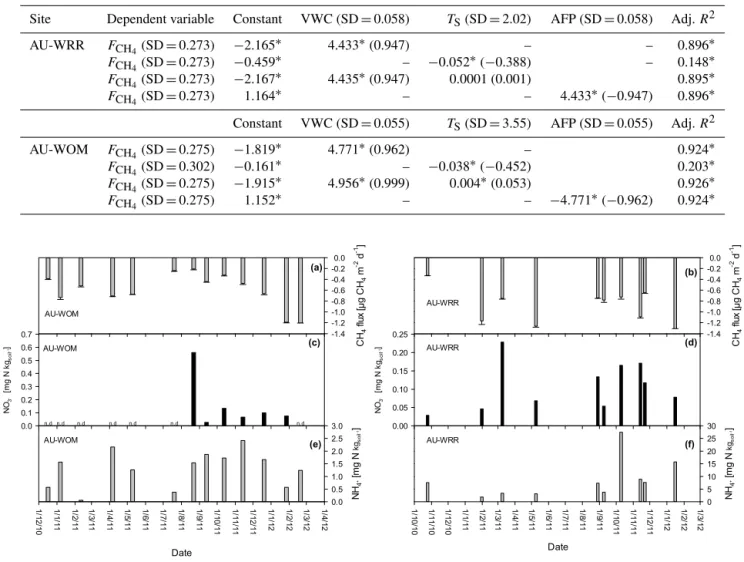
Site Dependent variable Constant VWC (SD=0.051) TS(SD=1.98) AFP (SD=0.488) Adj.R2
AU-WRR FCH4 (SD=10.899) −92.307∗ 195.378∗(0.925) – – 0.855∗
FCH4 (SD=10.899) −19.543
∗ – −2.215∗(−0.399) – 0.158∗
FCH4 (SD=10.899) −88.835∗ 191.664∗(0.907) −0.254∗(−0.046) – 0.857∗
FCH4 (SD=10.899 53.640
∗ – – −195.378∗(0.925) 0.855∗
Constant VWC (SD=0.055) TS(SD=3.42) AFP (SD=0.402) Adj.R2
AU-WOM FCH4 (SD=11.296) −75.068
∗ 195.768∗(0.957) – – 0.915∗
FCH4 (SD=12.720) −6.320∗ – −1.701∗(−0.458) – 0.209∗
FCH4 (SD=10.607) −78.336
∗ 201.671∗(0.982) 0.147∗(0.047) – 0.900∗
FCH4 (SD=11.296) 53.943∗ – – −195.768∗(0.957) 0.915∗
by 100. Furthermore, soil temperature and soil moisture data were averaged accordingly for each chamber cycle to allow regression analysis. In a second step, to enable correlation analysis with daily rainfall and sporadic soil inorganic nitro-gen measurements we calculated daily site averages of the measured fluxes and environmental parameters, with the ex-ception of rainfall where we calculated daily sums, for days where at least 80 % of chamber cycles were available. In addition, we calculated the coefficient of variation per day (CV%day)for the CH4flux data. As outlined above, we
ex-cluded fluxes where the coefficient of determination of the regression of chamber concentration vs. time was less than 0.9, which lead to the exclusion of approximately 10 % of measured chamber fluxes. However, longer gaps in flux data, as shown in Figs. 1a and 2a, are either a result of power fail-ures or the need to switch off the power generators on days of extreme fire danger. This led to data gaps in around 30 % of the individual datasets.
All statistical analyses were performed with SPSS 20 (IBM, USA). Linear regression procedures and multiple lin-ear regression procedures were used to investigate temporal relationships between measured soil environmental param-eters and soil CH4. We initially ran stepwise linear
regres-sion procedure as an exploratory tool to identify significant predictors and predictor combinations and retested these af-terwards in simple or multiple linear regression models. We transformed data when necessary to reduce heteroscedastic-ity for linear regression analysis. We used a restricted max-imum likelihood framework (REML; automatic linear mod-elling in SPSS) to arrive at the Akaike information criterion for three selected models that predict soil CH4 uptake (one
model containing only soil temperature, one model contain-ing only a measure of soil moisture (we choose air-filled porosity, AFP) and one model containing soil temperature and AFP as a predictors of soil CH4flux.
2.5 Annual site CH4flux budgets
To calculate annual site CH4flux budgets for both sites we
first selected a 12-month period with the greatest data cov-erage for daily avcov-erage flux for both sites (1 January 2011– 1 January 2012) and filled existing flux data gaps as follows. For small data gaps of single days where no environmental sensor or flux data were available, we calculated values based on linear interpolation between the CH4flux of the day
be-fore the gap and the day after the gap. For data gaps longer than 1 day, we used the linear regression model between soil VWC soil moisture and daily soil CH4flux for each site
(Ta-ble 1) to estimate the missing CH4flux data.
3 Results
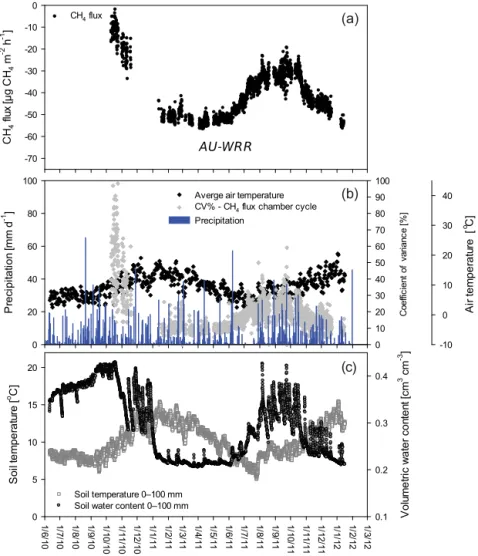
3.1 CH4flux in relation to soil environmental variables At the AU-WRR site, soil CH4 flux was always negative
indicating CH4 uptake all year round (Fig. 2). The
mea-surement cycle means ranged between−2 µg CH4m−2h−1
(spring 2010) to−58.4 µg CH4m−2h−1(autumn 2011) with
an arithmetic mean of−41.2±11.0 SD µg CH4m−2h−1. In
general, months with higher average soil moisture and higher total rainfall displayed lower CH4 uptake when compared
to months with lower average soil moisture and lower to-tal rainfall (Fig. 2). The coefficient of variance (CV) for the average CH4 flux based on 10 chambers in one
measure-ment cycle ranged between 1.8 and 98.0 % with an aver-age of 17.9±11 % (SD) and was higher in periods of rapid changes in soil moisture levels reflecting changes in precipi-tation (Fig. 2).
At the AU-WOM site soil CH4 flux was always
nega-tive, indicating CH4uptake all year round (Fig. 3). The
1/ 6/ 10 1/ 7/ 10 1/ 8/ 10 1/ 9/ 10 1/ 10 /10 1/ 11 /10 1/ 12 /10 1/ 1/ 11 1/ 2/ 11 1/ 3/ 11 1/ 4/ 11 1/ 5/ 11 1/ 6/ 11 1/ 7/ 11 1/ 8/ 11 1/ 9/ 11 1/ 10 /11 1/ 11 /11 1/ 12 /11 1/ 1/ 12 1/ 2/ 12 1/ 3/ 12 S oi l t em pe ra tu re [ o C] 0 5 10 15 20 V ol um et ric w at er c on ten t [ cm
3 c
m -3 ] 0.1 0.2 0.3 0.4
Soil temperature 0–100 mm Soil water content 0–100 mm
A ir te m pe rat ur e [ C ] o -10 0 10 20 30 40 C oef fic ien t of v ar ian ce [% ] 0 10 20 30 40 50 60 70 80 90 100 P rec ipi tat ion [m m d -1 ] 0 20 40 60 80 100
Av erge air temperature
CV% - CH4 flux chamber cycle
Precipitation CH 4 fl ux [μ g C H4 m
-2 h -1 ] -70 -60 -50 -40 -30 -20 -10 0
CH4 flux
AU-WRR D (a) (b) (c)
Figure 2.Soil-based flux of CH4at a mixedEucalyptus obliquaandE. regnansforest stand. Warra LTER, Tasmania, Australia (AU-WRR). Panel(a)shows CH4flux cycle means of 10 chambers measured within a 4 h time period. Panel(b)shows site air temperature averaged
over the chamber cycle period (black diamonds), daily rainfall sums (blue bars) and coefficient of variance of the CH4flux cycle mean
shown in(a)(grey diamonds). Panel(c)shows soil temperature in the top 0–10 cm averaged over each chamber cycle (grey squares) and corresponding soil volumetric water content (black/grey circles) at the site.
(recorded during a period of heavy rainfall in summer 2011) to−62.5 µg CH4m−2h−1(summer 2010) with an arithmetic
mean of −25.5±12.7 SD µg CH4m−2h−1. Similar to the
AU-WRR site, months with higher average soil moisture and higher total rainfall displayed lower CH4uptake when
com-pared to months with lower average soil moisture and lower total rainfall (Fig. 3). The CV for the average CH4flux based
on six chambers in one measurement cycle ranged between 6.7 and 143.0 % with an average of 29.3±9.7 % (SD) and was again higher in times of rapid soil moisture changes in response to changes in precipitation patterns (Fig. 3).
For AU-WRR the linear regression analysis showed that VWC accounted for approximately 85 % of variability in soil CH4 uptake across all seasons (Fig. 4a, Table 1) with soil
CH4 uptake decreasing when soil VWC increased or soil
CH4 uptake increasing when AFP increased (Fig. 4b,
Ta-ble 1). Soil temperature (0–5 cm) alone was weakly related
to CH4uptake with higher CH4uptake rates associated with
higher soil temperatures. However, soil temperature alone was only able to account for approximately 16 % of seasonal variability in CH4uptake (Fig. 4c, Table 1). In addition, after
taking the effect of VWC into account, soil temperature only explained around 1.5 % of the remaining variability in CH4
uptake at AU-WRR (data not shown). A regression model containing VWC and soil temperature as input variables had only a marginally higher coefficient of determination when compared to the model only containing VWC (Table 1). Air-filled porosity or VWC showed some weak dependency of soil temperature at the site (R2=0.14,p <0.001).
For AU-WOM the linear regression analysis showed that VWC could account for around 91 % of variability in soil CH4 uptake across all seasons (Fig. 4a, Table 1) with soil
CH4uptake decreasing when soil VWC increased, the
tem-1/ 2/ 10 1/ 3/ 10 1/ 4/ 10 1/ 6/ 10 1/ 7/ 10 1/ 8/ 10 1/ 10 /10 1/ 11 /10 1/ 12 /10 1/ 2/ 11 1/ 3/ 11 1/ 4/ 11 1/ 6/ 11 1/ 7/ 11 1/ 8/ 11 1/ 10 /11 1/ 11 /11 1/ 12 /11 1/ 2/ 12 1/ 3/ 12 1/ 4/ 12 1/ 6/ 12 1/ 1/ 10 1/ 5/ 10 1/ 9/ 10 1/ 1/ 11 1/ 5/ 11 1/ 9/ 11 1/ 1/ 12 1/ 5/ 12 S oi l t em pe rat ur e [ o C] 0 5 10 15 20 25 30 V olu me tri c wa te r c on te nt [c m
3 c
m -3 ] 0.1 0.2 0.3 0.4
Soil temperature 0–100 mm Soil water content 0–100 mm
A ir te m pe rat ur e [ C ] o -10 0 10 20 30 40 C oe ffici en t o f v ar ia nc e [%] 0 10 20 30 40 50 60 70 80 90 100 110 120 130 P rec ipi tat ion [m m d -1 ] 0 20 40 60 80 100
Average air temperature
CV% - CH4 flux chamber cycle
Precipitation CH 4 fl ux [μ g C H4 m
-2 h -1 ] -70 -60 -50 -40 -30 -20 -10 0
CH4 flux (a)
(c) (b)
AU-WOM
Figure 3. Soil-based flux of CH4 at a mixedEucalyptus obliqua forest stand, Wombat State Forest, Victoria, Australia (AU-WOM).
Panel(a)shows CH4 flux cycle means of six chambers measured within a 2 h time period. Panel(b) shows site air temperature aver-aged over the chamber cycle period (black diamonds), daily rainfall sums (blue bars) and coefficient of variance of the CH4flux cycle mean
shown in(a)(grey diamonds). Panel(c)shows soil temperature in the top 0–10 cm averaged over each chamber cycle (grey squares) and corresponding soil volumetric water content (black/grey circles) at the site.
Table 2.Parameters and coefficients of determination (Adj.R2)of selected linear models in combination with results of a restricted maximum likelihood analysis (REML) explaining seasonal variability in mean chamber cycle methane flux (FCH4) at a mixedEucalyptus obliquaforest
stand, Wombat State Forest, Victoria (AU-WOM) and at a mixedE. obliquaandE. regnansforest stand, Warra LTER, Tasmania, Australia (AU-WRR). Predictors:TS(soil temperature) and AFP (air-filled porosity). REML results: Akaike information criterion (AIC); Estimate of importance for models containing both predictors are in parentheses.
Site Dependent variable Constant (intercept) AFP (slope) TS(slope) AIC Adj.R2
AU-WRR FCH4 53.640 −195.378 – 5666 0.855
FCH4 −19.543 – −2.215 9657 0.158
FCH4 55.587 −193.284 (0.997) −0.254 (0.003) 5629 0.857
AU-WOM FCH4 53.943 −195.768 – 7648 0.915
FCH4 −6.320 – −1.701 13 088 0.209
Soil temperature [oC]
4 6 8 10 12 14 16 18 20 22
CH
4
flu
x [
μg
C
H4
m
-2 h -1 ]
-80 -60 -40 -20 0
Volumetric water content [cm3 cm-3]
0.10 0.15 0.20 0.25 0.30 0.35 0.40 0.45
CH
4
flu
x [μg
C
H4
m
-2 h -1 ]
-80 -60 -40 -20 0
Air filled porosity [cm3 cm-3]
0.2 0.3 0.4 0.5 0.6 0.7
CH
4
flu
x [μg
C
H4
m
-2 h -1 ]
-80 -60 -40 -20 0
WFPS [%]
10 20 30 40 50 60
CH
4
flu
x [
μg
C
H4
m
-2 h -1]
-80 -60 -40 -20 0
(a)
(c) (d)
(b)
AU-WOM: FCH4 = -75.07+1.88*x ; Adj.R2 = 0.91 AU-WRR: FCH4 = -95.76+1.47*x ; Adj.R2 = 0.87 AU-WOM: FCH4 = -75.07+195.77*x ; Adj .R2 = 0.91
AU-WRR: FCH4 = -92.31+195.38*x ; Adj.R2 = 0.85
AU-WOM: FCH4 = -6.32 - 1.70*x ; Adj.R2 = 0.21 AU-WRR: FCH4 = -19.54 - 2.21*x ; Adj.R2 = 0.16
AU-WOM: FCH4 = 53.94-195.77*x ; Adj.R2 = 0.91 AU-WRR: FCH4 = 53.64-195.38*x ; Adj.R2 = 0.85
Figure 4.Relationships between soil volumetric water content and soil CH4 flux(a), soil air-filled porosity and soil CH4flux(b), soil
temperature and soil CH4flux(c)and soil water-filled pore space (WFPS) and soil CH4flux(d)for each chamber cycle at a mixedEucalyptus
obliquaforest stand, Wombat State Forest, Victoria (black circles, AU-WOM) and at a mixedE. obliquaandE. regnansforest stand, Warra
LTER, Tasmania, Australia (white circles, AU-WRR). Lines symbolise significant linear regressions between the parameters (regression parameters are listed in Table 1).
perature (0–5 cm) alone was again weakly related to CH4
up-take with higher CH4uptake rates associated with higher soil
temperatures (Fig. 4c). At the AU-WOM site, only around 20 % of seasonal variability in CH4uptake (Table 1) was
ex-plained by soil temperature. In addition, similar to the results at AU-WRR, after taking the effect of VWC into account, soil temperature only explained around 5 % of the remain-ing variability in CH4uptake at AU-WOM (data not shown).
Furthermore, a regression model containing VWC and soil temperature had a marginally lower coefficient of determina-tion (Table 1) when compared to the model only containing VWC (Table 1). Air-filled porosity or VWC showed some weak dependency of soil temperature at the site (R2=0.38,
p <0.001).
The AIC results of the REML analysis confirm the results of the linear regression approach (Table 2) showing that soil moisture (in this case expressed as AFP) is the strongest pre-dictor of soil CH4 flux in both forest systems. The
analy-sis shows that the models including soil moisture and soil temperature perform marginally better based on AIC com-pared to models including only soil moisture to predict soil CH4 flux. However, the importance rating of the predictors
(soil moisture and soil temperature) clearly indicates that in both forest systems soil moisture dominates as it accounts for more than 99 % of the proportion of variance explained by the model compared to<0.01 % proportion of the vari-ance explained by soil temperature.
3.2 Mean daily and annual CH4flux in relation to environmental variables
3.2.1 Site AU-WRR
Daily site averages ranged between −0.12 and
−1.35 mg CH4m−2d−1 with an arithmetic mean of −0.98±0.27 (SD) mg CH4m−2d−1. The coefficient of
determination for the regression analysis changed slightly when the regression analysis was calculated on daily means and VWC was able to account for up to 89 % in the observed variability in CH4 flux (Table 3). The CV for the daily
average site CH4flux ranged between 0.15 and 20.6 % with
Table 3.Parameters and coefficients of determination (Adj.R2)of linear regression models explaining seasonal variability in mean daily methane flux (FCH4)at a mixedEucalyptus obliquaforest stand, Wombat State Forest, Victoria (AU-WOM) and at a mixedE. obliqua
and E. regnansforest stand, Warra LTER, Tasmania, Australia (AU-WRR). Standardised coefficientsβare in parentheses; SD refers to
standard deviation of parameter; level of significance (∗≤0.001). Predictors:T
S(soil temperature), AFP (air-filled porosity) and soil VWC
(volumetric water content). Presented constants are model intercepts and parameters represent the slopes for the predictor variables.
Site Dependent variable Constant VWC (SD=0.058) TS(SD=2.02) AFP (SD=0.058) Adj.R2
AU-WRR FCH4 (SD=0.273) −2.165
∗ 4.433∗(0.947) – – 0.896∗
FCH4 (SD=0.273) −0.459∗ – −0.052∗(−0.388) – 0.148∗
FCH4 (SD=0.273) −2.167
∗ 4.435∗(0.947) 0.0001 (0.001) 0.895∗
FCH4 (SD=0.273) 1.164∗ – – 4.433∗(−0.947) 0.896∗
Constant VWC (SD=0.055) TS(SD=3.55) AFP (SD=0.055) Adj.R2
AU-WOM FCH4 (SD=0.275) −1.819∗ 4.771∗(0.962) – 0.924∗
FCH4 (SD=0.302) −0.161
∗ – −0.038∗(−0.452) 0.203∗
FCH4 (SD=0.275) −1.915∗ 4.956∗(0.999) 0.004∗(0.053) 0.926∗
FCH4 (SD=0.275) 1.152
∗ – – −4.771∗(−0.962) 0.924∗
AU-WOM (e)
Date
1/12
/10 1/1/11
1/2/ 11 1/3/ 11 1/4/ 11 1/5/ 11 1/6/ 11 1/7/ 11 1/8/ 11 1/9/ 11 1/10
/11 1/11/11 1/12/11 1/1/12
1/2/ 12 1/3/ 12 1/4/ 12 NH 4 + [mg N kgso il -1 ] 0.0 0.5 1.0 1.5 2.0 2.5 3.0 NO 3 [m g N kg so il -1 ] 0.00 0.05 0.10 0.15 0.20 0.25 AU-WRR (d) NO 3 [m g N kg so il -1 ] 0.0 0.1 0.2 0.3 0.4 0.5 0.6 0.7
n.d n.d n.d n.d n.d n.d n.d AU-WOM (c) Date 1/10
/10 1/11/10 1/12/10 1/1/11
1/2/ 11 1/3/ 11 1/4/ 11 1/5/ 11 1/6/ 11 1/7/ 11 1/8/ 11 1/9/ 11 1/10
/11 1/11/11 1/12/11 1/1/12
1/2/ 12 1/3/ 12 NH 4 + [mg N kgso il -1 ] 0 5 10 15 20 25 30 AU-WRR (f) CH 4 flu x [μ g C H4 m
-2 d -1] -1.4 -1.2 -1.0 -0.8 -0.6 -0.4 -0.20.0 AU-WOM (a) CH 4 flu x [μ g C H4 m
-2 d -1] -1.4 -1.2 -1.0 -0.8 -0.6 -0.4 -0.20.0 AU-WRR (b)
Figure 5.Dynamics in soil CH4flux(a, b)soil nitrate levels(c, d)and soil ammonium levels(e, f)at a mixedEucalyptus obliquaforest stand, Wombat State Forest, Victoria (AU-WOM) and a mixedE. obliquaandE. regnansforest stand, Warra LTER, Tasmania (AU-WRR), Australia; n.d means not detectable. Results of the linear regression analysis between CH4and NH+4 or NO−3 for both sites are not presented.
They were AU-WOM: NO−3 /CH4(Adj.R2=0.06,p=0.21) NH+4/CH4(Adj.R2= −0.08,p=0.83); AU-WRR: NO−3 /CH4(Adj.
R2= −0.11,p=0.80) NH+4 /CH4(Adj.R2= −0.11,p=0.84).
NH+4 and soil NO−3 samples were taken on-site to enable regression analysis; however, neither NH+4 nor NO−3 alone or together could explain any variability in soil CH4flux at
the site and all relationships were non-significant (Fig. 5b, d, f).
3.2.2 Site AU-WOM
Daily site averages ranged between −0.11 and
−1.36 mg CH4m−2d−1 with an arithmetic mean of −0.62±0.30 (SD) mg CH4m−2d−1. The CV for the daily
average site CH4flux ranged between 0.11 and 47.6 % with
an average of 5.6±4.36 % (SD) and was again higher in periods of rapid changes in soil moisture levels. As for the AU-WRR site the coefficient of determination for the regression analysis changed slightly when the regression analysis was calculated on daily means and VWC was able to account for up to 92 % in the observed variability in CH4
flux (Table 3). Similar to the AU-WRR site, 3-day CH4flux
3.3 Annual site CH4flux budgets
The calculated annual CH4 budget for the year 2011 of the
AU-WRR site was−3.83 kg CH4ha−1yr−1. The calculated
annual CH4budget for the year 2011 of the AU-WOM site
was−1.79 kg CH4ha−1yr−1.
4 Discussion
One of the most novel results of our study is the strong lin-ear relationship observed between soil moisture and CH4
up-take. To our knowledge the strength of this relationship is unique for temperate forest systems measured using continu-ous automated chamber systems over a long period. It is also striking that this strong linear relationship was similar in the two temperate eucalypt forests (dry and wet) regardless of the differences in forest structure, soil type, annual precipitation and geographical distance. It is possible that the two differ-ent measuremdiffer-ent systems (GC at WRR and FTIR at AU-WOM) could produce different measures of CH4flux if
op-erated at the same site because of technological and method-ological differences. If that were true, there would only be a remote chance that the two linear relationships between CH4
flux and AFP would overlap one another. As such, our find-ing that the relationships between CH4flux and AFP do
con-verge into one common regression line (as shown in Fig. 4) is worth noting and suggests similar accuracy between the two measurement systems and similar function in soil CH4
exchange processes at the two forest sites.
CH4flux data collected in the long-term in temperate
de-ciduous forest systems in Europe (Butterbach-Bahl and Pa-pen, 2002) has shown that soil moisture can explain up to 58 % of the seasonality in soil CH4uptake. Similarly, Kiese
et al. (2003) reported that soil moisture could explain up to 53 % of the seasonality in CH4exchange in a tropical
rain-forests in Queensland, Australia. Soil moisture influences soil gas diffusivity and is considered the most important fac-tor controlling seasonality of CH4uptake in soils worldwide
(Dalal et al., 2008; Dalal and Allen, 2008; Smith et al., 2003, 2000; Ball et al., 1997) and the negative relationship between soil moisture and soil CH4uptake reported in this study has
been previously reported for other ecosystems (Hartmann et al., 2011; Stiehl-Braun et al., 2011; Castro et al., 1994; Price et al., 2003). This agrees with the theory that soil CH4
up-take is mainly limited by diffusion in most forest ecosystems (Price et al., 2004) when the sites of microbial CH4
oxida-tion are distributed through the surface soil (Stiehl-Braun et al., 2011) and the concentration gradient between soil and atmosphere, which drives the flux, is effectively constant (von Fischer and Hedin, 2007). However, previous field stud-ies have never been able to demonstrate so conclusively the strength of the relationship (>90 % variation explained) be-tween AFP and soil CH4 uptake and for two separate
for-est systems. To our knowledge the only other study where
similarly strong correlations between soil moisture and CH4
uptake have been reported was for grassland soils under sum-mer rainfall exclusion (Hartmann et al., 2011).
It is important to note that WFPS has commonly been used to model, or compare, soil CH4 uptake in different
ecosys-tems (Del Grosso et al., 2000). However, in our study this soil environmental variable was not as effective as AFP in explaining the observed CH4flux patterns at the two
temper-ate forest sites. At an individual site level, the relationship between WFPS and CH4uptake had the same coefficient of
determination as between AFP and CH4uptake; however, the
slope of the relationship differed between the two forest sites (Fig. 4d). This suggests that WFPS is not the most suitable soil moisture metric to relate soil gas diffusivity to soil CH4
flux when comparing sites or ecosystems. This is most likely due to the fact that WFPS is a proportional measure that re-lates VWC to the total soil porosity (Eq. 4); compared to AFP that is a direct expression of the air-filled pore volume in a given soil (Eq. 5).
This demonstrates that soil gas diffusivity is primarily re-lated to the volumetric fractions of air (AFP), rather than the volumetric fraction of water in the soil since diffusion through air is much faster than through water (Farquharson and Baldock, 2008).
Our data also show a very weak influence by soil temper-ature on soil CH4 uptake. This temperature effect appears
to be mainly driven by the correlation between soil mois-ture and soil temperamois-ture, which is typical for the climate of the investigated forest systems. After the effect of soil mois-ture was accounted for, soil temperamois-ture was only able to ac-count for less than 5 % of the remaining variability in soil CH4flux at AU-WOM and less than 1.5 % of the remaining
variability in soil CH4 flux at AU-WRR. Furthermore, the
daily temperature variation in soil CH4 uptake would have
been masked in the analyses because all regression analy-ses were performed on either chamber cycle or daily uptake means. However, the overall weak but statistically significant temperature dependency of soil CH4 uptake is unlikely to
greatly influence seasonal CH4flux variability given that at
both sites around 90 % of seasonal variability in CH4uptake
can be explained by soil moisture alone and that soil mois-ture and temperamois-ture are weakly correlated in the investigated forest systems. This was more pronounced at the AU-WOM site because temporal soil moisture variability was greater and we had 2 years of data compared to 1 year of data at the AU-WRR site. However, a model that includes soil temper-ature and soil moisture together performed marginally better based on the AIC as compared to a model that only used soil moisture status in predicting soil CH4flux at both of our
sites, which is logical based on the fact that all soil microbial processes show a physiological temperature response; but it appears that for the MOB, temperature response is rather muted at our sites during our measurement time frame. Fur-thermore, our data also show that soil CH4uptake still
AFP=0.59 cm3cm−3) with CH4 uptake ranging between −62 to−80 µg CH4m−2h−1at this time. We can therefore
hypothesise that MOB activity was not severely limited by moisture at the AU-WOM and the AU-WRR sites during the measurement period.
This study reports continuous measurement of soil– atmosphere CH4 exchange in two temperate eucalypt
forests in Australia measured at high-temporal reso-lution for >12 months. Mean daily CH4 flux
val-ues (AU-WRR= −1.35 to −0.12 mg CH4m−2d−1;
AU-WOM= −1.36 to−0.11 mg CH4m−2d−1)were well within
the reported range for other temperate forests in Europe (−2.47 to +0.26 mg CH4m−2d−1; Smith et al., 2000) or
worldwide (−10.68 to 0.02 mg CH4m−2d−1; Dalal et al.,
2008; Dalal and Allen, 2008).
The estimated annual CH4 uptake of
−1.79 kg CH4ha−1yr−1 for AU-WOM and −3.83 kg CH4ha−1yr−1 for AU-WRR are comparable
to the range of −2.5 to−3.7 kg CH4ha−1yr−1reported for
temperate beech and spruce forest sites in Germany where CH4fluxes were measured with a similar automated system
over multiple years (Butterbach-Bahl and Papen, 2002). Globally, a range of −1.31 to −10.5 kg CH4ha−1yr−1 has
been reported for temperate forest systems based on short-and long-term automated short-and manual chamber measurement campaigns (Dalal et al., 2008; Dalal and Allen, 2008). The annual CH4 uptake rate estimated for AU-WOM in our
study was less than a third of the −5.8 kg CH4ha−1yr−1
estimated by Meyer et al. (1997) for soils in the same forest system. This earlier CH4 sink estimate was based
on only five seasonal flux measurements but might also be attributed to the measurements being taken during three dry years (1993–1995) when average rainfall was 677 mm yr−1 (Meyer et al., 1997). In comparison, the years when our study was undertaken (2010–2012), the average rainfall was 1063 mm yr−1. This may partly explain the greater CH
4
uptake estimate of Meyer et al. (1997) as the lower soil moisture levels may well lead to greater CH4uptake rates.
5 Conclusion
Our field data suggest that the difference in magnitude of CH4 flux at both sites was based solely on differences in
AFP due to site differences in soil bulk density, soil poros-ity as a near-identical relationship between AFP and soil CH4uptake existed at both sites. This means that future
re-search should investigate whether simple information about soil bulk density can be used to estimate CH4uptake across
different eucalypt forest ecosystems in Australia, or in other similar ecosystems globally. Our data further demonstrate that temporal variability in soil CH4 uptake was
predomi-nantly controlled by temporal variability in soil AFP that is linked to soil gas diffusivity. This means that seasonality in CH4uptake can be predicted with very high accuracy where
information about soil moisture dynamics is available or can be simulated with high certainty. However, since soil texture at both sites was relatively coarse and soils were both clay loams further studies need to establish if the AFP to CH4
re-lationship holds true across different soil texture classes. Our results highlight the importance of long-term field measure-ments in establishing relationships between soil environmen-tal drivers and soil CH4uptake and allowing the calibration
of models used to calculate global CH4sink distribution and
magnitude.
6 Data availability
The dataset can be accessed here:
doi:10.4225/49/588574690c0ec (Fest, 2017).
Acknowledgements. The study was supported by funding from
the Terrestrial Ecosystem Research Network (TERN) Australian Supersite Network, the TERN OzFlux Network, the Australian Research Council (ARC, grants LE0882936 and DP120101735) and the Victorian Department of Environment, Land, Water and Planning Integrated Forest Ecosystem Research program. We would like to thank Julio Najera and student volunteers for assistance with site and instrument maintenance.
Edited by: G. Wohlfahrt
Reviewed by: three anonymous referees
References
Ashworth, J., Keyes, D., Kirk, R., and Lessard, R.: Standard proce-dure in the hydrometer method for particle size analysis, Com-mun. Soil. Sci. Plan., 32, 633–642, 2001.
Ball, B. C., Dobbie, K. E., Parker, J. P., and Smith, K. A.: The influ-ence of gas transport and porosity on methane oxidation in soils, J. Geophys. Res.-Atmos., 102, 23301–23308, 1997.
Boeckx, P., van Cleemput, O., and Villaralvo, I.: Methane oxidation in soils with different textures and land use, Nutr. Cycl. Agroe-cosys., 49, 91–95, 1997.
Born, M., Dorr, H., and Levin, I.: Methane consumption in aerated soils of the temperate zone, Tellus B, 42, 2–8, doi:10.1034/j.1600-0889.1990.00002.x, 1990.
Butterbach-Bahl, K. and Papen, H.: Four years continuous record of CH4-exchange between the atmosphere and untreated and limed
soil of a N-saturated spruce and beech forest ecosystem in Ger-many, Plant. Soil., 240, 77–90, 2002.
Butterbach-Bahl, K., Gasche, R., Breuer, L., and Papen, H.: Fluxes of NO and N2O from temperate forest soils: impact of forest
type, N deposition and of liming on the NO and N2O emissions,
Nutr. Cycl. Agroecosys., 48, 79–90, 1997.
Butterbach-Bahl, K., Gasche, R., Huber, C. H., Kreutzer, K., and Papen, H.: Impact of N-input by wet deposition on N-trace gas fluxes and CH4-oxidation in spruce forest ecosystems of the
Butterbach-Bahl, K., Rothe, A., and Papen, H.: Effect of tree dis-tance on N2O and CH4-fluxes from soils in temperate forest ecosystems, Plant. Soil., 240, 91–103, 2002.
Castro, M. S., Melillo, J. M., Steudler, P. A., and Chapman, J. W.: Soil-moisture as a predictor of methane uptake by temperate for-est soils, Can. J. Forfor-est. Res., 24, 1805–1810, 1994.
Castro, M. S., Steudler, P. A., Melillo, J. M., Aber, J. D., and Bow-den, R. D.: Factors Controlling Atmospheric Methane Consump-tion by Temperate Forest Soils, Global. Biogeochem. Cy., 9, 1– 10, 1995.
Montreal Process Implementation Group for Australia and Na-tional Forest Inventory Steering Committee: Australia’s State of the Forests Report 2013, Australian Government Department of Agricutlure ABARES, Canberra, 38, 2013.
Crill, P. M.: Seasonal patterns of methane uptake and carbon dioxide release by a temperate woodland soil, Global. Biogeochem. Cy., 5, 319–334, 1991.
Dalal, R. C. and Allen, D. E.: Greenhouse gas fluxes from natu-ral ecosystems, Aust. J. Bot, 56, 369–407, doi:10.1071/bt07128, 2008.
Dalal, R. C., Allen, D. E., Livesley, S. J., and Richards, G.: Magnitude and biophysical regulators of methane emission and consumption in the Australian agricultural, forest, and submerged landscapes: a review, Plant. Soil., 309, 43–76, doi:10.1007/s11104-007-9446-7, 2008.
Del Grosso, S. J., Parton, W. J., Mosier, A. R., Ojima, D. S., Potter, C. S., Borken, W., Brumme, R., Butterbach-Bahl, K., Crill, P. M., Dobbie, K., and Smith, K. A.: General CH4oxidation model and
comparisons of CH4oxidation in natural and managed systems,
Global. Biogeochem. Cy., 14, 999–1019, 2000.
Dick, J., Skiba, U., Munro, R., and Deans, D.: Effect of N-fixing and non N-fixing trees and crops on NO and N2O emissions from Senegalese soils, J. Biogeogr., 33, 416–423, 2006.
Dunlop, M. and Brown, P. R.: Implications of climate change for Australia’s National Reserve System: A preliminary assessment. Report to the Department of Climate Change, February 2008, Department of Climate Change, Canberra, Australia, Canberra, 196, 2008.
Dutaur, L. and Verchot, L. V.: A global inventory of the soil CH4 sink, Global. Biogeochem. Cy., 21, GB4013,
doi:10.1029/2006gb002734, 2007.
Farquharson, R. and Baldock, J.: Concepts in modelling N2O
emis-sions from land use, Plant. Soil., 309, 147–167, 2008.
Fest, B.: The impact of fire disturbance and simulated climate change conditions on soil methane exchange in euclypt forests of south-eastern Australia, PhD, School of Ecosystem and For-est Sciences, The University of Melbourne, Melbourne, 185 pp., 2013.
Fest, B.: Soil-atmosphere methane exchange data for AU-WOM and AU-WRR with soil environmental variables, University of Melbourne, doi:10.4225/49/588574690c0ec, 2017.
Fest, B. J., Livesley, S. J., Drösler, M., van Gorsel, E., and Arndt, S. K.: Soil-atmosphere greenhouse gas exchange in a cool, tem-perate Eucalyptus delegatensis forest in south-eastern Australia, Agr. Forest. Meteorol., 149, 393–406, 2009.
Fest, B., Wardlaw, T., Livesley, S. J., Duff, T. J., and Arndt, S. K.: Changes in soil moisture drive soil methane uptake along a fire regeneration chronosequence in a eucalypt forest landscape,
Glob. Change. Biol., 21, 4250–4264, doi:10.1111/gcb.13003, 2015a.
Fest, B. J., Livesley, S. J., von Fischer, J. C., and Arndt, S. K.: Repeated fuel reduction burns have little long-term impact on soil greenhouse gas exchange in a dry sclero-phyll eucalypt forest, Agr. Forest. Meteorol., 201, 17–25, doi:10.1016/j.agrformet.2014.11.006, 2015b.
Griffith, D. W. T., Deutscher, N. M., Caldow, C., Kettlewell, G., Riggenbach, M., and Hammer, S.: A Fourier transform infrared trace gas and isotope analyser for atmospheric applications, At-mos. Meas. Tech., 5, 2481–2498, doi:10.5194/amt-5-2481-2012, 2012.
Hammer, S., Griffith, D. W. T., Konrad, G., Vardag, S., Caldow, C., and Levin, I.: Assessment of a multi-species in situ FTIR for precise atmospheric greenhouse gas observations, Atmos. Meas. Tech., 6, 1153–1170, doi:10.5194/amt-6-1153-2013, 2013. Hartmann, A. A., Buchmann, N., and Niklaus, P. A.: A study
of soil methane sink regulation in two grasslands exposed to drought and N fertilization, Plant. Soil., 342, 265–275, doi:10.1007/s11104-010-0690-x, 2011.
IPCC: The Scientific Basis. Contribution of Working Group I to the Fifth Assessment Report of the intergovernmental Panel on Cli-mate Change Cambridge University Press, Cambridge, United Kingdom and New York, NY, USA, 1535, 2013.
Kaleita, A. L., Heitman, J. L., and Logsdon, S. D.: Field Calibration of the Theta Probe for Des Moines Lobe Soils, Appl. Eng. Agric., 21, 865–870, 2005.
Khalil, M. I. and Baggs, E. M.: CH4oxidation and N2O emissions
at varied soil water-filled pore spaces and headspace CH4
con-centrations, Soil. Biol. Biochem., 37, 1785–1794, 2005. Kiese, R., Hewett, B., Graham, A., and Butterbach-Bahl, K.:
Sea-sonal variability of N2O emissions and CH4uptake by tropical rainforest soils of Queensland, Australia, Global. Biogeochem. Cy., 17, 1043, doi:10.1029/2002gb002014, 2003.
Livesley, S. J., Kiese, R., Miehle, P., Weston, C. J., Butterbach-Bahl, K., and Arndt, S. K.: Soil-atmosphere exchange of green-house gases in a Eucalyptus marginata woodland, a clover-grass pasture, and Pinus radiata and Eucalyptus globulus plan-tations, Glob. Change Biol., 15, 425–440, doi:10.1111/j.1365-2486.2008.01759.x, 2009.
Livesley, S. J., Grover, S., Hutley, L. B., Jamali, H., Butterbach-Bahl, K., Fest, B., Beringer, J., and Arndt, S. K.: Seasonal varia-tion and fire effects on CH4, N2O and CO2exchange in savanna soils of northern Australia, Agr. Forest. Meteorol., 151, 1440– 1452, 2011.
Loveday, J. and Commonwealth Bureau of Soils: Methods for anal-ysis of irrigated soils, Commonwealth Agricultural Bureaux, Farnham Royal, Buckinghamshire, 208 pp., 1973.
McIntosh, P. D.: Soil characterisation at the Warra Flux Tower su-persite, Version 2, with supplementary data, Forest Practices Au-thority Contract Report, prepared for Forestry Tasmania, 16 pp., 2012.
Meyer, C. P., Galbally, I. E., Wang, Y., Weeks, I. A., Jamie, I., and Griffith, D. W. T.: Two automatic chamber techniques for mea-suring soil-atmosphere exchanges of trace gases and results of their use in the OASIS filed experiment, CSIRO Australia, As-pendale, 33, 2001.
gases from soil following prescribed burning in a southern eu-calyptus forest. Final report to the National Greenhouse Gas In-ventory Committee, CSIRO, Division of Atmospheric Research, Aspendale, Victoria, 1–66, 1997.
Niklaus, P. A., Wardle, D. A., and Tate, K. R.: Effects of Plant Species Diversity and Composition on Nitrogen Cycling and the Trace Gas Balance of Soils, Plant. Soil., 282, 83–98, doi:10.1007/s11104-005-5230-8, 2006.
Ojima, D. S., Valentine, D. W., Mosier, A. R., Parton, W. J., and Schimel, D. S.: Effect of land-use change on methane oxidation in temperate forest and grassland soils, Chemosphere, 26, 675– 685, 1993.
Papen, H. and Butterbach-Bahl, K.: A 3-year continuous record of nitrogen trace gas fluxes from untreated and limed soil of a N-saturated spruce and beech forest ecosystem in Germany – 1. N2O emissions, J. Geophys. Res.-Atmos., 104, 18487–18503, 1999.
Price, S. J., Sherlock, R. R., Kelliher, F. M., McSeveny, T. M., Tate, K. R., and Condron, L. M.: Pristine New Zealand forest soil is a strong methane sink, Glob. Change. Biol., 10, 16–26, 2003. Price, S. J., Kelliher, F. M., Sherlock, R. R., Tate, K. R., and
Condron, L. M.: Environmental and chemical factors regulating methane oxidation in a New Zealand forest soil, Aust. J. Soil Res., 42, 767–776, doi:10.1071/SR04026, 2004.
Robinson, N., Rees, D., Reynard, K., MacEwan, R., Dahlhaus, P., Imhof, M., Boyle, G., and Baxter, N.: A land resource assessment of the Corangamite region, Primary Industries Research Victoria, Bendigo, Victoria, 121, 2003.
Sitaula, B. K., Bakken, L. R., and Abrahamsen, G.: CH4uptake by
temperate forest soi-effect of N input and soil acidification, Soil. Biol. Biochem., 27, 871–880, 1995.
Smith, K. A., Dobbie, K. E., Ball, B. C., Bakken, L. R., Sitaula, B. K., Hansen, S., Brumme, R., Borken, W., Christensen, S., Prieme, A., Fowler, D., Macdonald, J. A., Skiba, U., Klemedts-son, L., Kasimir-KlemedtsKlemedts-son, A., Degorska, A., and Orlanski, P.: Oxidation of atmospheric methane in Northern European soils, comparison with other ecosystems, and uncertainties in the global terrestrial sink, Glob. Change. Biol., 6, 791–803, 2000. Smith, K. A., Ball, T., Conen, F., Dobbie, K. E., Massheder, J.,
and Rey, A.: Exchange of greenhouse gases between soil and atmosphere: interactions of soil physical factors and biological processes, Eur. J. Soil. Sci., 54, 779–791, doi:10.1046/j.1351-0754.2003.0567.x, 2003.
Stiehl-Braun, P. A., Hartmann, A. A., Kandeler, E., Buchmann, N., and Niklaus, P. A.: Interactive effects of drought and N fertilization on the spatial distribution of methane assimila-tion in grassland soils, Glob. Change. Biol., 17, 2629–2639, doi:10.1111/j.1365-2486.2011.02410.x, 2011.