Predisposes to Obesity. A 6-Year Population-Based
Prospective Cohort Study
Simona Bo1*, Giovanni Musso2, Guglielmo Beccuti1, Maurizio Fadda3, Debora Fedele1, Roberto Gambino1, Luigi Gentile4, Marilena Durazzo1, Ezio Ghigo1, Maurizio Cassader1
1Department of Medical Sciences, University of Turin, Turin, Italy,2Emergency Department, Gradenigo Hospital, Turin, Italy,3Dietology Unit, Citta` della Salute e della Scienza, Turin, Italy,4Diabetic Clinic, Hospital of Asti, Asti, Italy
Abstract
Background/Objectives: It has been hypothesized that assuming most of the caloric intake later in the day leads to metabolic disadvantages, but few studies are available on this topic. Aim of our study was to prospectively examine whether eating more of the daily caloric intake at dinner leads to an increased risk of obesity, hyperglycemia, metabolic syndrome, and non-alcoholic fatty liver disease (NAFLD).
Subjects/Methods:1245 non-obese, non-diabetic middle-aged adults from a population-based cohort underwent a 3-day food record questionnaire at enrollment. Anthropometric values, blood pressure, blood metabolic variables, and estimated liver fat were measured at baseline and at 6-year follow-up.
Design:Prospective cohort study.
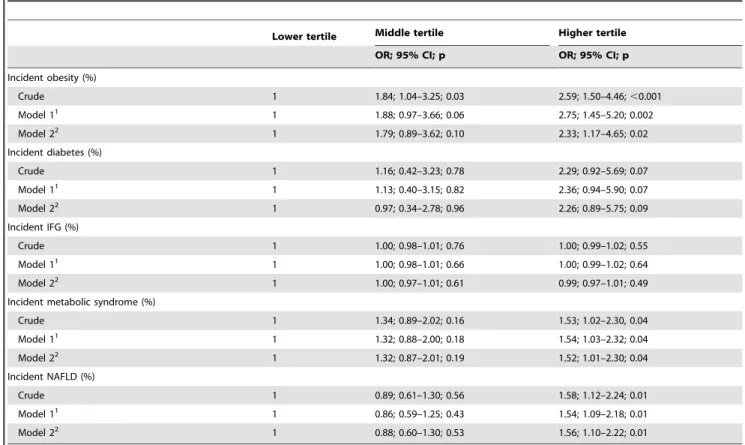
Results:Subjects were divided according to tertiles of percent daily caloric intake at dinner. A significant increase in the incidence rate of obesity (from 4.7 to 11.4%), metabolic syndrome (from 11.1 to 16.1%), and estimated NAFLD (from 16.5 to 23.8%) was observed from the lower to higher tertile. In a multiple logistic regression model adjusted for multiple covariates, subjects in the highest tertile showed an increased risk of developing obesity (OR = 2.33; 95% CI 1.17–4.65; p = 0.02), metabolic syndrome (OR = 1.52; 95% CI 1.01–2.30; p = 0.04), and NAFLD (OR = 1.56; 95% CI 1.10–2.22; p = 0.01).
Conclusions:Consuming more of the daily energy intake at dinner is associated with an increased risk of obesity, metabolic syndrome, and NAFLD.
Citation:Bo S, Musso G, Beccuti G, Fadda M, Fedele D, et al. (2014) Consuming More of Daily Caloric Intake at Dinner Predisposes to Obesity. A 6-Year Population-Based Prospective Cohort Study. PLoS ONE 9(9): e108467. doi:10.1371/journal.pone.0108467
Editor:Marc Claret, Institut d’Investigacions Biome`diques August Pi i Sunyer, Spain
ReceivedJanuary 13, 2014;AcceptedAugust 29, 2014;PublishedSeptember 24, 2014
Copyright:ß2014 Bo et al. This is an open-access article distributed under the terms of the Creative Commons Attribution License, which permits unrestricted use, distribution, and reproduction in any medium, provided the original author and source are credited.
Funding:This study was supported by a grant from: Regione Piemonte, 2009. The funders had no role in study design, data collection and analysis, decision to publish, or preparation of the manuscript.
Competing Interests:The authors have declared that no competing interests exist.
* Email: [email protected]
Introduction
A novel, intriguing hypothesis suggests it is not what you eat, but when you eat that plays a role in weight balance. Breakfast skipping has been associated with weight gain and obesity, dyslipidemia, diabetes and cardiovascular diseases in adults [1– 4]. Breakfast skippers usually make less healthy food choices compared to breakfast consumers and overcompensate the intake of energy during the day [5]. However, a recent study did not confirm these findings [6]. The current trend for adults is to eat very little in the morning and shift most of the caloric intake later in the day [7]. Emerging evidence shows a relationship between the timing of food intake during the day and weight regulation in animals [8–10]. In humans, shifting food ingestion toward the night has been shown to disrupt metabolic homeostasis and raise postprandial triglycerides [11]. Furthermore, two cross-sectional studies in adults found an increased risk of overweight and obesity when more of the daily caloric intake was eaten in the evening
[12–13], but a prospective cohort study found no association between evening eating and weight change [14]. Yet, late-night eaters showed an increased coronary heart disease risk in a prospective US cohort [4]. No human studies have investigated the relationship between the time of eating and non-alcoholic fatty liver disease (NAFLD), the excessive liver fat accumulation closely associated with obesity and insulin resistance, that can be predicted by noninvasive tools [15].
Subjects and Methods
Participants and setting
All the 45–64 years old Caucasian patients (n= 1877) of six
general practitioners were invited to participate in a metabolic screening in 2001–2003. These subjects were representative of the age-corresponding population living in the province of Asti (Northwest Italy) [16]. Of these, 1658 (88.3%) subjects provided written informed consent to participate while 219 declined. Both the participants and non-participants were similar to the resident population of the corresponding age range in terms of male prevalence, education, prevalence of known diabetes, and residence in a rural area [16]. Patients with obesity (n= 315) or
type 2 diabetes (n= 94) at baseline, and those who died during the
follow-up (n= 61) were excluded. Since these conditions often
coexisted in the same individuals, 413 patients were excluded, and data from 1245 subjects were finally analyzed.
The study was approved by the local ethics committee (‘‘Comitato Etico Interaziendale A.S.O. SS.Antonio e Biagio e C.Arrigo’’ of Alessandria). All the procedures conformed to the principles of the Helsinki Declaration.
Measurements
In the morning, after at least 12 h of fasting, weight, height, waist circumference, and blood pressure were measured. Waist circumference was measured by a plastic tape meter at the level of the umbilicus. Two blood pressure measurements were performed using mercury sphygmomanometers and appropriate cuff sizes after a 10-minute rest in the sitting position; reported values are the means of the two measurements. A blood sample was drawn for the determination of glucose, insulin, total cholesterol, HDL-cholesterol, triglycerides, alanine aminotransferase (ALT), c -glutamyl transferase (GGT) and high-sensitivity C-reactive protein (CRP) values. If serum glucose was$110 mg/dl, a second fasting glucose determination was performed.
All patients were submitted to a health screening questionnaire at baseline, from July 2001 to September 2003. Data on smoking habits, alcohol consumption, educational level, health conditions, current medications (in particular drugs influencing glucose control and/or body weight, such as hypoglycemic drugs, insulin, antidepressant/antipsychotic, and estrogen/steroid use), mean weekly number of meals consumed in restaurants (including fast-food restaurants and pizzerias), and hours of sleep were collected for each subject. Sleep duration was defined as self-reported time in bed (calculated from bedtime to get up time) minus sleep latency. At baseline, patients completed the Minnesota Leisure Time Physical Activity questionnaire [17], previously validated in an European cohort [18], and the semi-quantitative food-frequency questionnaire used in the EPIC (European Prospective Investigation into Cancer and Nutrition) study [19]. The EPIC questionnaire assessed the average frequency and portion intake of 148 foods consumed in the 12 months prior to examination, but it did not evaluate the food distribution during the day. The frequency of food intake was assessed using ten categories, ranging from ‘‘never’’ to ‘‘five times per day or more’’, whereas quantity was determined comparatively using photographs of standard portion sizes. Contemporarily, at baseline, all subjects were submitted to a 3-day food record, which consisted of a detailed written food diary. Subjects were instructed to record everything they ate or drank during 2 consecutive week days and 1 week-end day [20]. The 53 food photos and measuring guides (cups, spoons, glasses, etc) of the EPIC questionnaire aided respondents in estimating the amount of foods or beverages consumed during the compilation of the 3-day food record. The temporal pattern of
food consumption was also recorded, as participants were asked to list foods eaten at breakfast, lunch, dinner, and during mid-morning, mid-afternoon, and after dinner. An instruction sheet defining each meal was given together with the food record: breakfast was defined as the meal consumed after waking up; the mid-morning meal as the food consumed after breakfast and before lunch in the morning (until 12 am), lunch as the meal consumed from 12 am to 3 pm, mid-afternoon meal as the food consumed after lunch before dinner, until 7 pm; dinner as the meal consumed from 7 pm to 10 pm; after-dinner meal as the food consumed after dinner until going to sleep. This was in line with the Italian habits.
We considered as dinner the eating occasion self-reported as dinner; skipping breakfast was defined when no consumption of any food for breakfast was reported.
When evaluating the frequency of eating occasions, we considered as eating occasion every episode with a caloric intake corresponding at least to the 15% of the total daily caloric intake [21].
A dietician, blinded to the study details, checked all question-naires for completeness, internal coherence, and plausibility. In case of uncertain answers, the patients were interviewed by the dietician. Overall, patient compliance was high, because of the collaboration with general practitioners, who supported the patients during the recall and collection of data.
The 3-day food record data were loaded on the Win Food Pro 3 software (Medimatica, Colonnella, Teramo, Italy), and the mean nutritional values for the 3 days were reported. The reliability of the reported energy intake was assessed by calculating the ratio of estimated energy intake to predicted basal metabolic rate using age- and sex-specific formulas derived by Schofield [22]. Subjects with a ratio,0.88 were classified as under-reporters [23].
The entire sample (n= 1658) was then divided into three
tertiles, according to percentage of daily caloric intake at dinner (the first tertile had the lowest dinner caloric intake,,33% of daily kcal; the third tertile the highest, $48% of daily kcal). These cutoffs divided the 1245 subjects evaluated in the final analysis into three groups of 423, 418, and 404 individuals, respectively.
The physical activity level was calculated as the product of the duration and frequency of each activity (in hours/week), weighted by an estimate of the metabolic equivalent of the activity (METS) and summed for the activities performed.
The laboratory methods have been described previously [16,24]. Glycated hemoglobin (HbA1c) values were evaluated by High Performance Liquid Cromatography (Tosoh, Turin, Italy). This is a standardized method, as certified by the International Federation of Clinical Chemistry and Laboratory Medicine. The correlation coefficient and coefficient of variation were, respec-tively, 0.9998 and 0.21%.
All samples were run blindly.
Follow-up
From January to November 2008, patients were contacted for follow-up visits. Weight, waist circumference and blood pressure were measured, and a blood sample was drawn for the determination of the same fasting metabolic parameters evaluated at baseline (see above). Since the visits were performed in collaboration with the general practitioners of the patients, we were able to contact all the patients.
Definitions
according to published recommendations [26]. In particular, a diagnosis of diabetes was made in the presence of fasting plasma glucose $126 mg/dl; only 3 patients presented the classic symptoms of hyperglycemia and a random plasma values $ 200 mg/dl. In line with the Harmonization definition, metabolic syndrome was defined by the presence of three of the following five components: waist circumference $94 cm (men) or $80 cm (women), triglycerides$150 mg/dl, HDL cholesterol,40.0 mg/ dl (men) or ,50.0 mg/dl (women), systolic blood pressure $ 130 mmHg and/or diastolic blood pressure$85 mmHg and/or antihypertensive drug therapy and fasting glucose$100 mg/dl or hypoglycemic therapy [27]. NAFLD was estimated with the NAFLD liver fat score, according to the following formula [15]:
NAFLD liver f at score
~{2:89z1:18metabolic syndrome yesð ~1=no~0Þ
z0:45type2diabetes yesð ~2=no~0Þ
z0:15fasting serum insulin mU=lð Þ
z0:04fasting serum AST U=lð Þ{0:94AST=ALT:
The estimated liver fat percentage was calculated with the liver fat [15]:
Liver f at %ð Þ~
10
{0:805z0:282metabolic syndrome yesð ~1=no~0Þ
z0:078type2diabetes yesð ~2=no~0Þ
z0:525Log fasting serum insulin mUð ½ =lÞ
z0:521Log fasting serum AST U=lð ½ Þ
{0:454Log AST=ALTð Þ
0
B B B B B B B B @
1
C C C C C C C C A
:
NAFLD was defined as .5% estimated liver fat percentage [15].
Statistical analyses
Because the distributions of alcohol intake, triglyceride, fasting insulin, HOMA-IR, ALT, GGT, CRP values, and NAFLD score were highly skewed, their values were log-transformed to obtain a normal distribution. In all analyses, the log-transformed values were then used. For ease of data interpretation, the untransformed values are reported in the tables.
The Friedman test was used to detect differences within individuals in the caloric intake at dinner across the 3 days of the food records.
The ANOVA and the x2-test were performed to assess the differences among tertiles of dinner caloric intake in the continuous and categorical variables, respectively.
A multiple logistic regression analysis was used to estimate the odds of incident obesity and diabetes, IFG, the metabolic syndrome, and estimated NAFLD, each used as a dependent variable, with tertiles of dinner caloric intakes, used as a dummy variable. Both unadjusted (crude ORs) and adjusted models were carried out for each outcome variable. In the model 1, the following variables were introduced into the model: age (as a continuous variable), sex (males = 1/females = 0), BMI at baseline (as a continuous variable), METS h/week (as a continuous variable), living in a rural area (yes = 1/no = 0); in the model 2, all
the above described variables plus intake of total energy and SFA (both as continuous variables), and skipping breakfast (yes = 1/ no = 0) were introduced. Since the outcome incidence was evaluated in the living participants at the end of the follow-up during 2008, we were not able to obtain the date of the outcome incidence, and to perform a survival analysis.
The lower tertile of dinner caloric intake (the first tertile) was considered as the reference group, and the other two groups were introduced as dummy variables (STATISTICA software 5.1, Statsoft Italia).
Results
The mean caloric intake at dinner during the 3 days was 905.46485.4 kcal; the mean caloric intake from dinner was not significantly different during day 1, 2, and 3 (the latter was the week-end day): 901.1, 896.9, and 918.4 kcal, respectively. Out of 1245 subjects, 103 (8.3%) resulted under-reporters. Among the tertiles of caloric intake at dinner, the percentage of under-reporters did not differ (8.5%, 8.1%, and 8.2% in the first, second, and third tertile, respectively).
Baseline lifestyle and dietary characteristics according to the tertile of percentage of daily caloric intake at dinner are summarized in Table 1; clinical and laboratory values of the participants are reported in Table 2. Subjects in the first tertile were less likely to skip breakfast and consumed lower total energy and SFA, while percentage of calories from carbohydrates, protein, total fat and polyunsaturated fatty acids (PUFA), and fiber and alcohol intake did not differ from the other tertiles (Table 1). The dinner dietary composition, with the exception of total caloric intakes, did not differ among groups (Table 1). At baseline, no significant difference was found among tertiles for age, sex, educational level, drugs used, blood pressure and anthropo-metric values, laboratory variables, and prevalence of NAFLD, IFG, and the metabolic syndrome (Tables 1–2).
Mean follow-up period was 6.160.34 years (median 5.8 years). Subjects in the first tertile showed a significantly lower BMI and NAFLD prevalence, and a more favourable NAFLD score (Table 3). The incidence of obesity, diabetes, IFG, NAFLD, and metabolic syndrome were respectively: 101/1245 (8.1%), 30/1245 (2.4%), 286/1245 (23.0%), 229/1245 (18.4%), and 172/1245 (13.8%). The incidence of obesity significantly increased from the first to third tertile; the incidence of metabolic syndrome and estimated NAFLD were significantly higher in the upper tertile (Table 3). Individuals who consumed almost half of their daily caloric intake at dinner were 2-fold more likely to become obese in a multiple logistic regression model, after adjusting for age, sex, BMI at baseline, physical activity, living in a rural area, intake of total energy and SFA, and skipping breakfast (Table 4). In the same model, other variables were significantly associated with the incidence of obesity: the physical activity level expressed as METS h/week (OR = 0.94; 95% CI 0.91–0.97; p,0.001); percentage of SFA intake (OR = 1.10; 95% CI 1.03–1.18; p = 0.006); total energy (OR = 1.06; 95% CI 1.01–1.10; p = 0.005 for each 100 kcal increase); skipping breakfast (OR = 2.13; 95% CI 1.20–3.81; p = 0.01).
The incidence of the metabolic syndrome (OR = 1.52; 95% CI 1.01–2.30; p = 0.04) and the estimated NAFLD (OR = 1.56; 95% CI 1.10–2.22; p = 0.01) were significantly higher in the third tertile of daily caloric intake at dinner (Table 4).
HbA1c criteria, and the second and third tertiles were respectively: OR = 1.44 (95% CI 0.45–4.56; p = 0.54) and OR = 2.78 (95% CI 0.96–8.10; p = 0.06) in the adjusted model (model 2).
The results did not significantly change after excluding the 103 under-reporters or the 164 individuals who consumed foods after-dinner, and after adjusting for total fiber and alcohol intake, dinner nutrient intakes, restaurant food consumption, sleep duration, number of eating occasions, the follow-up period and use of hypoglycemic drugs, insulin, antidepressant/antipsychotic, and estrogen/steroid at follow-up.
Discussion
In our population-based prospective cohort of middle-aged individuals, energy intake at dinner was significantly associated with the incidence of obesity, metabolic syndrome, and estimated NAFLD. Subjects consuming the largest amount of calories at dinner (‘‘big dinner’’) were almost one third of our sample, in line with the literature [12,14]. After a 6-year follow-up, those individuals were 2-fold more likely to be obese. This association Table 1.Baseline lifestyle and dietary characteristics by the percentage of total daily caloric intake from dinner.
Lower tertile Middle tertile Higher tertile
Number 423 418 404
% total kcal from dinner ,33 33–48 $48
Physical activity (METS h/week)1 22.4
69.6 21.268.9 21.369.1
Actual smoking (%) 24.6 24.2 23.3
Hours sleep/day1 7.2
61.1 7.161.2 7.161.2
Antidepressant use (%) 4.0 2.6 3.5
Restaurant foods.3/week 2.4 2.9 3.9
Skipping breakfast (%) 7.8 28.7a 22.3a
After-dinner eating (%) 13.2 12.9 13.4
Kcal from after-dinner eating1 100.3
615.7 104.0636.9 105.6637.9
Frequency of eating occasions2
1 2.4 2.9 2.5
2 14.9 13.9 12.6
3 47.5 48.8 47.3
4 12.3 12.7 13.9
$5 22.9 21.8 23.8
Total intakes
Total kcal1 2053.96657.3 2165.56631.5b 2132.76677.7
Carbohydrates (% kcal)1 48.9
67.3 48.866.6 48.467.4
Protein (% kcal)1 16.3
62.9 16.162.3 16.262.5
Fat (% kcal)1 34.7
66.0 34.865.6 35.466.0
SFA (% kcal)1 11.8
63.0 11.962.9 12.363.7b
PUFA (% kcal)1 4.3
61.6 4.261.5 4.361.4
Fiber (g/day)1 21.7
610.5 21.068.1 21.069.8
Alcohol (g/day)3 10.0 (30.0) 5.0 (30.0) 10.0 (20.0)
Dinner intakes
Kcal1 522.4
6236.3 860.16284.1a 1353.4
6477.5a
Variance of kcal from dinner 55849.7 80718.3 227985.4
Protein (% kcal)1 18.7
63.0 18.662.3 18.662.6
Fat (% kcal)1 35.5
66.0 35.665.6 36.266.0
Fiber (g/1000 kcal)1 4.6
61.8 4.561.6 4.661.7
Therapy
Estrogen/steroid drugs (%) 5.9 6.2 6.2
Antidepressant/antipsychotic drugs (%) 4.0 2.6 3.5
Oral hypoglycemic drugs/insulin (%) 0 0 0
1mean
6SD.
2eating occasion = every episode with
$15% of the total daily caloric intake. 3median (inter-quartile range).
ap
,0.01 vs tertile 1; bp
,0.05 vs tertile 1; p-values were evaluated by ANOVA or chi-square-test.
remained significant after adjusting for the intake of energy, SFA and fiber, exercise, skipping breakfast, and other covariates.
Timing of meals and obesity
A few cross-sectional studies have shown that assuming more of the daily energy intake in the evening is associated with an increased risk of overweight and obesity [12–13,28–29] while consuming more of the daily calories at lunch or breakfast [12,28,30] are inversely associated. A large prospective cohort study found that both skipping breakfast and eating late at night are related to an increased risk of coronary heart disease. This was intriguing since 76% of late-eaters had breakfast [4]. It has been hypothesized that the timing of the meal may be a proxy for healthy lifestyle habits and/or for consuming specific foods, like high-fat foods at dinner or high-fiber foods at breakfast [4,31]. Eating in the late evening seems to have a lower satiety value than eating in the morning [31]. Nevertheless, in our cohort, there were no differences among groups for dietary pattern at dinner, as well as exercise, smoking, sleep duration and alcohol intake.
Timing of food intake seem to play a role also in weight loss strategies: late lunch eaters lost less weight than early eaters [32];
overweight/obese women with metabolic syndrome lost signifi-cantly more weight after a low-calorie dinner weight-loss program than after an isocaloric high-calorie dinner program [33].
Not all studies confirmed the direct association between weight and food intake at dinner [14,34]. Yet, a positive association between percentage of evening energy intake and long-term weight change was evident in specific subgroups (smoking men, physically active men, inactive women) in a prospective US cohort [14].
Many hypotheses have been suggested to explain the association between the timing of meals and obesity risk. Insulin sensitivity has been reported to decrease later in the day [35]. Increased levels of free fatty acids, fluctuation in cortisol concentrations, increased urinary epinephrine levels, higher morning ACTH plasma values, and/or a delayed peak in the counteracting activity of glucagon after evening meals may be possible contributors to the circadian modulation of insulin secretion or action [11,34,35–39]. Diet-induced thermogenesis is significantly higher after the consump-tion of a snack in the morning than after the consumpconsump-tion of the same snack at night [40], and a reduced evening thermic response may be due to the nocturnal insulin resistance [41]. Habitual Table 2.Baseline clinical and laboratory characteristics by the percentage of total daily caloric intake from dinner.
Lower tertile Middle tertile Higher tertile
Number 423 418 404
Age (years)1 54.4
65.7 54.565.7 54.165.6
Males (%) 47.5 45.0 45.3
Education (%)
Secondary school 19.4 17.5 19.3
Graduated 9.0 8.4 9.2
Living in a rural area (%) 40.9 40.0 36.9
Systolic blood pressure (mmHg)1 131.6
615.4 132.3615.9 131.0614.9
Diastolic blood pressure (mmHg)1 81.7
68.2 82.669.7 81.968.8
BMI (kg/m2)1 24.6
62.9 24.962.7 24.962.9
Waist circumference (cm)1 86.8
610.9 87.669.9 87.5610.6
Fasting glucose (mg/dl)1 99.4
620.1 99.5618.2 101.0623.8
HbA1c (%) 5.0460.45 5.0760.44 5.0960.47
Triglycerides (mg/dl)2 113.0 (63.0) 107.0 (69.0) 113.0 (67.0)
Total cholesterol (mg/dl)1 219.4
640.1 213.7642.0 218.0640.3
HDL cholesterol (mg/dl)1 62.4
614.1 61.2613.0 61.4613.5
Fasting insulin (mU/ml)2 6.7 (1.8) 6.6 (1.7) 6.7 (2.3)
HOMA-IR score (mmol/l6mU/ml)2 1.6 (0.6) 1.6 (0.6) 1.6 (0.7)
ALT (UI/l)2 17.0 (12.0) 18.0 (13.0) 17.5 (11.0)
GGT (UI/l)2 17.0 (17.0) 17.0 (13.0) 17.0 (16.0)
NAFLD score2
23.0 (1.4) 22.9 (1.3) 22.9 (1.4)
Prevalent NAFLD3(%) 10.7 7.5 9.3
CRP (mg/l)2 1.1 (1.6) 1.0 (1.6) 1.2 (1.7)
IFG (%) 10.4 13.9 14.9
Metabolic syndrome (%) 27.9 30.9 29.7
1mean
6SD.
2median (inter-quartile range). 3NAFLD was defined as
.5% estimated liver fat percent [15]. ap
,0.01 vs tertile 1; bp
,0.05 vs tertile 1; p-values were evaluated by ANOVA or chi-square-test.
Homeostasis model assessment of insulin resistance (HOMA-IR); alanine aminotransferase (ALT);c-glutamyl transferase (GGT); non-alcoholic fatty liver disease (NAFLD); C-reactive protein (CRP); impaired fasting glucose (IFG).
nighttime eating or snacking have been associated with reduced fat oxidation, potentially promoting weight gain [42–43]. Addition-ally, morning gastric emptying may be more rapid than evening gastric emptying [44], and an increased efficacy of absorption of dietary carbohydrates has been demonstrated under late supper-time conditions [45]. Circadian variations in satiety hormones, energy expenditure, and genetic mutations of the circadian clock genes have been associated with weight gain and metabolic abnormalities in mice [8–10,46], as well as humans [32,47].
Timing of meals and the metabolic syndrome
Eating habits have been associated with the development of insulin resistance and the metabolic syndrome [2–3,48–49]. In a small randomized crossover trial, healthy adults showed signifi-cantly higher blood values of glucose, insulin, and triglycerides after night meals compared to the ingestion of the same meals during the day [11], thus supporting the well known association between shift work and increased cardiovascular disease and
metabolic risk [50–51]. These associations seem to be related to the disruption of circadian rhythms leading to worsen the physiological nocturnal decrease of glucose tolerance and adverse metabolic and cardiovascular consequences [35,52]. Accordingly, in our cohort, individuals consuming a big dinner showed a 1.5-fold higher incidence of metabolic syndrome and a 2-1.5-fold higher incidence of diabetes at follow-up; the low number of incident cases of diabetes (30/1245) probably did not allow us to observe a significant associations.
The relationships between caloric intake from dinner and obesity or metabolic syndrome were attenuated after adjusting for breakfast skipping, a condition associated with an increased prevalence of obesity and metabolic diseases [1–4,53]. In our cohort, breakfast skippers more frequently consumed a big dinner and showed a 2-fold higher risk of incident obesity.
Even though eating behaviors are highly inter-related, consum-ing a big dinner and skippconsum-ing breakfast were both independently associated with incident obesity and metabolic syndrome in a Table 3.Characteristics at follow-up by the percentage of total daily caloric intake from dinner.
Lower tertile Middle tertile Higher tertile
Number 423 418 404
Systolic blood pressure (mmHg)1 132.9
616.1 132.8617.8 132.4615.7
Diastolic blood pressure (mmHg)1 81.8
68.8 82.569.2 81.469.2
BMI (kg/m2)1 24.8
63.1 25.263.0a 25.5
63.2b
Waist circumference (cm)1 88.6
610.9 89.2610.4 89.4610.5
Fasting glucose (mg/dl)1 97.7
621.1 97.4613.7 99.9620.3
HbA1c (%) 5.0360.72 5.0360.50 5.1160.71
Triglycerides (mg/dl)2 109.0 (66.0) 106.0 (73.0) 113.0 (68.0)
Total cholesterol (mg/dl)1 220.7
639.7 217.7639.3 224.4641.5
HDL cholesterol (mg/dl)1 58.7
615.2 56.6614.6 58.0614.7
Fasting insulin (mU/ml)2 6.5 (5.3) 7.3 (4.9) 6.8 (5.2)
HOMA-IR score (mmol/l6mU/ml)2 1.5 (1.2) 1.7 (1.2) 1.6 (1.2)
ALT (UI/l)2 20.0 (11.0) 22.0 (13.0) 22.0 (14.0)
GGT (UI/l)2 21.0 (19.0) 21.0 (15.0) 22.0 (21.0)
NAFLD score2
21.7 (1.9) 21.3 (1.8) 21.2 (2.0)a
Prevalent NAFLD3(%) 20.4 17.8 28.2b
CRP (mg/l)2 1.0 (1.0) 1.0 (1.7) 1.0 (1.5)
Incident obesity (%) 4.7 8.4a 11.4b
Incident diabetes (%) 1.7 1.9 3.7
Incident IFG (%) 22.2 22.5 24.3
Incident NAFLD4(%) 16.5 15.0 23.8a
Incident metabolic syndrome (%) 11.1 14.4 16.1a
Therapy
Estrogen/steroid drugs (%) 6.1 6.0 6.2
Antidepressant/antipsychotic drugs (%) 4.3 2.9 3.9
Oral hypoglycemic drugs/insulin (%) 1.2 1.4 2.5
1mean
6SD.
2median (inter-quartile range). 3NAFLD was defined as
.5% estimated liver fat percent [15].
4incident NAFLD was not equal to the difference between prevalent NAFLD at follow-up minus prevalent NAFLD at baseline, since some individuals whose estimated liver fat percent at baseline was.5%, showed a,5% liver fat percent at follow-up, i.e. their metabolic pattern ameliorated during follow-up.
ap
,0.05 vs tertile 1; bp
,0.01 vs tertile 1; p-values were evaluated by ANOVA or chi-square-test.
Homeostasis model assessment of insulin resistance (HOMA-IR); alanine aminotransferase (ALT);c-glutamyl transferase (GGT); non-alcoholic fatty liver disease (NAFLD); C-reactive protein (CRP); impaired fasting glucose (IFG).
multiple logistic regression analysis, without reciprocal interference in our cohort.
Timing of meals and NAFLD
We found that the timing of food intake during the day affected liver fat accumulation and the risk of developing NAFLD, the most common chronic liver disease and an emerging cardio-metabolic risk factor. The exact molecular mechanisms underlying this association are still to be elucidated. A recent metabolomic study discloses extensive and coordinate clock-controlled oscillations of many metabolites, including those within the amino-acid, carbo-hydrate and lipid metabolic pathways [54]. Other studies are warranted to investigate molecular basis of the interaction between different nutrients and the endogenous metabolic clock in the liver.
Limitations and strengths
The limitations of a follow-up study are due to competitive risks existing during the follow-up time. We have not evaluated the presence of night eating syndrome; however, we have reduced the possibility of introducing this bias by excluding obese individuals at baseline. Furthermore, the hours of sleep and the percentage of post-dinner eating individuals did not differ among the groups. Our results may be culture-specific and might not be applicable to cultures with different temporal distribution of food intake over the day. Measurement errors are known to be associated with all dietary questionnaires, and underestimation of energy intake seems to be greater in obese individuals [13,28]. We have excluded
obese individuals at baseline, and therefore our prevalence of underreporting was lower than in literature [55]. A 3-day food record may be inadequate to evaluate the individual usual eating patterns. However, it is usually employed to characterize dietary habits of groups of individuals [55]. Furthermore, the compara-bility of our data with other Italian data [55] is reassuring, although it is not sufficient to establish the validity of the data. The possibility of residual confounding factors cannot be excluded, due to the observational study design. Finally, our results cannot be extended to obese individuals.
This was a prospective study providing extensive and complete clinical measures as well as data on different lifestyle conditions with which to explore confounders and mediators of the associations under investigation.
Conclusions
A better understanding of the mechanisms of weight gain could have important implications for developing new strategy to counteract the obesity epidemic. The timing of energy intake is a modifiable lifestyle habit that might impact on the incidence of obesity, metabolic syndrome, and NAFLD. Intervention trials are needed to evaluate the opportunity to include in dietary recommendations advice on the time-of-day for food consump-tion, besides advice on food quality and quantity.
Table 4.Association between outcomes at follow-up (dependent variables) and the percentage of total daily caloric intake from dinner in multiple logistic regression models.
Lower tertile Middle tertile Higher tertile
OR; 95% CI; p OR; 95% CI; p
Incident obesity (%)
Crude 1 1.84; 1.04–3.25; 0.03 2.59; 1.50–4.46;,0.001
Model 11 1 1.88; 0.97–3.66; 0.06 2.75; 1.45–5.20; 0.002
Model 22 1 1.79; 0.89–3.62; 0.10 2.33; 1.17–4.65; 0.02
Incident diabetes (%)
Crude 1 1.16; 0.42–3.23; 0.78 2.29; 0.92–5.69; 0.07
Model 11 1 1.13; 0.40–3.15; 0.82 2.36; 0.94–5.90; 0.07
Model 22 1 0.97; 0.34–2.78; 0.96 2.26; 0.89–5.75; 0.09
Incident IFG (%)
Crude 1 1.00; 0.98–1.01; 0.76 1.00; 0.99–1.02; 0.55
Model 11 1 1.00; 0.98–1.01; 0.66 1.00; 0.99–1.02; 0.64
Model 22 1 1.00; 0.97–1.01; 0.61 0.99; 0.97–1.01; 0.49
Incident metabolic syndrome (%)
Crude 1 1.34; 0.89–2.02; 0.16 1.53; 1.02–2.30, 0.04
Model 11 1 1.32; 0.88–2.00; 0.18 1.54; 1.03–2.32; 0.04
Model 22 1 1.32; 0.87–2.01; 0.19 1.52; 1.01–2.30; 0.04
Incident NAFLD (%)
Crude 1 0.89; 0.61–1.30; 0.56 1.58; 1.12–2.24; 0.01
Model 11 1 0.86; 0.59–1.25; 0.43 1.54; 1.09–2.18; 0.01
Model 22 1 0.88; 0.60–1.30; 0.53 1.56; 1.10–2.22; 0.01
1Model 1: multiple logistic regression model, after adjustment for age, sex, BMI at baseline, METS h/week, living in a rural area.
2Model 2: multiple logistic regression model, after adjustment for age, sex, BMI at baseline, METS h/week, living in a rural area, intake of total energy and saturated fat, and skipping breakfast.
Author Contributions
Conceived and designed the experiments: SB MC. Performed the experiments: SB MC. Analyzed the data: GM MF RG MD EG. Wrote the paper: SB GM MD EG MC. Interpretation of the findings: SB GM GB
MF DF RG LG MD EG MC. Revision of the manuscript: SB GM GB MF DF RG LG MD EG MC. Approvation of the manuscript: SB GM GB MF DF RG LG MD EG MC.
References
1. Timlin MT, Pereira MA (2007) Breakfast frequency and quality in the etiology of adult obesity and chronic diseases. Nutr Rev 65: 268–281.
2. Farshchi HR, Taylor MA, Macdonald IA (2005) Deleterious effects of omitting breakfast on insulin sensitivity and fasting lipid profiles in healthy lean women. Am J Clin Nutr 81: 388–396.
3. Mekary RA, Giovannucci E, Willett WC, van Dam RM, Hu FB (2012) Eating pattern and type 2 diabetes risk in men: breakfast omission, eating frequency, and snacking. Am J Clin Nutr 95: 1182–1189.
4. Cahill LE, Chiuve SE, Mekary RA, Jensen MK, Flint AJ, et al. (2013) Prospective study of breakfast eating and incident coronary heart disease in a cohort of male US health professionals. Circulation 128: 337–343.
5. De Castro JM (2009) When, how much and what foods are eaten are related to total daily food intake. Br J Nutr 102: 1228–1237.
6. Levitsky DA, Pacanowski CR (2013) Effect of skipping breakfast on subsequent energy intake. Physiol Bev 119: 9–16.
7. Almoosawi S, Winter J, Prynne CJ, Hardy R, Stephen AM (2012) Daily profiles of energy and nutrient intakes: are eating profiles changing over time? Eur J Clin Nutr 66: 678–686.
8. Arble DM, Bass J, Laposky AD, Vitaterna MH, Turek FW (2009) Circadian timing of food intake contributes to weight gain. Obesity 17: 2100–2102. 9. Fonken LK, Workman JL, Walton JC, Weil ZM, Morris JS, et al. (2010) Light at
night increases body mass by shifting the time of food intake. Proc Natl Acad Sci 107: 18664–18669.
10. Bray MS, Tsai JY, Villegas-Montoya C, Boland BB, Blasier Z, et al. (2010) Time-of-day-dependent dietary fat consumption influences multiple cardiometa-bolic syndrome parameters in mice. Int J Obes 34: 1589–1598.
11. Al-Naimi S, Hampton SM, Richard P, Tzung C, Morgan LM (2004) Postprandial metabolic profiles following meals and snacks eaten during simulated night and day shift work. Chronobiol Intern 21: 937–947. 12. Wang JB, Patterson RE, Ang A, Edmond JA, Shetty N, et al. (2014) Timing of
energy intake during the day is associated with the risk of obesity in adults. J Hum Nutr Diet 27 Suppl 2: 255–262.
13. Berte´us Forslund H, Lidroos AK, Sjo¨stro¨m L, Lissner L (2002) Meal patterns and obesity in Swedish women –a simple instrument describing usual meal types, frequency and temporal distribution. Eur J Clin Nutr 56: 740–747. 14. Kant AK, Schatzkin A, Ballard-Barbash R (1997) Evening eating and
subsequent long-term weight change in a national cohort. Int J Obes 21: 407– 412.
15. Kotronen A, Peltonen M, Hakkarainen A, Sevastianova K, Bergholm R, et al. (2009) Prediction of non-alcoholic fatty liver disease and liver fat using metabolic and genetic factors. Gastroenterology 137: 865–872.
16. Bo S, Gentile L, Ciccone G, Baldi C, Benini L, et al. (2005) The metabolic syndrome and high C-reactive protein: prevalence and difference by sex in a southern-European population-based cohort. Diabetes Metab Research Rev 21: 515–524.
17. Taylor HL, Jacobs DR Jr, Schucker B, Knudsen J, Leon AS, et al. (1978) Questionnaire for the assessment of leisure time physical activities. J Chronic Diseases 31: 741–755.
18. Elosua R, Marrugat J, Molina L, Pons S, Pujol E (1994) Validation of the Minnesota Leisure Time Physical Activity Questionnaire in Spanish men. The MARATHOM Investigators. Am J Epidemiol 139: 1197–1209.
19. Kroke A, Klipstein-Grobusch K, Voss S, Moseneder J, Thielecke F, et al. (1999) Validation of a self-administered food-frequency questionnaire administered in the European Prospective Investigation into Cancer and Nutrition (EPIC) study: comparison of energy, protein, and macronutrient intakes estimated with the doubly labeled water, urinary nitrogen, and repeated 24-h dietary recall methods. Am J Clin Nutr 70: 439–447.
20. Bo S, Ciccone G, Durazzo M, Gambino R, Massarenti P, et al. (2007) Efficacy of antioxidant treatment in reducing resistin serum levels: A randomized study. PLoS Clin Trials 2: e17.
21. Gregori D, Foltran F, Ghidina M, Zobec F, Ballali S, et al. (2011) The ‘‘snacking child’’ and its social network: some insights from an italian survey. Nutr J 10: 132.
22. Schofield WN (1985) Predicting basal metabolic rate, new standards and review of previous work. Hum Nutr Clin Nutr 39 (Suppl 1): 5–41.
23. Goldberg GR, Black AE, Jebb SA, Cole TJ, Murgatroyd PR, et al. (1991) Critical evaluation of energy intake data using fundamental principles of energy physiology: 1. Derivation of cut-off limits to identify under-recording. Eur J Clin Nutr 45: 569–581.
24. Bo S, Durazzo M, Guidi S, Carello M, Sacerdote C, et al. (2006) Dietary magnesium and fiber intake, inflammatory and metabolic parameters in middle-aged subjects from a population-based cohort. Am J Clin Nutr 84: 1062–1069. 25. Matthews DR, Hosker JP, Rudenski AS, Naylor BA, Treacher DF, et al. (1985) Homeostasis model assessment: insulin resistance andb-cell function from
fasting plasma glucose and insulin concentrations in man. Diabetologia 28: 412– 419.
26. American Diabetes Association (2012) Diagnosis and classification of diabetes mellitus. Diabetes Care 35: S64–S71.
27. Alberti KGMM, Eckel RH, Grundy SM, Zimmet PZ, Cleeman JI, et al. (2009) Harmonizing the metabolic syndrome. Circulation 120: 1640–1645. 28. Berg C, Lappas G, Wolk A, Strandhagen E, Tore´n K, et al. (2009) Eating
patterns and portion size associated with obesity in a Swedish population. Appetite 52: 21–26.
29. Baron KG, Reid KJ, Kern AS, Zee PC (2011) Role of sleep timing in caloric intake and BMI. Obesity 19: 1374–1381.
30. Summerbell CD, Moody RC, Shanks J, Stock MJ, Geissler C (1996) Relationship between feeding pattern and body mass index in 220 free-living people in four age groups. Eur J Clin Nutr 50: 513–519.
31. de Castro JM (2004) The time of food intake influences overall intake in humans. J Nutr 134: 104–111.
32. Garaulet M, Go´mez-Abella´n P, Alburquerque-Be`jar JJ, Lee YC, Ordova´s JM, et al. (2013) Timing of food intake predicts weight loss effectiveness. Int J Obes 37: 604–611.
33. Jakubowicz D, Barnea M, Wainstein J, Froy O (2013) High caloric intake at breakfast vs dinner differentially influences weight loss of overweight and obese women. Obesity 21: 2504–2512.
34. Keim NL, Van Loan MD, Horn WF, Barbieri TF, Mayclin PL (1997) Weight loss is greater with consumption of large morning meal and fat-free mass is preserved with large evening meals in women on a controlled weight reduction regimen. J Nutr 127: 75–82.
35. Van Cauter E, Desir D, Decoster C, Fery F, Balasse EG (1989) Nocturnal decrease of glucose tolerance during constant glucose infusion. J Clin Endocrinol Metab 69: 604–611.
36. Van Cauter E, Shapiro ET, Tillil H, Polonsky KS (1992) Circadian modulation of glucose and insulin responses to meals: relationship to cortisol rhythm. Am J Physiol 262: E467–E475.
37. Van Cauter E, Refetoff S (1985) Multifactorial control of the 24-hour secretion profiles of pituitary hormones. J Endocrinol Invest 8: 381–391.
38. Goetz F, Bishop J, Halberg F, Sothern RB, Brunning R, et al. (1976) Timing of single daily meal influences relations among human circadian rhythms in urinary cycle AMP and hemic glucagon, insulin and iron. Experientia 32: 1081–1084. 39. Lucassen EA, Zhao X, Rother KI, Mattingly MS, Courville AB, et al. (2013)
Evening chronotype is associated with changes in eating behaviour, more sleep apnea, and increased stress hormones in short sleeping obese individuals. PLoS One 8: e56519.
40. Romon M, Edme JL, Boulenguez C, Lescroart JL, Fritmat P (1993) Circadian variation of diet-induced thermogenesis. Am J Clin Nutr 57: 476–480. 41. Ravussin E, Acheson KJ, Vernet O, Danforth E, Je´quier E (1985) Evidence that
insulin resistance is responsible for the decreased thermic effect of glucose in human obesity. J Clin Invest 76: 1268–1273.
42. Gluck ME, Venti CA, Salbe AD, Votruba SB, Krakoff J (2011) Higher 24-h respiratory quotient and higher spontaneous physical activity in nighttime eaters. Obesity 19: 319–323.
43. Hibi M, Masumoto A, Naito Y, Kiuchi K, Yoshimoto Y, et al. (2013) Nighttime snacking reduces whole body fat oxidation and increases LDL cholesterol in healthy young women. Am J Physiol Regul Integr Comp Physiol 304: R94– R101.
44. Goo RH, Moore JG, Greenberg E, Alazraki HP (1987) Circadian variation in gastric emptying of meals in humans. Gastroenterology 93: 515–518. 45. Tsuchida Y, Hata S, Sone Y (2013) Effects of a late supper on digestion and the
absorption of dietary carbohydrates in the following morning. J Physiol Anthropol 32: 9.
46. Turek FW, Joshu C, Kohsaka A, Lin E, Ivanova G, et al. (2005) Obesity and metabolic syndrome in circadian Clock mutant mice. Science 308: 1043–1045. 47. Garaulet M, Lee YC, Shen J, Parnell LD, Arnett DK, et al. (2009) CLOCK genetic variation and metabolic syndrome risk: modulation by monounsaturated fatty acids. Am J Clin Nutr 90: 1466–1475.
48. Jenkins DJ, Wolever TM, Vuksan V, Brighenti F, Cunnane SC, et al. (1989) Nibbling versus gorging: metabolic advantages of increased meal frequency. N Engl J Med 321: 929–934.
49. Almoosawi S, Prynne CJ, Hardy R, Stephen AM (2013) Time-of-day and nutrient composition of eating occasions: prospective association with the metabolic syndrome in the 1946 British birth cohort. Int J Obes 37: 725–731. 50. Knuttson A, A˚ kerstedt T, Jonsson BG, Orth-Gomer K (1986) Increased risk of
ischaemic heart disease in shift workers. Lancet i: 89–91.
52. Scheer FAJL, Hilton MF, Mantzoros CS, Shea SA (2009) Adverse metabolic and cardiovascular consequences of circadian misalignment. Proc Natl Acad Sci 106: 4453–4458.
53. Leidy HJ, Ortinau LC, Douglas SM, Hoertel HA (2013) Beneficial effects of a higher-protein breakfast on the appetitive, hormonal, and neural signals controlling energy intake regulation in overweight/obese, ‘‘breakfast-skipping’’, late adolescents girls. Am J Clin Nutr 97: 677–688.
54. Eckel-Mahan KL, Patel VR, Mohney RP, Vignola KS, Baldi P, et al. (2012) Coordination of the transcriptome and metabolome by the circadian clock. Proc Natl Acad Sci USA 109: 5541–5546.