1
Universidade Federal de Minas Gerais, Escola de Enfermagem, Programa de Pós-Graduação em Enfermagem. Belo Horizonte, MG, Brasil.
2
Universidade Federal de Minas Gerais, Escola de Enfermagem, Curso de Gestão em Serviços de Saúde. Belo Horizonte, MG, Brasil.
3
Universidade Federal de Minas Gerais, Escola de Enfermagem, Departamento de Enfermagem Aplicada. Belo Horizonte, MG, Brasil.
4
Universidade Federal de Minas Gerais, Escola de Enfermagem, Departamento de Nutrição. Av. Prof. Alfredo Balena, 190, Santa Efigênia, 30130-100, Belo Horizonte, MG, Brasil. Correspondência para/Correspondence to: SCL PEREIRA. E-mail: <[email protected]>.
Soup kitchen users
’
social representations
of healthy eating associated with their
household food security status
Representações sociais de usuários de restaurantes
populares sobre alimentação saudável associadas
à sua condição domiciliar de (in)segurança alimentar
Isabel Cristina BENTO1 Fernanda Martins SOBRINHO2 Mery Natali Silva ABREU3 Maria Flávia GAZZINELLI3 Simone Cardoso Lisboa PEREIRA4
A B S T R A C T
Objective
To verify whether what users of soup kitchens in Belo Horizonte, Minas Gerais, Brazil, think about a healthy diet and the challenges they face to eat healthy are associated with their household food security status.
Methods
This cross-sectional study included 1,656 users of soup kitchens in Belo Horizonte. Socioeconomic and household food security data, and healthy-eating discourses were collected by a semi-structured questionnaire. The data were submitted to descriptive analyses for constructing frequency distribution tables, and to univariate analysis. Discourse analysis was based on the social representation theory.
Results
make. Food-insecure users intended to eat more fruits, non-starchy vegetables, and other foods (34.4%). The main obstacles food-secure and food-insecure users face to adopt a healthier diet are lack of time (82.9%) and low income (53.5%), respectively (p<0.001).
Conclusion
What users of soup kitchens in Belo Horizonte think about food and the obstacles they face to adopt a healthier diet are related to their household food security status. The results provide valuable data for effective proposals of food and nutrition education, which should act on the producers of subjectivity in this group and consider this group’s food and nutrition security status.
Keywords: Collective feeding. Food and nutrition security. Food habits. Nutrition programs and policies.
R E S U M O
Objetivo
Verificar a associação entre a forma como os usuários dos restaurantes populares de Belo Horizonte, Minas Gerais, pensam sobre alimentação saudável, bem como as dificuldades para adotá-la; e a sua condição domiciliar de (in)segurança alimentar.
Métodos
Estudo transversal conduzido com 1.656 usuários dos restaurantes populares de Belo Horizonte. A coleta de dados, com emprego de um questionário semiestruturado, contemplou a situação socioeconômica, a condição domiciliar de (in)segurança alimentar e discursos sobre alimentação saudável. Realizou-se análises descritivas para a construção de tabelas de distribuição de frequências e análise univariada. A análise dos discursos fundamentou-se nateoria das representações sociais.
Resultados
Cortar, reduzir, evitar, não comer, comer menos, diminuir carboidratos, gorduras, sal, carnes, bebidas diversas e outros alimentos é a mudança mais frequente (71,4%) que os usuários, em condição domiciliar de segurança alimentar, realizam ou pretendem realizar. Já para aqueles em condição domiciliar de insegurança alimentar é comer mais frutas, verduras, legumes e outros alimentos (34,4%). Para os usuários em segurança alimentar nutricional a dificuldade determinante é a falta de tempo (82,9%) e para aqueles em insegurança alimentar nutricional é a condição financeira (53,5%), p<0,001.
Conclusão
O que os usuários dos restaurantes populares de Belo Horizonte pensam sobre alimentação, bem como as dificuldades para se alimentar de maneira mais saudável, estão associadas à condição domiciliar de (in)segurança alimentar. Os resultados são subsídios relevantes para a elaboração de propostas educativas efetivas em alimentação e nutrição, que atuem sobre os dispositivos produtores de subjetividade desse público e que considere a sua situação de segurança alimentar e nutricional.
Palavras-chave: Alimentação coletiva. Segurança alimentar e nutricional. Hábitos alimentares. Programas e políticas de nutrição e alimentação.
I N T R O D U C T I O N
Nutrition transition is characterized by an increase in the prevalence of overweight and obesity and a decrease in the prevalence of nutritional deficiencies. This phenomenon involves changes in dietary and nutritional patterns,
increasing the population’s risk of chronic
non-communicable diseases1,2.
In the last years, these changes in Brazil were mostly characterized by a high intake of ultra-processed foods, which are high in carbohydrates, fats, and sodium, and nearly free of dietary fibers, and by a low intake of fruits
and non-starchy vegetables3.
This scenario weakens Brazilians’ food and
nutrition security, which is understood as the
permanent access to adequate amounts of quality foods without compromising access to other essential needs; nutrition security is founded on dietary practices that promote health, respect cultural diversity, and are culturally, economically,
environmentally, and socially sustainable”(p.4) 4.
One of the government’s strategies to
promote food and nutrition security and reduce the number of food-insecure people is the
Programa Restaurante Popular (Soup Kitchen
Program). This Program is recognized in Brazil and abroad as a successful public administration initiative, offering meals in large cities at very affordable prices5.
Nonetheless, eating healthy is challenging,
hindering individuals’ motivation to change their
dietary habits. Thus, individuals need help to make healthy food choices but to propose interventions that fit their reality, we must know what they think, what they know about food, and the
challenges they face to eat healthy6,7.
Food practices are influenced by sociocultural desires, meanings, values, attitudes, beliefs, symbols, and experiences located in the sphere
of social representations6. Knowing individuals’
social representations of eating habits may facilitate the creation of interventions that meet
their needs, improving their diet5. Social
representations of eating habits condition food practices6.
In face of the above, the objective of the present study was to determine whether what
users of soup kitchens in Belo Horizonte (MG)
think about a healthy diet and the obstacles they face to adopt it are associated with their household food security status.
By surveying the social representations of this target population, we will learn about their desire to improve their diet and about the obstacles they face to do so, and by determining whether these items are associates with this
population’s household food and nutrition security
status, we will uncover data that will allow planning more effective interventions. Education
actions require strategies that directly impact the subjects, allowing them to rethink and recreate their food habits in order to overcome barriers and consequently, eat healthier.
M E T H O D S
This analytical, cross-sectional study with a qualitative and quantitative approach surveyed male and female adults frequenting all the soup
kitchens in the municipality of Belo Horizonte from
October 2009 to June 2012.
These restaurants are part of a public social inclusion policy. They cater to a significant portion
of Belo Horizonte population, serving fourteen
thousand meals a day. These establishments are located in the downtown area of the city, close to mass transportation stations, or in suburban areas where the population is at social and nutritional risk. The following soup kitchens are
currently open in Belo Horizonte: Restaurante
Popular Herbert de Souza (RPI), Restaurante
Popular Josué de Castro (RPII), Restaurante
Popular Maria Regina Nabuco (RPIII), Restaurante
Popular Dom Mauro Bastos (RPIV), and Refeitório
Popular da Câmara Municipal João Bosco Murta
Lages (RPV). Establishments RPI, RPII, and RPIV
are located downtown, where neighborhoods’
Municipal Human Development Index (MHDI) vary greatly. The downtown area is considered a region of low social vulnerability. However, establishments RPII and RPIV are located in neighborhoods with low MHDI and high to extreme social vulnerability8,9.
The sample size was established by measuring the weekly flow because there are no records of soup kitchen users, only records of the number of meals sold daily. From this number we calculated the number of users in each of the
five establishments as follows10:
n0= 1 / (E0)2 (1)
n = N * n0 / (N + n0)(2)
Where: n0 = an initial estimate of the
users per day); E0 = sampling error of 5%, and n = sample size.
The estimated sample size for each establishment was as follows: RPI (n=382), RPII (n=380), RPIII (n=240), RPIV (n=331), and RPV (n=280), totaling 1,613 users. The calculation took into account the number of users frequenting each soup kitchen that would be representative of each establishment. In addition to calculating sample size, we decided to collect data by quotas,
respecting the users’ gender and age group
distribution and the number of meals sold in each establishment (breakfast, lunch, and supper). This method was used because it was not possible to
randomly select the interviewees10.
The inclusion criteria were: not to live in a household with another study participant; to be at least 18 years old; to be a regular user of soup
kitchens in Belo Horizonte; and to agree to
participate in the study by signing an Informed Consent Form. The study complied with the ethical regulations of Resolution nº 466/2012 of
the National Health Council11.
The users were interviewed while they waited for the soup kitchens to open. The interviewees were approached randomly but respecting the established gender and age proportions. The interviews were conducted by six trained students from the programs Nutrition and Health Service Management and by a master’s student of the graduate program Nursing/Health Education and Nursing. The data collection instrument was tested in a sample of users of one
of the food kitchens of Belo Horizonte. This test
resulted in the decision to use open questions in the interview because most participants used short discourses to answer the questions and because of the high similarity between the discourses written down during the interviews and the recorded and transcribed discourses, preserving the key expressions and the central ideas of the discourses.
The semi-structured questionnaire collected socioeconomic aspects, gender, age, education
level, occupation, socioeconomic class12, and
marital status. It also contained all the questions
in the Escala Brasileira de Insegurança Alimentar
(EBIA, Brazilian Scale of Food Insecurity)13 and the
following open questions: 1) “Have you changed or intend to change your diet?” 2) “How have you changed or intend to change your diet?” (only for those who answered question 1 affirmatively); 3) “Is it hard for you to eat healthier?”, and 4) “Why is it hard for you to eat healthier?” (only for those who answered question 3 affirmatively).
Socioeconomic class was classified according to the criteria provided by the 2008
Socioeconomic Survey of Instituto Brasileiro de
Opinião Pública e Estatística (Brazilian Institute of
Public Opinion and Statistics)12.
Food security status was determined by EBIA, validated for Brazil. EBIA estimates the level
of food security of a household13.The instrument
contains 15 closed questions with positive and negative answers regarding the food security level of a household, perceived by the family, in the three months that precede the interview. Each affirmative answer receives one point. The score ranges from zero to fifteen points, where zero represents food security; 1-5 points represent mild food insecurity; 6-10 points represent moderate food insecurity; and 11-15 points represent severe food insecurity. Each main question is followed by a question about the frequency of the event.
To delimit the social representations, the open questions of the questionnaire were digitalized, constituting the discourses. Later, the data were categorized and analyzed according to content similitude and expressed as frequencies. This technique involves selecting key expressions in each individual answer, which are the most significant excerpts of the answer. These key expressions correspond to central ideas that synthesize the content of the discourse. A single category of central ideas was attributed to each
discourse, covering all the key expressions14.
and behaviors. Their objective is to abstract sense of the world by introducing orders and
perceptions7. Moreover, as a particular form of
this guiding knowledge, social representations are socially created and shared knowledge forms that contribute to the construction of a common reality, allowing an individual to understand the
world and communicate therein15.
The data were digitized and organized in the software EpiData (EpiData Association, Adense, Dinamark) version 3.1.2. The statistical analyses were performed by the software Statistical Package for the Social Sciences (SPSS Inc., Chicago, Illinois, United States) for Windows, version 19.0. Descriptive analyses were performed to construct frequency distribution tables, and univariate analysis was conducted to measure the associations between the variables related to the social representations of healthy eating and
household food security status. The Pearson’s
Chi-square test was also used at a significance level of 5%.
The project “Prevalência domiciliar de
segurança/insegurança alimentar dos usuários dos restaurantes populares de Belo Horizonte - Minas
Gerais” (Prevalence of household food security
in users of soup kitchens in Belo Horizonte - Minas
Gerais) was approved by the Research Ethics
Committee of the Universidade Federal de
Mi-nas Gerais under Protocol nº 143/09. The project
to survey social representations in the same population was approved by the same committee under Protocol n° 0473.0.203.000-10.
R E S U L T S
A total of 1,656 users of soup kitchens in
Belo Horizonte participated in the study. Most
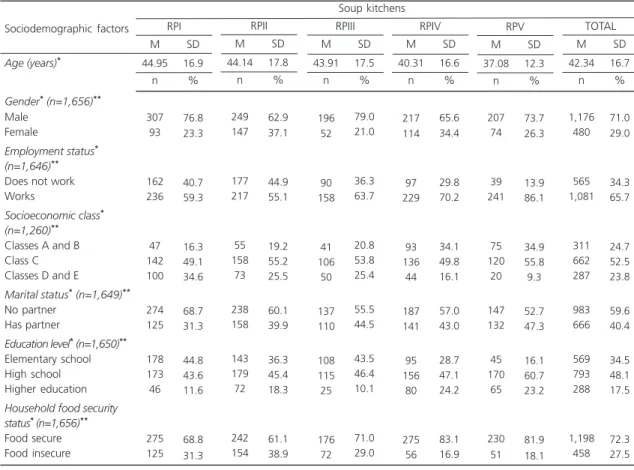
users were young adults aged 18 to 30 years or adults aged 31 to 49 years. In other words, most users were male, working age, employed, of socioeconomic class C, and had completed high school (Table 1). More than 60.0% of the users of each establishment were food secure. RPII had the highest prevalence of food insecurity (38.9%) and RPIV, the lowest (16.9%).
As for social representations, 52.9% of the 1,579 users who answered the question, “Have you changed or intend to change your diet?” reported not having changed and not intending to change their diet. However, 65.2% of the 1,501 users who answered the question, “Is it hard for you to eat healthier?” reported having difficulties to eat healthier. Additionally, when the “type of change that the users have made or intend to make in their diets” and “difficulties to eat healthy” were combined, 83.2% of the 685 users who had changed or intended to change their diets had difficulties to eat healthy (p<0.001).
Analysis of the central ideas of the “type of change that the users have made or intend to make in their diets” showed that most subjects believed that “cutting, reducing, avoiding, not eating, eating less, and decreasing carbohydrates, fats, salt, meats, various beverages, and other foods” (Table 2) were the changes that they had to make to eat healthier, as exemplified
in the discourse below: “I need to cut/reduce
carbohydrates and fatty foods to have a healthier
diet”.
The second most common desired change present in the central ideas of the answers was “to eat more fruits and non-starchy vegetables
and to avoid/reduce other foods” (Table 2): “I
intend to change my diet by eating more fruits and non-starchy vegetables and by consuming
fewer deep-fried foods and sweets”.
The most common central idea to the answers related to the “difficulties of eating healthy” was “low income”, followed by “lack
of time” (Table 2) as shown below: “The money I
have is not enough to buy healthy foods because they are usually very expensive and my salary is low, so I can’t”.
Table 1. Sociodemographic profile of users of soup kitchens in Belo Horizonte (MG), Brazil, 2012 (n=1,656).
Gender* (n=1,656)**
Male Female
Employment status*
(n=1,646)**
Does not work Works
Socioeconomic class*
(n=1,260)**
Classes A and B Class C Classes D and E
Marital status*(n=1,649)**
No partner Has partner
Education level*(n=1,650)**
Elementary school High school Higher education
Household food security status*(n=1,656)**
Food secure Food insecure
Age (years)*
Sociodemographic factors 307 93 162 236 47 142 100 274 125 178 173 46 275 125 76.8 23.3 40.7 59.3 16.3 49.1 34.6 68.7 31.3 44.8 43.6 11.6 68.8 31.3 n % 44.95 16.9 M SD RPI Soup kitchens 249 147 177 217 55 158 73 238 158 143 179 72 242 154 62.9 37.1 44.9 55.1 19.2 55.2 25.5 60.1 39.9 36.3 45.4 18.3 61.1 38.9 n % 44.14 17.8 M SD RPII 196 52 90 158 41 106 50 137 110 108 115 25 176 72 79.0 21.0 36.3 63.7 20.8 53.8 25.4 55.5 44.5 43.5 46.4 10.1 71.0 29.0 n % 43.91 17.5 M SD RPIII 217 114 97 229 93 136 44 187 141 95 156 80 275 56 65.6 34.4 29.8 70.2 34.1 49.8 16.1 57.0 43.0 28.7 47.1 24.2 83.1 16.9 n % 40.31 16.6 M SD RPIV 207 74 39 241 75 120 20 147 132 45 170 65 230 51 73.7 26.3 13.9 86.1 34.9 55.8 9.3 52.7 47.3 16.1 60.7 23.2 81.9 18.1 n % 37.08 12.3 M SD RPV 1,176 480 565 1,081 311 662 287 983 666 569 793 288 1,198 458 71.0 29.0 34.3 65.7 24.7 52.5 23.8 59.6 40.4 34.5 48.1 17.5 72.3 27.5 n % 42.34 16.7 M SD TOTAL
Note:*p-value of Chi-square test <0.05; **Values considering valid data.
RPI: Restaurante Popular Herbert de Souza; RPII: Restaurante Popular Josué de Castro; RPIII: Restaurante Popular Maria Regina Nabuco; RPIV: Restaurante Popular Dom Mauro Bastos; RPV: Refeitório Popular da Câmara Municipal João Bosco Murta Lages;M: Mean; SD: Standard Deviation.
Table 2. Distribution of the number of central ideas found in the answers to the questions about the social representations of a healthy diet. Belo Horizonte (MG), Brazil, 2012.
To cut, reduce, avoid, not eat, eat less, decrease carbohydrates, fats, salt, meats, various beverages, and other foods. To eat more fruits and non-starchy vegetables, and to avoid/decrease other foods.
To eat more fruits and non-starchy vegetables.
Healthy, balanced, natural, varied diet, high in fibers, eat with moderation, eat at every three hours, drink more water.
To eat more fruits, non-starchy vegetables, and other foods.
What keeps you from having a healthier diet? (n=979)*
Low income.
Habits, customs, food preferences, taste. Lack of time.
Lack of access, lack of option, lack of information. Lack of time and other reasons.
Other (central idea excluded). Central ideas
What type of change have you made or intend to make in your diet? (n=743)*
n % 304 177 106 92 64 374 216 117 73 44 155 40.9 23.8 14.3 12.4 08.6 38.2 22.1 11.9 07.5 04.5 15.8
I have no time to prepare/cook and buy healthy foods. This type of food deteriorates frequently, and less healthy foods are more practical. In the day-to-day rush I have all my meals away from home, I work a lot and have no time to look for restaurants that serve healthier meals.
The discourse above indicates that the subject wants practicality, comfort, speed, and safety. The lack of time hinders the search for good alternatives to have a healthy diet.
Univariate analysis measured the association between the variables related to the social representations of a healthy diet and the level of food security of the households of users of soup
kitchens from Belo Horizonte (Table 3), and
significant associations were found (p<0.001).
Food-secure users reported having made or the intention to make the following changes: “cut, reduce, avoid, not eat, eat less, and decrease carbohydrates, fats, salt, meats, various
beverages, and other foods”. Additionally, most of these subjects (71.4%) report that “lack of time” (82.9%) is the main obstacle for eating healthier (Table 3).
Food-insecure users more commonly reported that “eating more fruits, non-starchy vegetables, and other foods” was the main change they needed or intended to make, and the most common reason for not eating healthier was “low income” (53.5%) (Table 3).
D I S C U S S I O N
The analysis and associations made by the present study are important because they provide data for better planning a food and nutrition education intervention that use healthy diet-promoting strategies that actually meet this
group’s real needs.
In this sense a proposal of food and nutrition education in consonance with the
Table 3. Association between household food and nutrition security status and the central idea of the social representations of making dietary changes and the difficulties of eating healthier. Belo Horizonte (MG), Brazil, 2012.
Has changed or intends to change diet (n=1,579)**
Yes No
Has difficulties to eat healthier (n=1,501)**
Yes No
Dietary changes I made or intend to make (n=743)**
To eat more fruits and non-starchy vegetables
To eat more fruits, non-starchy vegetables, and other foods
To eat more fruits and non-starchy vegetables and avoid/reduce other foods
Healthy, balanced, natural, varied diet, high in fibers, eat in moderation, eat at every three hours, drink more water
To cut, reduce, avoid, not eat, eat less, decrease carbohydrates, fats, salt, meats, various beverages, and other foods
Difficulties to eat healthier (n=979)**
Lack of time
Lack of time and other reasons Low income
Habits, customs, food preferences, taste
Lack of access, lack of option, lack of information, other Other (central idea excluded)
Variable
n %
Food security
512 632
638 428
73 42 117 63
217
97 30 174 167 53 117
68.9 75.6
65.2 82.0
68.9 65.6 66.1 68.5
71.4
82.9 68.2 46.5 77.3 72.6 75.5
n %
Food insecurity
231 204
341 94
33 22 60 29
87
20 14 200 49 20 38
31.1 24.4
34.8 18.0
31.1 34.4 33.9 31.5
28.6
17.1 31.8 53.5 22.7 27.4 24.5
<0.001*
<0.001*
<0.760*
<0.001*
p
effective transformation of people’s attitudes and practices cannot avoid a stance that challenges the linear models of simple information
transmission15. Consequently, the great challenge
is to design a proposal that coordinates the teaching resources that act on the producers of subjectivity using social representations. Moreover, taking into account the target population’s social and economic factors is also a challenge7,16.
The study subjects are working-age workers of low socioeconomic status, characteristics that meet the profile of the desired target population, especially of the Soup Kitchen Program5. These data corroborate Gonçalves et al.17, who studied users of 19 soup kitchens in five Brazilian state capitals. These users were mostly working-age males (70%) who had completed high school and whose socioeconomic status was compatible with the proposal of the said Program.
Sociodemographic characteristics are considered conditioners of food habits. Men with low education level and income have low intake of fruits, non-starchy vegetables, whole grains,
and lean meats18. Additionally, most of the study
subjects are nutritionally vulnerable, a fact
also reported by Bento19, who determined the
sociodemographic, nutritional, and psychosocial
profile of soup kitchen users in Belo Horizonte.
Bento19 found a high prevalence of overweight
and high frequency of food habits classified as “regular”, that is, the individual has a monotonous diet and needs to improve it, in addition to other habits such as inadequate physical activity and fluid intake.
The study data are reinforced by the Family Butget Survey 2008-20093, Vigitel20, and Levy et al.18, which found that Brazilians do not consume adequate amounts of fruits and non-starchy vegetables. Furthermore, Brazilians consume too many calories from saturated fats, sugar, and salt, and have low fiber intake. This is concerning because such food habits are associated with some chronic non-communicable diseases.
However, many people are not ready or willing to make dietary changes, and others have difficulties adopting a healthier diet.
Most users in the present study reported not having made or intending to make dietary changes, and a portion of these users do not believe they have difficulties eating healthier, which leads them not to worry about this issue. This fact may indicate that these users may not recognize their bad eating habits, which is one more problem for future food and nutrition education actions to address because they have
no motivation to make dietary changes21.
The association between having made or the intention to make dietary changes and the difficulty of eating healthier showed that most users who made or intended to make dietary changes had difficulty to eat healthier, which probably denotes their concern with their current diet. On the other hand, this duality may compromise meal quality and increase the risk of
health problems7, evidencing the need of food
and nutrition interventions that consider cultural and economic aspects, as well as habitual life characteristics defined by these individuals to
make the desired dietary changes5.
The central ideas indicate that users have notions about the recommended healthy eating practices since they mention the practices
advocated by the Ministry of Health22. Moreover,
the central idea about the difficulties to eat healthier involve organizing time and activities of daily living, budget planning, having nearby healthy food outlets, understanding the relationship between socioeconomic level and diet, and desiring to change food habits and try new flavors.
The associations between the type of dietary changes that users have made or intend to make and the difficulties to eat healthier and household food security status showed that food-secure users prefer healthier foods and avoid energy-dense foods, and lack of time is the main obstacle to a healthier diet. These findings
corroborate Silva & Costa23, who assessed the
and non-starchy vegetable intake by adults from Brazilia and found that lack of time is associated with long working hours and low acquisition of fruits and non-starchy vegetables because of their perishability23.
Food-insecure users desire to eat more fruits and non-starchy vegetables. However, their low income is the main obstacle that prevents them from doing so, forcing them to eat energy-dense foods because of their higher affordability24.
The wellbeing of low-income individuals is at risk because high intake of foods high in fats, sugars, and salt, and low intake of fruits and non-starchy vegetables are not only a risk for
chronic non-communicable diseases25 but are also
associated with food insecurity26. Studies have
shown that income is the most important determinant of inequity, and income also explains
food insecurity because it limits one’s ability to
acquire healthy and safe foods26-28.Nonetheless,
other sociodemographic determinants must be investigated, such as household size, education
level, race, and basic sanitation, among others29.
The study findings, a snippet of the social
transformations that impacted Brazilians’ health
and nutrition statuses, indicate the need of a guideline that promotes an adequate and healthy diet. In this sense, the Brazilian Food Guide stands out because it is an appropriate instrument for the study context. It was recently developed to support and encourage healthy dietary practices, and to provide information to policies, programs, and actions that aim to incentivize, support,
protect, and promote the population’s health and
food and nutrition security30.
This study has some limitations. Its cross-sectional design prevents affirming a cause for the outcomes of the established associations because exposure and outcome were assessed simultaneously and so the results should be interpreted with caution.
However, we highlight the importance of
this study because according to Magalhães31, the
construction of new theoretical and methodological approaches for the assessment of public policies and initiatives related to food and nutrition security needs advancement. Additionally, systematic empirical research in the area, combining quantitative and qualitative data stemming from the process of local implementation, allows capturing the complexity of food and nutrition security programs and contributes to effective learning and changes. With respect to soup kitchens, these studies should be coordinated with municipal, state, or district spheres because they are in charge of putting together a technical team to plan, follow, and carry out actions developed
in these establishments5.
If experience with the assessment of Brazilian programs is small, it is even less significant and systematic than food and nutrition
security programs32. Food and nutrition security
is a field under construction peculiar to the Brazilian context and certainly challenging, whether to the political or scientific sphere. It has
been consolidating in the last decades32 and is
clearly central to the political agenda31.
Regarding public data of the Soup Kitchen Program, the reality is no different. The assessment is centralized in the final results of
the program33. According to data from the
Coordenação - Geral de Equipamentos Públicos33,
the Ministry of Social Development and Fight against Hunger established that one of its goals is to develop a system that continuously monitors and assesses soup kitchens. This is because soup kitchens are an important food and nutrition security policy, and its growth is necessary because the number of establishments is still small for the number of food-insecure Brazilians. At the national and regional levels, the percentage of the population served by the program does not
exceed 0.3% of the target population17.
Furthermore this policy is integrated with other public policies, such as those that guarantee
family farm sustainability30, and coordinates with
C O N C L U S I O N
This study contributed to the identification of the central ideas of social representations of “type of dietary changes that users have made or intend to make” and “difficulties to eat healthier”, and revealed the associations between these items and the household food security status of
users of soup kitchens in Belo Horizonte.
The similarity of the data regarding the association between the identified social representations and the household food security status evidences the importance of this study for identifying the real need to change dietary habits, in order to better plan, implement, and assess interventions, and to overcome the barriers that prevent these changes.
Moreover, these social representations generally indicate that the subjects are knowledgeable about healthy diet, but they often let common sense guide their practices. Also, the main necessity of these users is not information or knowledge. What they need is educational actions that promote a healthy diet, that fall into the affective learning domain, and that take into account their social representations and socioeconomic conditions. They must also
consider the users’ values, beliefs, meanings, and
senses constructed throughout their lives.
The study of social representations in association with the household food security status is an important element for the success of food and nutrition education interventions, and the methodologies that enable a greater understanding of the determinants of these behaviors are essential to guarantee the effectiveness of actions that promote healthy food habits. Social representations are related to and
reflect people’s behaviors. Social representations
of diet are conditions for food practices. Diet is surrounded by many meanings, from the cultural scope to social experiences, because food practices are not only linked to the need to eat but also pervades cultural identity, social condition, family customs, values, beliefs, time, and the preferred ways of preparing a food.
Additionally, the study results may guide important issues that need to be approached and discussed with soup kitchen users, such as their perceived diet and recognition of their actual food practices. Regarding the socioeconomic profile and household food security status, soup kitchens are an alternative for having a healthy and affordable diet, complying with the proposal of this important public policy which is to preferably serve people who live in large cities and are socially and nutritionally vulnerable.
C O N T R I B U T O R S
IC BENTO and FM SOBRINHO collected, analyzed, and interpreted data; created a draft, and reviewed the manuscript. MNS ABREU analysed and interpreted data, and reviewed and approved the final version of the manuscript. MF GAZZINELLI and SCL PEREIRA coordinated and guided study conception and planning, and data analysis and interpretation; and reviewed and approved the final version of the manuscript.
R E F E R E N C E S
1. Shetty P. Nutrition transition and its health outcomes. Indian J Pediatr. 2013; 80(1 Suppl.):21s-7s. http:// dx.doi.org/10.1007/s12098-013-0971-5
2. Gubert MB, Benicio MHD, Santos LMP. Estimativas de insegurança alimentar grave nos municípios Brasileiros. Cad Saúde Pública. 2010; 26(8):1595-605. http://dx.doi.org/10.1590/S0102-311X20100008 00013
3. Instituto Brasileiro de Geografia e Estatística. Pes-quisa de orçamentos familiares 2008-2009: des-pesas, rendimentos e condições de vida. Rio de Janeiro: IBGE; 2010.
4. Brasil. Presidência da República. Decreto-Lei nº 11.346, de 15 de setembro de 2006. Cria o Sistema Nacional de Segurança Alimentar e Nutricional -Sisan com vistas em assegurar o direito humano à alimentação adequada e dá outras providências. [2015 maio 25]. Disponível em: http://www4. planalto.gov.br/consea/conferencia/documentos/ lei-de-seguranca-alimentar-e-nutricional.
Com-bate à Fome; 2004 [2015 maio 25]. Disponível em http://www.ieham.org/html/docs/manual_ programa_restaurantes_populares.pdf
6. Boog MCF. Educação em nutrição: integrando experiências. Campinas: Komedi; 2013.
7. Moscovici S. Representações sociais: investigações em psicologia social. 6ª ed. Petrópolis: Vozes; 2009. 8. Programa das Nações Unidas para o Desenvol-vimento (PNUD). Atlas do desenvolDesenvol-vimento humano nas regiões metropolitanas brasileiras. Brasília: PNUD; 2010 [2015 jun 20]. Disponível em: http:// pnud.org.br/IDH/IDHM.aspx?indiceAccordion= 0&li=li_IDHM
9. Belo Horizonte. Estatística e mapas: exclusão social 2000. Índice de vulnerabilidade social. 2012 [2015 maio 25]. http://portalpbh.pbh.gov.br/pbh/ecp/ contents.do?evento=conteudo&idConteudo=19777&ch Plc=19777&termos=A-indice
10. Babbie E. Survey research methods. 10th ed. Belmont: Wadsworth Publishing; 2004.
11. Brasil. Ministério da Saúde. Conselho Nacional de Saúde. Resolução nº 466, de 12 de dezembro de 2012. Diário Oficial da União. 2013; 13 jun, p.59, Seção 1.
12. Associação Nacional de Empresas de Pesquisa. Critério de classificação econômica Brasil: dados com base no levantamento sócio econômico - 2008. São Paulo: Anep; 2010 [2015 maio 25]. Disponível em: www.datavalesp.com.br/CCEB.pdf
13. Ferreira HS, Souza MEDS, Moura FA, Horta BL. Pre-valência e fatores associados à Insegurança Ali-mentar e Nutricional em famílias dos municípios do norte de Alagoas, Brasil, 2010. Ciênc Saúde Colet. 2013; 19(5):1533-42.http://dx.doi.org/10. 1590/1413-81232014195.06122013
14. Lefèvre F, Lefèvre AC. O discurso do sujeito coletivo: um novo enfoque em pesquisa qualitativa (des-dobramentos). 2ª ed. Caxias do Sul: Educs; 2005. 15. Amparo LS. Avanços e desdobramentos do marco de referência da educação alimentar e nutricional para políticas públicas no âmbito da universidade e para os aspectos culturais da alimentação. Rev Nutr. 2013; 26(5):595-600. http://dx.doi.org/10. 1590/S1415-52732013000500010
16. Jodelet DP. As representações sociais. Rio de Janeiro: Editora UERJ; 2001.
17. Gonçalves MP, Campos ST, Sarti FM. Políticas pú-blicas de segurança alimentar no Brasil: uma análise do Programa de Restaurantes Populares. Rev Gestão Polit Públicas. 2011 [2015 maio 25]; 1(1):92-111. Disponível em: http://each.uspnet.usp.br/rgpp/ index.php/rgpp/article/viewFile/5/7
18. Levy RB, Claro RM, Mondini L, Sichieri R, Monteiro CA. Distribución regional y socioeconómica de la
disponibilidad domiciliaria de alimentos en Brasil, 2008-2009. Rev Saúde Pública. 2012; 46(1):6-15. http://dx.doi.org/10.1590/S0034-89102011 005000088
19. Bento IC. Perfil sociodemográfico, nutricional e psicossocial dos usuários dos restaurantes e re-feitório populares de Belo Horizonte - MG: fun-damento para a elaboração de uma Intervenção Educativa Alimentar e Nutricional [dissertação]. Belo Horizonte: Universidade Federal de Minas Gerais; 2012.
20. Brasil. Ministério da Saúde. Secretaria de Vigilância em Saúde. Vigitel Brasil 2012: Vigilância de Fatores de Risco e Proteção para Doenças Crônicas por Inquérito Telefônico. Brasília: Ministério da Saúde; 2013.
21. Norcross JC, Krebs PM, Prochaska JO. Stages of change. J Clin Psychol. 2011; 67(2):143-54.http:// dx.doi.org/10.1002/jclp.20758
22. Viegas SMF, Lanza FM, Lara MO, Lage AMD, Penna CMM. Alimentação, uma das chaves para a saúde: análise de conteúdo de reportagens da revista Veja. R Enferm Cent O Min. 2012 [2015 jun 15];2(1):78-92. Disponível em: http://www.seer.ufsj.edu.br/index. php/recom/article/view/178/267
23. Silva CL, Costa THM. Barreiras e facilitadores do consumo de frutas e hortaliças em adultos de Brasília. Sci Med. 2013; 23(2):68-74. Disponível em: http://revistaseletronicas.pucrs.br/ojs/index.php/ scientiamedica/article/viewFile/13047/9667 24. Lo YT, Chang YH, Lee MS, Wahlqvist ML. Dietary
diversity and food expenditure as indicators of food security in older Taiwanese. Appetite. 2012; 58(1):180-7. http://dx.doi.org/10.1016/j.appet. 2011.09.023
25. Mohammadi F, Harrison GG, Ghazi-Tabatabaei M, Abdollahi M, Houshiar-Rad A, Mehrabi Y, et al. Is household food insecurity associated with overweight/obesity in women? Iran J Public Health. 2013; 42(4):380-90.
26. Willows N, Veugelers P, Raine K, Kuhle S. Associations between household food insecurity and health outcomes in the Aboriginal population (excluding reserves). Health Reports. 2011; 22(2):15-20.
27. Marin-Leon L, Francisco PMSB, Segall-Corrêa AM, Panigassi G. Bens de consumo e insegurança ali-mentar: diferenças de gênero, cor de pele autorrefe-rida e condição socioeconômica. Rev Bras Epidemiol. 2011; 14(3):398-410. http://dx.doi.org/10.1590/ S1415-790X2011000300005
Aids Behav. 2011; 15(7):1512-9.http://dx.doi.org/ 10.1007/s10461-010-9693-0
29. Kepple AW, Segall-Corrêa AM. Conceituando e medindo a segurança alimentar e nutricional. Ciênc Saúde Colet. 2011; 16(1):187-99. http://dx.doi.org/ 10.1590/S1413-81232011000100022
30. Brasil. Ministério da Saúde. Secretaria de Atenção à Saúde. Guia alimentar para a população brasileira. 2ª ed. Brasília: Ministério da Saúde; 2014.
31. Magalhães R. Avaliação de políticas e iniciativas públicas de segurança alimentar e nutricional: dilemas e perspectivas metodológicas. Ciênc Saúde Colet. 2014; 19(5):1339-46. http://dx.doi.org/10. 1590/1413-81232014195.12202013
32. Santos SMC, Santos LMP. Avaliação de políticas públicas de segurança alimentar e combate à fome no período de 1995-2002: abordagem metodo-lógica. Cad Saúde Pública. 2007; 23(5):1029-40. http://dx.doi.org/10.1590/S0102-311X20070 00500005
33. Brasil. Ministério do Desenvolvimento Social e Com-bate à Fome; Secretaria de Avaliação e Gestão da Informação. Rede de equipamentos públicos de ali-mentação e nutrição: resultados de avaliações. Cad Estud Desenvol Social Debate. 2010; (14):164.