Idiane RossetI
Matheus Roriz-CruzII
Jair Licio F SantosIII
Vanderlei J HaasI
Suzele C C Fabrício-WehbeIV
Rosalina A P RodriguesI
I Departamento de Enfermagem Geral e Especializada. Escola de Enfermagem de Ribeirão Preto. Universidade de São Paulo (USP). Ribeirão Preto, SP, Brasil
II Serviço de Medicina Interna. Hospital de Clínicas de Porto Alegre. Universidade Federal do Rio Grande do Sul. Porto Alegre, RS, Brasil
III Departamento de Medicina Social. Faculdade de Medicina. USP. Ribeirão Preto, SP, Brasil
IV Departamento de Enfermagem. Centro Universitário Barão de Mauá. Ribeirão Preto, SP, Brasil
Correspondence: Idiane Rosset Escola de Enfermagem Av. dos Bandeirantes, 3900 14040-902 Ribeirão Preto, SP, Brasil E-mail: [email protected] Received: 11/6/2009 Approved: 1/18/2010
Article available from: www.scielo.br/rsp
Socioeconomic and health
differentials between two
community-dwelling oldest-old
groups
ABSTRACT
OBJECTIVE: To identify demographic and socioeconomic differentials associated with the health status of oldest-old individuals living in two cities of different Brazilian regions.
METHODS: A comparative and cross-sectional epidemiological study was conducted with the oldest-old (≥ 80 years), living in the cities of Ribeirão Preto (RP, Southeastern Brazil) and Caxias do Sul (CS, Southern). The probabilistic sample included 117 individuals in CS and 155 in RP, and data were collected between 2007 and 2008. The instrument included demographic and socioeconomic data, Mini-Mental State Examination, Functional Independence Measure, number of self-reported comorbidities and Geriatric Depression Scale.
RESULTS: Mean age was similar, with predominance of women (~70%) and widowed individuals (~60%) in both cities. Mean level of education did no differ statistically, although mean income was higher in RP than in CS (p = 0.05). RP showed a higher concentration of individuals in the extreme levels of education and income than that of CS. Mean score of the Mini-Mental State Examination was similar in both groups and higher among men, individuals aged between 80 and 84 years, married and with a higher level of education. Better functional performance was observed in elderly individuals aged between 80 and 84 years in both cities, in those with higher level of education in RP; and in males and married individuals in CS. Elderly individuals in CS showed higher number of comorbidities than those in RP (p < 0.001). Male elderly individuals, married and with -higher income level showed fewer depressive symptoms in both groups; and those in RP showed higher Geriatric Depression Scale score than the others in CS (p < 0.001).
CONCLUSIONS: Although the oldest old in CS showed lower socioeconomic inequality and fewer depressive symptoms, they also had a higher mean number of comorbidities and lower level of functional independence, when compared to those in RP.
DESCRIPTORS: Aged, 80 and over. Depressive Disorder. Comorbidity. Socioeconomic Factors. Cross-Sectional Studies.
INTRODUCTION
countries, and this proportion will increase to 75% in 2025.18 Estimates of the World Health Organization
(WHO) show that Brazil will be the sixth country in the world in terms of absolute elderly population in 2025.22
The Brazilian oldest-old population (≥80 years) was approximately 600,000 in 1980. In 2000, this number rose to 1.6 million, and it is expected to increase to 9 million in 2020 and 14 million in 2040.a The oldest-old
represent 12.8% of the elderly population and 1.1% of the total Brazilian population.a The implications of this
increase are worrisome for the economy, health and social well-being sectors of any nation.
In addition to the process of demographic transition, Brazil is undergoing a process of epidemiological tran-sition. This transition is characterized by a decrease in mortality from communicable diseases and an increase in mortality from chronic non-communicable diseases (CNCD) and external causes. The morbi-mortality load shifts from younger to older groups and the predomi-nance of mortality is replaced by that of morbidity.19
Cognitive decline, the presence of comorbidities, functional dependence and depression are among the most common health problems in the elderly, especially in the oldest-old, and also the least investigated by health services. Such health conditions, in adition to being related to each other,5,14 are important predictors
of mortality.6, 11
These changes in demographic and epidemiological profi le require refl ection aimed at governmental actions and health professionals. Moreover, the national (and regional) culture shapes the way an individual ages, because it infl uences other determining factors of healthy aging.22 According to Camarano,b aging
is perceived and understood according to cultural variations. This factor becomes important, due to the environmental and cultural diversity existing in Brazil.
The present study aimed to identify demographic and socioeconomic differences associated with the health status of the oldest-old living in two cities of different Brazilian regions, in distinct environmental and cultural contexts.
METHODS
A comparative and cross-sectional epidemiological study was conducted with the oldest-old living in the
a Instituto Brasileiro de Geografi a e Estatística. Projeção da população do Brasil por sexo e idade, 1980 – 2050: revisão 2008. Rio de Janeiro: IBGE; 2008.
b Camarano AA. Envelhecimento da população brasileira: uma contribuição demográfi ca. Rio de Janeiro: Instituto de Pesquisa Econômica Aplicada; 2002. (Textos para Discussão, 858).
c Ministério da Saúde. Indicadores e dados básicos - Brasil - 2008 - IDB 2008 [Internet]. [Cited 2009 Mar 15]. Available from: http://tabnet.datasus.gov.br/cgi/idb2008/matriz.htm
d Fundação Sistema Estadual de Análise dos Dados do Governo do Estado de São Paulo. Perfi l Municipal de Ribeirão Preto. 2007. [Cited 2009 May 20]. Avalibale from: http://www.seade.gov.br/produtos/perfi l/perfi lMunEstado.php
e Fundação de Economia e Estatística do Governo do Estado do Rio Grande do Sul. Município de Caxias do Sul 2008. [Cited 2009 Apr 10]. Available from: http://www.fee.tche.br/sitefee/pt/content/resumo/pg_municipios_detalhe.php?municipio=Caxias+do+Sul
cities of Ribeirão Preto (RP, Southeastern) and Caxias do Sul (CS, Southern), Brazil. In RP, data were collected between May 2007 and February 2008, and in CS, between May and September 2008.
The city of RP has a total population of approximately 550,000 inhabitants; of these, 10.2% are elderly indi-viduals aged ≥ 60 years and 1.2% are oldest-old (≥ 80 years).c Life expectancy in the city was 71.7 years and
the illiteracy rate was 4.4% in 2000, and per capita gross domestic product (GDP) was R$ 20,139.00 (US$ 11,641.00) in 2006.d
The city of CS has a total population of approximately 400,000 inhabitants, 8.4% of elderly individuals aged
≥ 60 years and 0.9% of oldest-old.c Life expectancy
in this city was 74.1 years and the illiteracy rate was 3.7% in 2000, and per capita GDP was R$ 20,923.00 (US$12,094.00) in 2006.e
Oldest-old individuals aged ≥ 80 years, who lived in these communities and had signed an informed consent form were eligible to participate in the study. By considering the total population aged ≥ 80 years in the cities of CS (3,546) and RP (6,797) and applying
fi nite population correction, the sample sizes obtained were n = 100 and n = 145, respectively. By admitting a non-response rate of 20%, the fi nal sample size was n = 120 for CS and n = 174 for RP.
As the RP sample was included in a larger sample of elderly individuals in other age groups, census tract size was considered according to the number of households, with a fi xed number of 30 selected tracts and at least 110 households to be visited in each tract. For CS, the number of oldest-old individuals was considered to determine the census tract size and a number of 40 selected tracts was established, due to the lower concentration of elderly individuals in this city. A total of three oldest-old individuals per census tract was fi xed. Spouses or cohabitants aged ≥ 80 years living with the elderly individuals visited were invited to participate in the study.
Final sample size obtained was comprised of 117 indi-viduals in CS and 155 in RP.
Data collection was conducted in the elderly indi-viduals’ homes by previously trained interviewers (undergraduate and postgraduate nursing students).
Age, sex, marital status, the fact of living alone or with other people, level of education (in years), elderly individual’s income (in reais and minimum wages),
type of residence (owned or not), and type of health service used when care is required were collected by an instrument standardized for this study.
Cognitive state was evaluated through the Mini-Mental State Examination (MMSE), translated and validated in Brazil,3 varying from zero (highest level of cognitive
impairment) to 30 (best cognitive capacity).
The investigated comorbidities included the following chronic diseases or health problems: anemia; anxiety/ panic disorder; arthritis/arthrosis; asthma/bronchitis; impaired hearing; cancer; broncho-pulmonary disease; diabetes mellitus; depression; cerebrovascular accident; heart disease; upper gastrointestinal disease (ulcer, hernia, refl ux); peripheral vascular disease; neuro-logical disease (Parkinson’s, Alzheimer’s disease); arterial hypertension; urinary and/or fecal incontinence; insomnia; obesity; osteoporosis; constipation; spine problems; impaired sight; dizziness (labyrinthitis, vertigo) or others.
Functional capacity was evaluated through the Functional Independence Measure (FIM), translated and validated in Brazil.13 This scale classifies an
individual’s performance to perform a set of 18 tasks (subcategories) of motor and cognitive domains, in the following categories: self-care, sphincter control, trans-fers, locomotion, communication and social cognition. Each task is classifi ed in a seven-level scale (1: total dependence; 7: complete independence). Global FIM scoring varies from 18 (highest level of dependence) to 126 points (highest level of independence).
Depressive symptoms were evaluated through the Geriatric Depression Scale (GDS) with 15 yes/no questions about frequent depressive symptoms in the
elderly. The GDS, translated and validated in Brazil by Almeida & Almeida,1 varies from zero (absence of
depressive symptoms) to 15 points (maximum number of depressive symptoms).
Descriptive-exploratory and inferential statistics were used for uni- and bivariate data analysis in the Stata 11.0 software. Analysis followed the correction needed for the sample design, due to the formation of clusters per census tract and the weighting by the inverse of sampling fractions. Rao-Scott test was used to analyze associations, as it considers the infl uence of sample design.12 Generalized Wald test8 was used to compare
the two means, while weightedANOVA was used for more than two means. A value ofp < 0.05 was consid-ered statistically signifi cant.
The present research project was approved by the Research Ethics Committee of the Escola de Enfermagem de Ribeirão Preto da Universidade de São Pauloon July 20th 2006 (protocol 0692/2006).
RESULTS
Demographic and socioeconomic characteristics of the elderly individuals studied are shown in Table 1. Mean age was similar in both groups (p = 0.19), as well as the distribution in age groups, with predominance in the 80-to-84-year age group. Similar proportion was obtained in the distribution of sex and marital status between both groups, with predominance of women and widowed individuals. In RP, 13.2% lived alone, whereas in CS, this proportion was 26.7% (p = 0.01).
There was a signifi cant difference in level of education between both groups (p = 0.03), with higher concentra-tion of illiterate individuals and others with a higher level of education in RP than in CS. However, the mean number of years of education was similar in both cities.
Mean monthly income of the oldest-old was signifi -cantly higher (p = 0.05) in RP than in CS, with a greater proportion of elderly individuals who received less than one minimum wage (MW) in RP and, espe-cially, of those who received more than three MW, when compared to CS, although without statistical signifi cance.
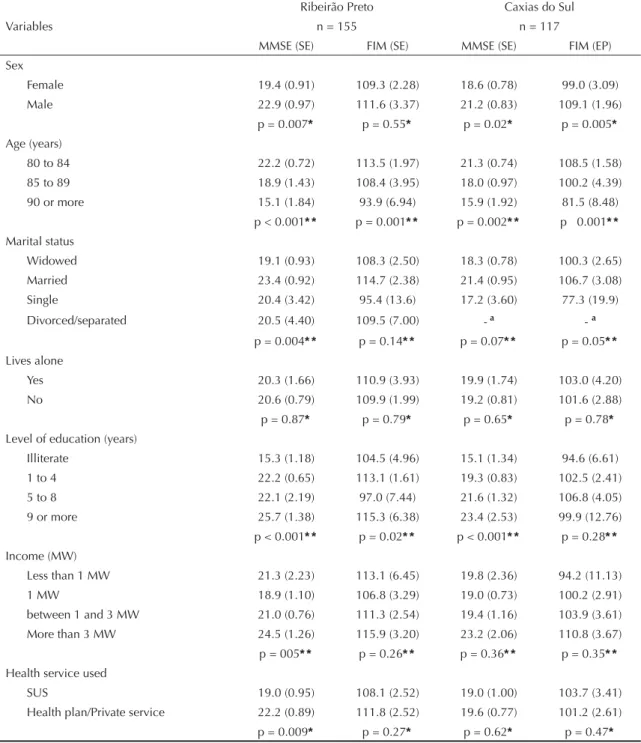
Mean MMSE score was 20.57 (SD = 7.5) in RP and 19.53 (SD = 6.3) in CS. MMSE was signifi cantly and inversely associated with age. Mean was higher in males, in both cities. Married individuals showed higher
MMSE scores in both groups, although only statisti-cally signifi cant in RP. The fact of one living alone or with other people was not associated with the MMSE in both groups (Table 2).
The MMSE was signifi cantly and positively associated with level of education. However, there was a signifi -cant association with income only in RP: those who received more than three monthly minimum wages obtained the highest MMSE score; the lowest score was observed among those who received one MW, rather than others who received less. In RP, elderly individuals who used the Sistema Único de Saúde (SUS – Unifi ed Health System) had a lower MMSE score than those who used a health plan or private health care services.
The mean of total FIM of the oldest-old in RP was 108.2 (SD = 24.27), and that of the oldest-old in CS was 102.9 (SD = 19.86; p = 0.058). By comparing the FIM score between sexes, there was a higher level of independence in men (p < 0.05 only in CS). By distributing the FIM score into age groups, there was a decreasing linear distribution, i.e., a reduction in the level of independence with age in both cities (p < 0.01 for both). Married individuals showed greater func-tional independence than the remaining ones in both groups, with signifi cant difference only in CS.
Level of education did not show a linear relationship with the FIM score. In CS, individuals with lower score had a lower level of education, while in RP, it was those with fi ve to eight years of education.
Income showed a positive linear relationship with the FIM score in CS only, although not signifi cant. In RP, elderly individuals who received one minimum wage, and not less, showed the lowest FIM score.
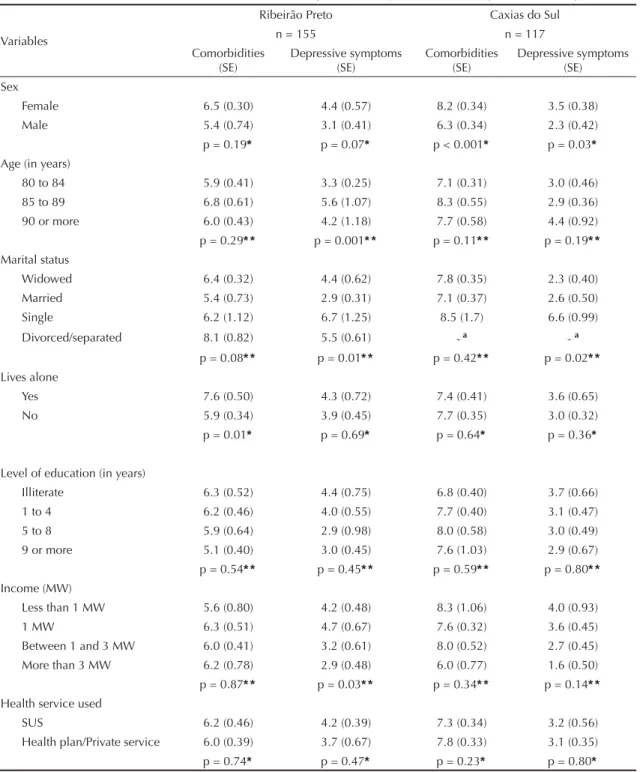
The difference in the mean number of comorbidities was significant between both groups (p < 0.001), totaling 5.9 (DP = 2.9) in RP and 7.6 (DP = 2.9) in CS. A higher mean was found among women, although statistically signifi cant only in CS (p < 0.001). There were no signifi cant differences in the mean of comor-bidities between age groups. Individuals who did not live alone reported a higher number of comorbidities than those who lived alone in RP (p < 0.05). Among the subcategories of income, level of education and health service used, there were no signifi cant differences in the distribution of the mean number of comorbidities in both cities (Table 3).
There were signifi cant differences (p = 0.009) in the mean score of depressive symptoms between both cities, i.e., 4.1 (SD = 2.9) in RP and 3.1 (SD = 2.8) in CS. A higher mean was observed in women in both groups, although with statistical signifi cance in CS only (p = 0.03) and with a trend towards signifi cance in RP (p Table 1. Demographic and socioeconomic characteristics of
the oldest-old in Ribeirão Preto (n = 155), Southeastern, and Caxias do Sul (n = 117), Southern Brazil, 2009.
Characteristics
Ribeirão
Preto Caxias do Sul p % %
Mean age (SE) 84.3 (0.44)
85.0 (0.32) 0.19* Age (years)
80 to 84 63 49.8 0.12* *
85 to 89 26.1 37.4 90 or more 11 12.8 Sex
Female 67.9 69 0.87* *
Male 32.1 31
Marital status
Widowed 60.9 59 0.39* *
Married 32.5 35.9
Single 3.1 4.3
Divorced/separated 3.5 0.9 Lives alone
Yes 13.2 26.7 0.01* *
No 86.8 73.3
Mean level of education (SE) (0.52) 3.2 (0.34)3.6 0.44*
Level of education (in years)
Illiterate 28.2 16 0.03* *
1 to 4 57.5 55.1 5 to 8 5.4 21.6 9 or more 8.9 7.3 Mean income of elderly
individuals (SE)
891.3 (110.3)
653.9 (49.0) 0.05* Income of elderly individuals
Less than one MW 6.9 6.4 0.23* *
1 MW 49.3 53
Between 1 and 3 MW 28.6 33.4 More than 3 MW 15.2 7.1 Ownership of a home
Yes 64.8 75.9 0.16* *
No 35.2 24.1
Health service used
SUS 50 33.3 0.04* *
Health plan/private
service 50 66.7
MW: Minimum Wage (R$ 415.00 or US$ 240.00); SE: Standard Error; SUS: Sistema Único de Saúde (Unified Health System)
* Wald test
= 0.07). Single elderly individuals showed the highest mean of depressive symptoms. In addition, there were signifi cant differences among age groups in RP only, with the highest mean found in the 85-to-89-year age group. The fact of one living alone, level of education
and health services used did not signifi cantly infl uence the mean of these symptoms in both groups (Table 3).
Elderly individuals who had a higher income showed a lower number of depressive symptoms in both cities, although this was only statistically signifi cant in RP. Table 2. Distribution of means of the Mini-Mental State Examination and Functional Independence Measure, according to demographic and socioeconomic characteristics of the oldest-old. Ribeirão Preto, Southeastern, and Caxias do Sul, Southern Brazil, 2009.
Variables
Ribeirão Preto Caxias do Sul
n = 155 n = 117
MMSE (SE) FIM (SE) MMSE (SE) FIM (EP) Sex
Female 19.4 (0.91) 109.3 (2.28) 18.6 (0.78) 99.0 (3.09) Male 22.9 (0.97) 111.6 (3.37) 21.2 (0.83) 109.1 (1.96)
p = 0.007* p = 0.55* p = 0.02* p = 0.005*
Age (years)
80 to 84 22.2 (0.72) 113.5 (1.97) 21.3 (0.74) 108.5 (1.58) 85 to 89 18.9 (1.43) 108.4 (3.95) 18.0 (0.97) 100.2 (4.39) 90 or more 15.1 (1.84) 93.9 (6.94) 15.9 (1.92) 81.5 (8.48)
p< 0.001* * p= 0.001* * p = 0.002* * p 0.001* *
Marital status
Widowed 19.1 (0.93) 108.3 (2.50) 18.3 (0.78) 100.3 (2.65) Married 23.4 (0.92) 114.7 (2.38) 21.4 (0.95) 106.7 (3.08) Single 20.4 (3.42) 95.4 (13.6) 17.2 (3.60) 77.3 (19.9) Divorced/separated 20.5 (4.40) 109.5 (7.00) - a - a
p = 0.004* * p= 0.14* * p = 0.07* * p = 0.05* *
Lives alone
Yes 20.3 (1.66) 110.9 (3.93) 19.9 (1.74) 103.0 (4.20) No 20.6 (0.79) 109.9 (1.99) 19.2 (0.81) 101.6 (2.88) p = 0.87* p = 0.79* p = 0.65* p = 0.78*
Level of education (years)
Illiterate 15.3 (1.18) 104.5 (4.96) 15.1 (1.34) 94.6 (6.61) 1 to 4 22.2 (0.65) 113.1 (1.61) 19.3 (0.83) 102.5 (2.41) 5 to 8 22.1 (2.19) 97.0 (7.44) 21.6 (1.32) 106.8 (4.05) 9 or more 25.7 (1.38) 115.3 (6.38) 23.4 (2.53) 99.9 (12.76) p < 0.001* * p = 0.02* * p < 0.001* * p = 0.28* *
Income (MW)
Less than 1 MW 21.3 (2.23) 113.1 (6.45) 19.8 (2.36) 94.2 (11.13) 1 MW 18.9 (1.10) 106.8 (3.29) 19.0 (0.73) 100.2 (2.91) between 1 and 3 MW 21.0 (0.76) 111.3 (2.54) 19.4 (1.16) 103.9 (3.61) More than 3 MW 24.5 (1.26) 115.9 (3.20) 23.2 (2.06) 110.8 (3.67) p= 005* * p = 0.26* * p = 0.36* * p = 0.35* *
Health service used
SUS 19.0 (0.95) 108.1 (2.52) 19.0 (1.00) 103.7 (3.41) Health plan/Private service 22.2 (0.89) 111.8 (2.52) 19.6 (0.77) 101.2 (2.61) p = 0.009* p = 0.27* p = 0.62* p = 0.47*
MMSE: Mini-Mental State Examination;.FIM: Functional Independence Measure; SUS: Sistema Único de Saúde (Unifi ed Heath System)
* Wald test
* * ANOVA test
DISCUSSION
The mean age of the oldest-old did not differ between the two cities and it is similar to that of other studies with oldest-old individuals living in the state of Rio Grande do Sul, Southern Brazil.10,20 Similarly to these studies,
the highest 5-year proportion of oldest-old was found to be distributed in the 80-to-84-year age group (63% in RP and 50% in CS; p = 0.1).10,20 According to the United
Nations Organization,18 Brazil showed the highest
growth rate in the 80-to-84-year age group, among several developing countries, between 2000 and 2005. Table 3. Mean distribution of the number of comorbidities and depressive symptoms, according to the demographic and socioeconomic characteristics of the oldest-old. Ribeirão Preto, Southeastern, and Caxias do Sul, Southern Brazil, 2009.
Variables
Ribeirão Preto Caxias do Sul
n = 155 n = 117
Comorbidities
(SE) Depressive symptoms (SE) Comorbidities (SE) Depressive symptoms (SE) Sex
Female 6.5 (0.30) 4.4 (0.57) 8.2 (0.34) 3.5 (0.38) Male 5.4 (0.74) 3.1 (0.41) 6.3 (0.34) 2.3 (0.42) p = 0.19* p = 0.07* p < 0.001* p = 0.03*
Age (in years)
80 to 84 5.9 (0.41) 3.3 (0.25) 7.1 (0.31) 3.0 (0.46) 85 to 89 6.8 (0.61) 5.6 (1.07) 8.3 (0.55) 2.9 (0.36) 90 or more 6.0 (0.43) 4.2 (1.18) 7.7 (0.58) 4.4 (0.92) p = 0.29* * p = 0.001* * p = 0.11* * p = 0.19* *
Marital status
Widowed 6.4 (0.32) 4.4 (0.62) 7.8 (0.35) 2.3 (0.40) Married 5.4 (0.73) 2.9 (0.31) 7.1 (0.37) 2.6 (0.50) Single 6.2 (1.12) 6.7 (1.25) 8.5 (1.7) 6.6 (0.99) Divorced/separated 8.1 (0.82) 5.5 (0.61) - a - a
p = 0.08* * p = 0.01* * p = 0.42* * p = 0.02* *
Lives alone
Yes 7.6 (0.50) 4.3 (0.72) 7.4 (0.41) 3.6 (0.65) No 5.9 (0.34) 3.9 (0.45) 7.7 (0.35) 3.0 (0.32) p = 0.01* p = 0.69* p = 0.64* p = 0.36*
Level of education (in years)
Illiterate 6.3 (0.52) 4.4 (0.75) 6.8 (0.40) 3.7 (0.66) 1 to 4 6.2 (0.46) 4.0 (0.55) 7.7 (0.40) 3.1 (0.47) 5 to 8 5.9 (0.64) 2.9 (0.98) 8.0 (0.58) 3.0 (0.49) 9 or more 5.1 (0.40) 3.0 (0.45) 7.6 (1.03) 2.9 (0.67) p = 0.54* * p = 0.45* * p = 0.59* * p = 0.80* *
Income (MW)
Less than 1 MW 5.6 (0.80) 4.2 (0.48) 8.3 (1.06) 4.0 (0.93) 1 MW 6.3 (0.51) 4.7 (0.67) 7.6 (0.32) 3.6 (0.45) Between 1 and 3 MW 6.0 (0.41) 3.2 (0.61) 8.0 (0.52) 2.7 (0.45) More than 3 MW 6.2 (0.78) 2.9 (0.48) 6.0 (0.77) 1.6 (0.50) p = 0.87* * p = 0.03* * p = 0.34* * p = 0.14* *
Health service used
SUS 6.2 (0.46) 4.2 (0.39) 7.3 (0.34) 3.2 (0.56) Health plan/Private service 6.0 (0.39) 3.7 (0.67) 7.8 (0.33) 3.1 (0.35) p = 0.74* p = 0.47* p = 0.23* p = 0.80*
MW: Minimum Wage (R$ 415.00 or US$ 240.00); SUS: Sistema Único de Saúde (Unifi ed Heath System)
* Wald test * * ANOVA test
The proportion of elderly females (approximately 68%) was considerably higher in both cities and similar to those found in other studies with oldest-old Brazilians.20
This factor is mainly due to women’s greater mean life expectancy, when compared to men’s. At 80 years of age, mean life expectancy of an elderly woman was 9.9 years in that year, whereas that of an elderly man was one year less.a Another factor that could have infl uenced
this difference in sex proportion is the greater rural-urban migration of women, once men are more present in typically rural activities.f Women’s greater search
for urban life conditions and services is also common among elderly females, including grandmothers, where they could be living with relatives.f
Marital status was not statistically different between the two groups either, with a predominance of widowed individuals (~ 60% in both), followed by those who were married (~ 33% in RP and 36% in CS). Likewise, in another study with the rural elderly in the same age group, living in Rio Grande do Sul, there was a predominance of 62% of widowed individuals and 29% of married ones.10 Considering the mean life expectancy
of a Brazilian as 72.8 years in 2008a and the mean age
in the present study, a relevant proportion of widowed individuals was expected to be present among the oldest-old.
The proportion of individuals living alone in CS was higher (27%) than in RP (13%; p = 0.01). The choice of living alone could only refl ect personal preferences and be a temporary stage in an individual’s life cycle. Moreover, there is a higher proportion of oldest-old Brazilians living alone, compared to the younger elderly, and this difference increased with time.b
Although level of education was similar in both groups, there was a greater proportion of illiterate elderly indi-viduals and others with a high level of education in RP than in CS, refl ecting the greater social inequality in the former. Mean level of education in the present study was higher than that of the oldest-old living in a small city of the state of Rio Grande do Sul (2.6; SD = 2.8).20
This difference could be the result of social opportuni-ties in the urban environment and the time difference of approximately one decade between studies. These social contexts, observed in such areas, are at least partly due to the distinct forms of colonization existing at that time. In the state of São Paulo, Southeastern Brazil, there was the prevalence of ownership of large areas of land, and the industrial activity developed in a capitalist and urban context, whereas the state of Rio Grande do Sul had an emphasis on rural areas, where settlements were formed and settlers had a constructive approach to living.
The results showed that the mean income of elderly individuals living in RP was higher than that of others in CS. In RP, however, there was a slightly higher proportion of individuals who received less than one MW, and especially of those who received more than three MW, compared to others in CS. Mean income of the 20% wealthiest elderly individuals in RP was approximately 7.7 times higher than that of the 20% poorest ones. This difference was about 3.3 times in CS. In fact, in 2000, RP showed a Gini index of 45 in 2000. This index was 40 in CS,c thus indicating greater
inequality in income distribution in RP.
The proportion of individuals who used health plans (63% in CS and 49% in RP), instead of the SUS (35% in CS and 45% in RP), was especially higher in CS. In contrast, the Pesquisa Nacional por Amostra de Domicílios de 1998 (PNAD – 1998 National Household Sample Survey) showed that 27% of elderly Brazilians in general had a private health plan, with a slight decrease with age (24.4% at the age of 80 years or more),9 considerably lower than the fi ndings of the
present study. Approximately one decade later, the 2007 PNAD showed only a slight increase in the proportion of elderly individuals in general who had a health plan (29%).f The fact that the elderly individuals with a
higher level of education live in urban area of medium- and large-sized cities and the high per capita GDP might have contributed to better retirement pensions and promoted the use of health plans.
The similarity of the mean MMSE score of both elderly groups was expected, once mean age, level of education and the distribution of sexes, which are the main deter-minants of the MMSE score in healthy elderly individ-uals, did not vary between these groups either.2,3 These
results are similar to those found among the oldest-old living in the city of Veranópolis, Southern Brazil, with a mean of 21.1 points (SD = 4.4) in the MMSE.2
Elderly males aged between 80 and 84 years, married and with a higher level of education performed better in the MMSE in both cities, with statistical signifi cance in RP only (p < 0.05). In CS, such associations showed this signifi cance for age, level of education and sex, and a trend towards signifi cance for marital status. These associations between MMSE and demographic variables are in accordance with those found in other studies.2,10 Although the mean MMSE score was higher
among elderly individuals with higher income and those who used health plans in both groups, this difference was only statistically signifi cant for those living in RP, probably refl ecting the effect of their greater socioeco-nomic inequality. RP had higher proportions of elderly individuals between the extremes of level of education and income, when compared to those of CS.
Elderly individuals from RP showed a higher level of independence than those from CS (p = 0.05). This difference can be partly explained by the greater propor-tion of elderly individuals with comorbidities in the latter city. Inverse associations between the presence of comorbidities and functional capacity of elderly individuals in general were also observed in other national14,15 and international studies.4,16
The level of functional dependence was higher between elderly males and those who were married, although statistically signifi cant only in CS. Functional indepen-dence varied inversely with age in both groups. The fact that mean age was slightly lower and the proportion of elderly individuals aged between 80 and 84 years was slightly higher in RP than in CS may have contributed to a higher level of functional independence in the former city. These associations are similar to those of other national15 and international studies.16
The mean number of self-reported comorbidities was signifi cantly higher in CS than in RP (7.6 and 5.9, respectively; p ≤ 0.001). In CS, all elderly individuals reported at least one chronic disease; in RP, 98% did this. Data from the 1998 PNAD showed that 75% of elderly individuals aged 80 years or more reported having at least one chronic disease from a list of eight diseases,9 whereas, in the present study, 23 diseases
were considered.
Elderly women had a higher mean number of comor-bidities and depressive symptoms than men. Sex and depressive state are associated with a higher number of diseases reported.4,10 In general, women are more
concerned about and care more for their health state and more frequently seek health services than men.9
This promotes a higher number of diagnoses received.
The number of comorbidities did not show a linear and statistically signifi cant correlation to socioeconomic characteristics, such as level of education and income. Elderly individuals who lived alone showed a higher mean of comorbidities only in RP. However, they did not differ in terms of functional or cognitive perfor-mance, when compared to those who did not live alone, which indicates that the number of comorbidities did not signifi cantly interfere with the FIM score.
Depressive elderly individuals tend to show higher prevalences of undiagnosed physical morbidities.17
This could partly explain the lower mean number of comorbidities among the elderly in RP, who had a higher mean number of depressive symptoms.
The number of depressive symptoms was not signifi -cantly higher in older age groups, whether in RP or CS, thus corroborating the fi ndings of another study with the oldest-old in Rio Grande do Sul.10 However, national7
and international studies21 show that age is positively
associated with the increase in depressive symptoms among elderly in general.
Although elderly individuals living in RP had a lower mean number of comorbidities and better level of functional independence, paradoxically, they also had a higher mean number of depressive symptoms than those in CS. It is possible that certain physical diseases are underreported, due to the elderly individuals’ depres-sive state.17
The variables approached in this study can be modu-lated by other relevant factors which were not analyzed here. Both cities are similar in terms of population sizes and GDP. However, other natural aspects that diverge from each other could be mentioned, such as the local climate and geography, in addition to different cultural contexts related to lifestyle, which, in their turn, may infl uence the health state of a population. This could be further clarifi ed by other studies that dealt with such factors.
Population aging means a higher disease load in the population, in addition to disabilities and an increase in health service use. Prevention becomes the key to change the current context and it has been found to be effective on any level, including the more advanced stages of life.19
1. Almeida OP, Almeida SA. Short versions of the geriatric depression scale: a study of their validity for the diagnosis of a major depressive episode according to ICD-10 and DSM-IV. Int J Geriatr Psychiatry. 1999;14(10):858-65. DOI:10.1002/(SICI)1099-1166(199910)14:10<858::AID-GPS35>3.0.CO;2-8 2. Argimon IIL, Stein LM. Habilidades cognitivas em
indivíduos muito idosos: um estudo longitudinal. Cad Saude Publica. 2005;21(1):64-72. DOI:10.1590/ S0102-311X2005000100008
3. Bertolucci PHF, Brucki SMD, Campacci SR, Juliano Y. O mini-exame do estado mental em uma populaçäo geral: impacto da escolaridade. Arq Neuropsiquiatr. 1994;52(1):1-7.
4. Cho CY, Alessi CA, Cho M, Aronow HU, Stuck AE, Rubenstein LZ, et al. The association between chronic illness and functional change among participants in a comprehensive geriatric assessment program. J Am Geriatr Soc. 1998;46(6):677–82.
5. Djernes JK. Prevalence and predictors of depression in populations of elderly: a review. Acta Psychiatr Scand. 2006;113(5):372-87. DOI:10.1111/j.1600-0447.2006.00770.x
6. Fillenbaum GG, Pieper CF, Cohen HJ, Cornoni-Huntley JC, Guralnik JM. Comorbidity of fi ve chronic health conditions in elderly community residents: determinants and impact on mortality. J Gerontol A Biol Sci Med Sci. 2000;52(2):M84-9.
7. Gazalle FK, Hallal PC, Lima MS. Depressão na população idosa: os médicos estão investigando? Rev Bras Psiquiatr. 2004;26(3):145-9. DOI:10.1590/S1516-44462004000300003
8. Lee E, Forthofer RN. Analyzing complex curvey data. 2. ed. Newbury Park: Sage University; 2006. (Quantitative Applications in the Social Sciences, 71). 9. Lima-Costa MF, Barreto SM, Giatti L. Condições de
saúde, capacidade funcional, uso de serviços de saúde e gastos com medicamentos da população idosa brasileira: um estudo descritivo baseado na Pesquisa Nacional por Amostra de Domicílios. Cad Saude Publica. 2003:19(3):735-43. DOI:10.1590/S0102-311X2003000300006
10. Morais EP, Rodrigues RA, Sousa VD. Assessment of depressive symptoms and cognitive impairment in elders from rural areas of the Brazilian State of Rio Grande do Sul. Public Health Nurs. 2009; 26(3):249-58. DOI:10.1111/j.1525-1446.2009.00777.x 11. Ramos LR, Simões EJ, Albert MS. Dependence in
activities of daily living and cognitive impairment
strongly predicted mortality in older urban residents in Brazil: a 2-year follow-up. J Am Geriatr Soc. 2001;49(9):1168-75. DOI:10.1046/j.1532-5415.2001.49233.x
12. Rao JNK, Scott AJ. On Chi -squared tests for multiway contingency tables with cell proportions estimated from survey data. Ann Stat. 1984;12:46-60.
13. Riberto M, Miyazaki MH, Jucá SSH, Sakamoto H, Pinto PPN, Battistella LR. Validação da versão brasileira da Medida de Independência Funcional. Acta Fisiatrica. 2004;11(2):72-6.
14. Rodrigues RAP, Scudeller PG, Pedrazzi EC, Schiaveto FV, Lange C. Morbidade e sua interferência
na capacidade funcional de idosos. Acta Paul Enferm. 2006;21(4):643-48. DOI:10.1590/S0103-21002008000400017
15. Rosa TEC, Benício MHD, Latorre MRDO, Ramos LR. Fatores determinantes da capacidade funcional entre idosos. Rev Saude Publica. 2003;37(1):40-8. DOI: 10.1590/S0034-89102003000100008
16. Stuck AE, Walthert JM, Nikolaus T, Büla CJ, Hohmann C, Beck JC. Risk factors for functional status decline in community-living elderly people: a systematic literature review. Soc Sci Med. 1999;48(4):445-69. DOI:10.1016/S0277-9536(98)00370-0
17. Sweer L, Martin DC, Ladd RA, Miller JK, Karpf M. The medical evaluation of elderly patients with major depression. J Gerontol. 1988;43(3):M53-8. DOI:10.1093/geronj/43.3.M53
18. United Nations. Department of Economic and Social Affairs. World populations prospects: the 2008 revision. New York; 2009.
19. Veras R. Envelhecimento populacional
contemporâneo: demandas, desafi os e inovações. Rev Saude Publica. 2009;43(3):548-54. DOI:10.1590/ S0034-89102009005000025
20. Xavier FMF, Ferraz MPT, Bertollucci P, Poyares D, Moriguchi EH. Episódio depressivo maior, prevalência e impacto sobre qualidade de vida, sono e cognição em octogenários. Rev Bras Psiquiatr. 2001;23(2):62-70. DOI:10.1590/S1516-44462001000200004
21. Weyerer S, Eiffl aender-Gorfer S, Köhler L, Jessen F, Maier W, Fuchs A, et al. Prevalence and risk factors for depression in non-demented primary care attenders aged 75 years and older. J Affect Disord. 2008;111(2-3):153-63. DOI:10.1016/j.jad.2008.02.008
22. World Health Organization. Active ageing: a policy framework. Geneva; 2002.
REFERENCES
Article based on doctoral thesis by Rosset I, presented to the Escola de Enfermagem de Ribeirão Preto da Universidade de São Paulo, in 2009.