O
ri
gi
na
l
a
rt
ic
le
s
Association between handgrip strength and physical activity in
hypertensive elderly individuals
Rafaela Ávila Mattioli1
Adriana Schüler Cavalli2
José Antônio Bicca Ribeiro2
Marcelo Cozzensa da Silva3
1 Universidade Federal de Pelotas, Escola Superior de Educação Física, Programa de Pós- graduação em Educação Física. Pelotas, RS, Brasil.
2 Universidade Federal de Pelotas, Escola Superior de Educação Física, Grupo de Pesquisa e Estudos Sociológicos em Educação Física e Esporte. Pelotas, RS, Brasil.
3 Universidade Federal de Pelotas, Escola Superior de Educação Física, Grupo de Estudos em Epidemiologia da Atividade Física. Pelotas, RS, Brasil.
Correspondence Marcelo Cozzensa da Silva E-mail: [email protected]
Abstract
Introduction: Handgrip is an excellent indicator of functionality, nutritional status and mortality among the elderly. Objective:To compare the handgrip strength of hypertensive elderly individuals classified by different levels and types of physical activity. Method:A cross-sectional study was carried out with a sample of 80 individuals divided into three physical activity groups, according to the leisure-time and transportation sections of
the long version of the IPAQ: active (≥150 min/week), insufficiently active (<150 min/ week) and sedentary (10 min/week). The active individuals were also separated by type
of physical activity: gymnastics, hydro gymnastics and weight training. Strength was measured by a Jamar dynamometer and consisted of a continuous handgrip movement lasting for 30 seconds. Information about demographic, socio-economic and behavioral variables was collected by questionnaire. ANOVA and paired t-test were used to compare
the means of strength. The significance level was 5%. Results:Dominant and non-dominant
handgrip average was 24.2 kgf (+8.3) and 22.0 kgf (+7.3), respectively. There was no
significant difference in the mean handgrip strength between the active and sedentary groups; however, when the type of physical activity was evaluated, the weightlifting group had a significantly higher mean than the gym and aerobics groups. Conclusion:
Handgrip strength seems to be associated with the type of activity performed, rather
than the amount of time the activity is performed per week.
INTRODUCTION
The aging process has been the focus of much recent research due to the large number of people who are now classed as elderly.1 Definitions of
aging show that, with increasing age, there is a higher incidence of chronic diseases, mostly accompanied by pain.1,2
Studies have shown that among the elderly, low levels of muscle strength are associated with early death3 and many chronic diseases, including arterial
hypertension.4 In addition, there is a decrease in
muscle strength resulting from decreased physical activity5 and consequent muscle mass reduction
(sarcopenia).6
The American College of Sports Medicine7
states that participation in physical activity programs contributes to healthy aging through an independent lifestyle, improving functional capacity. Furthermore, studies have shown that elderly individuals benefit most from programs consisting of anaerobic exercise8,9 for the
maintenance and/or gain of muscle mass and
hence muscle strength.9
In terms of the importance of muscle strength for autonomy and the avoidance of hypertension among the elderly, studies have been conducted in different contexts: assessment of handgrip strength,10 association between strength and high
blood pressure,11 influence of handgrip strength
training in controlling blood pressure,12 analysis
of muscle strength and incidence of hypertension.5
In this context, the work of Maslow et al.,5 who
analyzed the incidence of hypertension in men with different levels of muscle strength for 19 years in a longitudinal study and reported that those who had medium and high muscular strength levels
had a reduced risk of developing hypertension,
is of particular importance. This study reveals a positive association between the variables, which may suggest that changes in the lifestyle of elderly persons have a positive impact on their health.
In this context, assessing the practice of physical activity and its relationship with muscle strength is an important factor in carrying out further investigations and more effective interventions to improve the health and quality of life of the elderly population. In this sense, the present study aimed to compare the handgrip strength of elderly hypertensive patients who practiced different levels and types of physical activity.
METHOD
An observational cross-sectional study was carried out in the city of Pelotas, Rio Grande do Sul. Individuals of both sexes aged 60 years or over who had been diagnosed as suffering from hypertension and who were undergoing drug treatment were eligible for the study. Individuals with any physical or mental disability, proven by a medical certificate, which hindered their performance in the tests and study tools were excluded.
A sample calculation for the verification of the differences between means of handgrip strength
was carried out. For a power of 80%, confidence level of 0.05, a mean group strength of 25 kgf and 18 kgf and respective standard deviations of
6.8 and 4.7, a sample of 90 individuals, 30 in each group was necessary.
The selection of the participants in the study took
place in different stages. First of all the individuals who met the study requirements and who were registered with the Núcleo de "Atividades para a
Terceira Idade (“Elderly Persons Support Center”) (“NATI”) of the Escola Superior de Educação
Física (“Higher Education Physical Education
College”) of the Universidade Federal de Pelotas (NATI-ESEF/UFPEL) (n=308), were included (n=143). Of the individuals with hypertension
registered with NATI, the level of physical activity in leisure and physical transportation was measured using the long version of the International Physical
Activity Questionnaire (IPAQ). The IPAQ was
(WHO) and the Center for Disease Control and Prevention (CDC), and has been validated in a number of countries, including countries of Latin
America.13 This instrument consists of 27 questions
that measure physical activity in four areas: work, transportation, housework and leisure. Individuals who do 150 minutes or more of weekly physical
activity are considered sufficiently active.14
The participants were divided into two groups based on the results of minutes of physical activity
identified by IPAQ: active = 150 minutes or more of physical activity per week (n = 57) and insufficiently active = less than 150 minutes of activity physical per week (n = 86). In addition,
the active and insufficiently active individuals were separated by the type of physical activity
performed: aerobics (n = 45), water aerobics (n = 72) and weights based exercise (n = 26).
Those who achieved the cut-off point for the active category were placed on a list in descending order of age. Based on this list, the first individual to participate in the sample was drawn. The rest
were selected by systematically skipping two
individuals until 30 participants were reached. The same process was conducted with the list of insufficiently active elderly persons. In order to strengthen the results of the study, the active group was matched to a neighborhood group of the same
gender, age (± 5 years), skin color and morbidity (hypertension), but with a level of physical activity of less than 10 minutes weekly (inactive group).
To do this, interviewers visited the households of individuals in the active group and in front of the residence thereof, chose the first house on
the right, where he or she looked for a person
matching these characteristics. To verify pairing, the IPAQ was immediately applied to the elderly person to verify a level of physical activity of less
than 10 minutes per week. Otherwise, interviewers
continued in the same direction, house by house, until an individual with the required characteristics was found. At the end of the process, a total of 90 subjects were included in the sample.
A pilot study was performed with five elderly persons from the Associação Beneficente de Aposentados e Pensionistas de Pelotas (“Pelotas
Retirees and Pensioners Benevolent Association”),
aimed at testing the research instruments and standardizing data collection techniques among the interviewers.
The instrument used for data collection was a questionnaire containing demographic questions
(gender: male, female; age: completed years; skin
color: white, non-white; marital status: with a
partner, unmarried; education: years of schooling),
economic (monthly income: number of minimum
wages), behavioral (physical activity: minutes per week; smoking: smoking, not currently a smoker,
type of physical activity practiced: aerobics, weight
training, water aerobics), aspects of chronic pain (pain location and intensity) and depression
(geriatric depression scale:15 classified categorically
as with or without suspected depression). To
measure physical activity the leisure and physical transport sections of the long version of the IPAQ were used. Systemic arterial hypertension was evaluated with the following question: “Has a doctor ever told you that you have high blood pressure, or in other words, hypertension?”16
Maximal isometric muscle strength levels were measured using a JAMAR (Sammons Preston,
USA) type handgrip dynamometer, with values expressed in kgf. Data collection was performed
with the subject in a seated position and the elbow held tightly against the torso and flexed to 90°, with the forearm in a neutral rotation position.17
Three measurements were taken, with intervals of
one minute between each, and the average value was considered.
realization of these activities and the handgrip strength test applied, necessarily, prior to the physical activity. The collection of data for the inactive group data, both with the questionnaire and the handgrip strength test was carried out in the residence of each participant in the study.
Quality control was performed with the application of a reduced questionnaire containing
key study questions to 5% of respondents to check
for possible errors or fraud in the collection of data.
Trained data inputters were responsible for entering the data into the Epi-Info 6.0 for Windows software program. Later, the data was exported to
the Stata 11.0 statistical package, where the analysis
was carried out.
Univariate analysis of all the information collected was performed to calculate measures of central tendency (median, mean, standard
deviation and minimum and maximum values)
for the continuous variables, and proportions for the categorical variables. Normality of outcome
was tested using the Shapiro-Wilk test. For analysis
of the mean handgrip strength between the groups the ANOVA statistic was used. Comparison of
handgrip strength (HGS) among the same groups
was made with the paired t-test, with p<0.05 taken
as the level of statistical significance.
The study was approved by the Ethics Research Committee of the Escola Superior de Educação
Física of the Universidade Federal de Pelotas
under registration number nº 620.826/2014. All
the individuals who agreed to participate in the study signed a Free and Informed Consent Form.
RESULTS
Of the total of 90 individuals who comprised the initial sample, 80 effectively participated in the study (there were two losses and one refusal from the active group, which, due to pairing, led to the removal of three individuals from the inactive group and four losses from the insufficiently active group totaling ten fewer individuals in the study.
All the losses were female and the refusal was male).
Table 1 describes the total sample and the levels of physical activity of the elderly persons involved in the study. The average age of participants was
71.5 (+7.0), with the age group between 66 and
70 being the most frequently occurring (31.2%). The majority of the sample was female (88.8%), with white skin (80.0%) and did not live with a partner (60.0%). The mean years of schooling was
8.6 (+4.4), with the majority of individuals having between six and nine years of schooling. More
than 40.0% of those studied received between
two and three minimum salaries, with the mean income being 2.3 minimum salaries. There was no significant difference for the variables gender,
age and skin color between the active and inactive
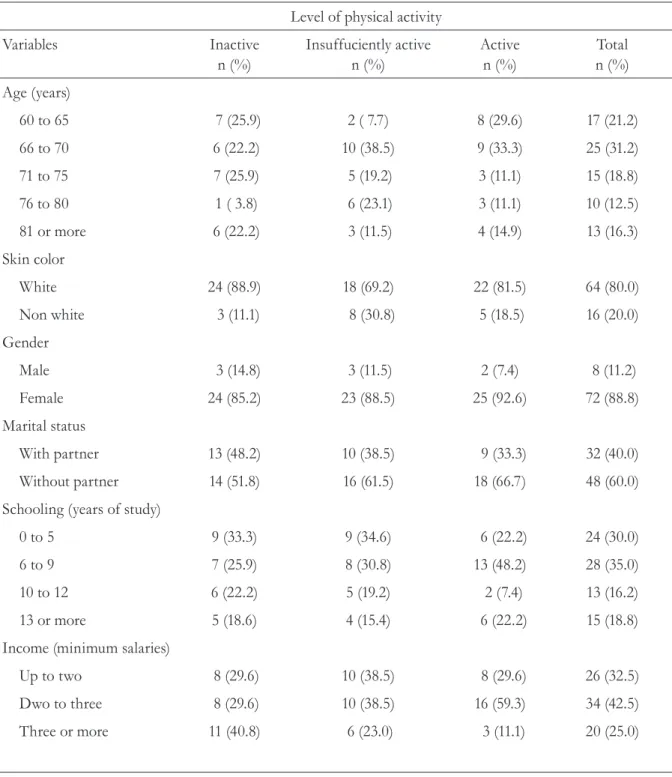
Table 1. Characteristics of sample of elderly people by level of physical activity (n= 80). Pelotas, RS, 2014.
Level of physical activity
Variables Inactive
n (%) Insuffuciently active n (%) Activen (%) n (%)Total
Age (years)
60 to 65 7 (25.9) 2 ( 7.7) 8 (29.6) 17 (21.2)
66 to 70 6 (22.2) 10 (38.5) 9 (33.3) 25 (31.2)
71 to 75 7 (25.9) 5 (19.2) 3 (11.1) 15 (18.8)
76 to 80 1 ( 3.8) 6 (23.1) 3 (11.1) 10 (12.5)
81 or more 6 (22.2) 3 (11.5) 4 (14.9) 13 (16.3)
Skin color
White 24 (88.9) 18 (69.2) 22 (81.5) 64 (80.0)
Non white 3 (11.1) 8 (30.8) 5 (18.5) 16 (20.0)
Gender
Male 3 (14.8) 3 (11.5) 2 (7.4) 8 (11.2)
Female 24 (85.2) 23 (88.5) 25 (92.6) 72 (88.8)
Marital status
With partner 13 (48.2) 10 (38.5) 9 (33.3) 32 (40.0)
Without partner 14 (51.8) 16 (61.5) 18 (66.7) 48 (60.0)
Schooling (years of study)
0 to 5 9 (33.3) 9 (34.6) 6 (22.2) 24 (30.0)
6 to 9 7 (25.9) 8 (30.8) 13 (48.2) 28 (35.0)
10 to 12 6 (22.2) 5 (19.2) 2 (7.4) 13 (16.2)
13 or more 5 (18.6) 4 (15.4) 6 (22.2) 15 (18.8)
Income (minimum salaries)
Up to two 8 (29.6) 10 (38.5) 8 (29.6) 26 (32.5)
Dwo to three 8 (29.6) 10 (38.5) 16 (59.3) 34 (42.5)
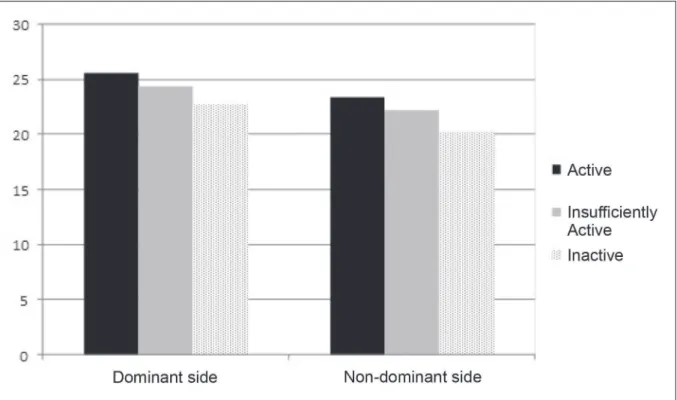
Table 2. Comparison of handgrip strength means between the different categories of physical activity level and between the same categories for different dominant sides (n= 80). Pelotas, RS, 2014.
Level of physical activity
Variable Active
(n= 27) Insufficiently active (n= 26) Inactive(n= 27)
Handgrip strength
Dominant side 25.5 (+6.3) 24.3 (+9.7) 22.7 (+8.8)
Non-dominant side 23.4 (+5.7) 22.2 (+8.2) 20.2 (+7.6)
Analysis of variance with Bonferroni correction (all p-values above 0.2); t-test for paired samples (all p-values above 0.7).
Figure 1. Handgrip strength means between the different levels of physical activity for the dominant and non-dominant sides (n= 27). Pelotas, RS, 2014.
Among the physically active elderly persons,
34.0% took part in aerobics, 56.6% in water aerobics and 9.4% in weight training. The average
duration of the physical activity was 7.1 years (+4.1)
and the most frequent weekly frequency was twice a week (86.8%).
Table 2 shows the handgrip values stratified by categories of physical activity. When comparing the handgrip averages for each of the physical activity levels between the dominant and non-dominant side, no significant differences were found between groups.
The mean difference between the dominant and non-dominant sides for physical activity level categories was also evaluated. The analysis showed
no difference between the HGS levels for each
The mean handgrip strength of the dominant and non-dominant side of the individuals in
the study was 24.2 kgf (+8.3) and 22.0 kgf (+7.3) respectively. When analyzed separately by gender, the results for women were HGS of
22.2 kgf (+6.1) and 20.6 kgf (+5.6), respectively, for the dominant and non-dominant side, and
for men, 39.3 kgf (+8.4) and 32.4 kgf (+10.2) for men for the dominant and non-dominant side, respectively.
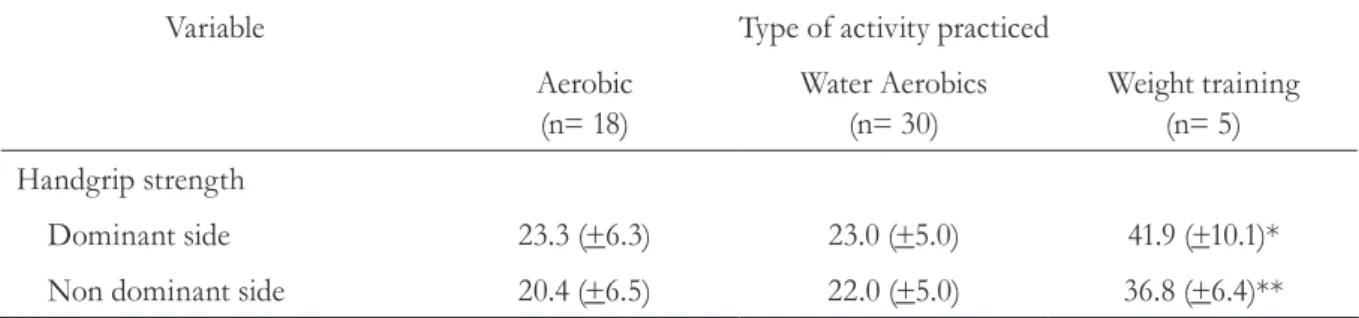
Table 3 displays the average HGS for the dominant and non-dominant sides stratified by type of physical activity performed among
the 53 individuals considered active (active and insufficiently active). The weight group had
significantly higher HGS averages than the aerobics and water aerobics groups for both the dominant and the non-dominant side. When the difference in mean HGS for the dominant and non-dominant side was evaluated by type of physical activity, no difference was found between the sides.
DISCUSSION
Although the total percentage of losses and
refusals in the present study was 11.9% (n = 10),
these were almost similar between the groups, and
so affected the statistical power of the work only.
HGS is considered an excellent indicator of overall strength, functionality and predictor of mortalidade.18 Evidence suggests that gender, age,
weight, height and dominant side influence HGS results.19,20
There was no difference in the mean HGS values among hypertensive subjects of the present study and those described by Benedetti et al.21 in a
study of active elderly persons in Santa Catarina. While a study by Fernandes et al.22 reported higher
values than those found in the present study, it
was conducted exclusively with males with a lower
mean age (58.7 years compared to 71.5 years). It is
well established in literature, when comparing men and women, that males, regardless of age, have a higher degree of muscle strength.19,23 Force has a
curvilinear relationship with age, peaking in the
third decade of life and progressively decreasing after the fifth decade, a process explained by the reduction in the number and size of muscle fibers, especially type II muscle fibers, which are fast-twitch fibers and produce a large amount of force.22,24
Another factor that seems to intervene in the measurement of handgrip measurement is related to lateral dominance. Studies show that, in terms of
peak maximum force, the dominant hand performs
better, but fatigues faster, irrespective of gender.25
Table 3. Comparison of mean handgrip strength between the dominant and non-dominant sides by type of physical activity among active and insufficiently active elderly individuals (n= 53). Pelotas, RS, 2014.
Variable Type of activity practiced
Aerobic
(n= 18) Water Aerobics(n= 30) Weight training(n= 5)
Handgrip strength
Dominant side 23.3 (+6.3) 23.0 (+5.0) 41.9 (+10.1)*
Non dominant side 20.4 (+6.5) 22.0 (+5.0) 36.8 (+6.4)**
* p<0.001 in analysis of variance with Bonferroni correction for the mean difference between the weight group and the other groups; ** p<0.001 in the analysis of variance with Bonferroni correction for the mean difference between weight group and others; t-test for paired samples (all
In terms of physical activity levels, no significant differences were found between the HGS means of the active and inactive groups and between the dominant and non-dominant side of each of these groups. This result corroborates the study by Souto et al.8 and Martin et al.26 which
compared active and inactive individuals and did not find differences in strength between the dominant and non-dominant sides. However, in the study by Martin et al.,26 the practice of physical
exercise was only self-reported and there was no separation of the type of exercise into aerobic and anaerobic, which may have influenced the findings of the study. The similar HGS results between the active and inactive groups of the present study may have been influenced by the fact that the inactive elderly persons were mostly
low-income (up to two minimum wages) and were
not institutionalized, suggesting greater active hand and wrist activity, correlated with HGS, during domestic chores.23,27 In addition, HGS is strongly
related to the activities of the daily life of the elderly persons, such as opening and closing taps, washing clothes and carrying shopping bags while traveling home.28 These types of activities are associated
with domestic and occupational activities, which were not examined in the present study.
Despite HGS not differing by level of physical activity, regardless of lateral dominance, the results show a clear upward trend of strength as individuals move from the inactive group to
the active. According results found by Skelton
et al.,29 in an intervention study, a significant
improvement in HGS was found in the group of active elderly persons compared to the group that did not undergo the intervention. The elderly who belonged to the active group underwent a program consisting of resistance exercises for a
period of three months, three times a week. The
most recent study that was similar to this described 36 previously evaluated elderly persons divided into two groups, one of which was active and which was submitted to muscular strength, balance and functional mobility exercises and the other
(control) only performed stretches. The results
found a statistical improvement in the active group only.30 It should be considered that the goal of
the previous studies was to increase the muscle strength of the elderly involved, which certainly influenced the results. In addition, the present study experienced a loss of statistical power due to losses and refusals, which may have influenced the results of statistical analysis.
Most studies found that active men and women are able to maintain muscle strength at higher levels than inactive people, 23,27 reinforcing the
theory that physical activity is directly related to muscle strength. Moreover, physical inactivity may contribute to functional loss among the elderly, caused by a reduction in muscle mass and strength deficit, decreasing fitness and physical
performance, and making the elderly person
subsequently more inactive.26
The values for the active and insufficiently
active groups were above 20 kgf, similar to those of
the inactive group. Studies suggest that, regardless of the profile of the elderly person, values below
20 kgf represent a risk of future dependence and
low levels of health.31
Regarding type of physical activity, the present study found that the group that practiced weight based exercise had higher mean HGS scores than the aerobics and water aerobics groups for both the dominant side and the non-dominant sides. However, there was no significant difference between the dominant and non-dominant sides for the aerobics and water groups. Kura et al.,28 in
a study comparing the HGS of those practicing water aerobics and aerobics, observed a difference between the groups only in the handgrip of the left hand (the non-dominant side of most of the
subjects), with higher values found for the water aerobics group (27.34 kgf against 24.8 kgf). The
benefits promoted by resistance training depend on several factors, such as intensity, frequency and volume of training.32 The aerobics and water aerobics
require handgrip, which may have contributed to an equalizing in strength between groups.
The weight group presented higher HGS values than the other groups, indicating that, in general, higher intensity loads provide significantly greater increases in strength gains in elderly persons, compared with smaller loads.33 These findings
can be explained by the fact that the main factors that contribute to the increase in strength due to training are the neural and hypertrophic adaptations.33
Several exercises are currently prescribed for the elderly, such as water aerobics, load based training, and neuromuscular training, all of which, according to the authors of the studies in question, bring benefits in the short, medium and long term.8,9,28,30 However, it has been observed
that people who perform high intensity resistance exercises, such as weight training, have higher muscular strength levels than the others.8 A study
carried out by Vale et al.33, in which the authors
observed significant differences in muscle strength among elderly persons who performed weight
training for 16 weeks in comparison with a control
group, corroborates these findings.
When the goal is to improve cardiovascular fitness and lower blood pressure, aerobic exercise is considered the best option.8 However, studies have
shown that resistance exercise of moderate to high intensity can reduce blood pressure in hypertensive individuals.32,34,35 However, the cardiovascular responses to exercise depend on factors such as the volume of muscle mass involved, duration, intensity, repetition number and total charge.32
The prevalence of systemic hypertension (SH) among the elderly can reach 65 cases per 100 inhabitants, making it a determining factor for the
high morbidity and mortality of this population.35 A recent study showed that elderly people with a
higher degree of muscle strength are at lower risk
of developing high blood pressure.5 Nevertheless, there is still a shortage of literature on the subject,
especially in Brazil, where no studies were found that specifically evaluate the relationship examined here. Existing studies have so far been conducted only with the elderly, without any information about the existing character of chronic disease in such individuals. Another point to be emphasized is the need to carry out pairing during data collection for important confounding factors such as gender, age, race and place of residence. On the other hand, some limitations of the present study should be considered. First, the cross-sectional design used did not allow inferences to be made about the order of events, especially regarding the onset of morbidity and early physical activity. Moreover, during the review process, a new comparison for mean HGS values that was not considered in the original
study (comparison between types of activities) was
established. This analysis showed a lower statistical power to verify the possible associations. However, even with reduced power, significant differences were found between the weight group and the others, which justifies continuing with this analysis.
CONCLUSION
The results of the present study indicate that there was no significant difference in handgrip strength between the active and inactive elderly. However, when it comes to the types of physical activity in which they were involved, elderly persons who practiced weight training had a higher mean handgrip strength higher than the water aerobics and aerobic groups.
Considering handgrip is a predictor of mortality and is associated with chronic diseases, it is suggested that physical activity programs for the
elderly aim at maintaining/increasing handgrip
REFERENCES
1. Horta HL, Bueno CB, Mendes IM. Subsídios para
Atenção Integral do Idoso: perfil do usuário em uma unidade básica de saúde de Franca, SP. Investigação
2010;10(Suppl 2):36-42.
2. Dellaroza MG, Pimenta CM, Matsuo T. Prevalência e caracterização da dor crônica em idosos não institucionalizados. Cad Saúde Pública
2007;23(5):1151-60.
3. Stenholm S, Härkänen T, Sainio P, Heliövaara M,
Koskinen S. Long-term changes in handgrip strength
in men and women- accounting the effect of right censoring due to death. J Gerontol Ser A Biol Sci Med
Sci 2012;67(10):1068-74.
4. Cheung CH, Nguyen US, Au E, Tan KC, Kung AW. Association of handgrip strength with chronic
diseases and multimorbidity. Age 2013;35(3):929-41. 5. Maslow AL, Sui X, Colabianchi N, Hussey J, Blair
SN. Muscular strength and incident hypertension in normotensive and prehypertensive men. Med Sci
Sports Exerc 2010;42(2):288-95.
6. Kim KE, Jang SN, Lim S, Park YJ, Paik NJ, Kim
KW, et al. Relationship between muscle mass and physical performance: is it the same in older
adults with weak muscle strength? Age Ageing 2012;41(6):799-803.
7. Chodzko-Zajko WJ, Proctor DN, Fiatarone Singh
MA, Minson CT, Nigg CR, Salem GJ, et al. Exercise and physical activity for older adults. Med Sci Sports
Exerc 2009;41(7):1510-30. Special communications:
Position Stand.
8. Souto PP, Bandeira TF, Sandoval RA. Força muscular de membros inferiores e superiores: estudo correlacional e comparativo entre grupos de idosas.
Trances 2010;3(1):129-48.
9. Harris C, DeBeliso MA, Spitzer-Gibson TA, Adams KJ. The effect of resistance-intensity on strength-gain response in the older adult. J Strength Cond Res
2004;18(1):833-88.
10. Hughes VA, Frontera WR, Wood M, Evans WJ,
Dallal GE, Roubenoff R, et al. Longitudinal muscle
strength changes in older adults: influence of muscle mass, physical activity, and health. J Gerontol Ser A
Biol Sci Med Sci 2001; 56(5):209-17.
11. Tibana R, Balsamo S, Prestes J. Força muscular relativa e pressão arterial em mulheres sedentárias.
Rev Bras Cardiol 2011;24(3):163-8.
12. Badrov MB, Horton S, Millar PJ, McGowan
CL. Cardiovascular stress reactivity tasks
successfully predict the hypotensive response of isometric handgrip training in hypertensives.
Psychophysiology 2013;50(4):407-14.
13. Craig CL, Marshall AL, Sjostrom M, Bauman AE,
Booth ML, Ainsworth BE, et al. International
physical activity questionnaire: 12-country reliability
and validity. Med Sci Sports Exerc 2003;35(8):1381-95.
14. Haskell WL, Lee IM, Pate RR, Powell KE, Blair
SN, Franklin BA, et al. Physical activity and public
health: updated recommendation for adults from the American College of Sports Medicine and the American Heart Association. Med Sci Sports Exerc
2007;39(8):1423-34.
15. Almeida O, Almeida S. Confiabilidade da versão
brasileira da Escala de Depressão em Geriatria (GDS) versão reduzida. Arq Neuropsiquiatr 1999; 57(2):421-26.
16. Instituto Brasileiro de Geografia e Estatística
[Internet]. Rio de Janeiro: IBGE; [1995]- . Pesquisa
Nacional por Amostra de Domicílios – PNAD. 2008. [acesso em 17 mai 2014]; [aproximadamente
2 telas]. Disponível em: http://www.ibge.gov.br/ home/estatistica/populacao/trabalhoerendimento/ pnad2008/questpnad2008.pdf
17. Sociedade Brasileira de Terapeutas da Mão [Internet]. Ribeirão Preto: SBTM; 2008. Recomendações para
avaliação do membro superior; 2008 [acesso em 15
mai 2014]; [aproximadamente 2 telas]. Disponível em:
http://www.sbtm.org.br
18. Norman K, Stobäus N, Gonzalez MC, Schulzke JD,
Pirlich M. Hand grip strength: outcome predictor
and marker of nutritional status. Clin Nutr 2011; 30(1):135-42.
19. Demura S, Aoki H, Sugiura H. Age differences in
hand grip power in the elderly. Arch Gerontol Geriatr
2011;52(3):176-9.
20. Dias JA, Ovando AC, Külkamp W, Borges Junior
NG. Força de preensão palmar: métodos de avaliação e fatores que influenciam a medida. Rev Bras
Cineantropom Desempenho Hum 2010;12(3):209-16.
21. Benedetti TR, Maurer ST, Borges LJ, Conceição R,
Lopes M, Morini S. Associação entre os diferentes
testes de força em idosos praticantes de exercícios
físicos. Fit Perform J 2010;9(1):52-7.
22. Fernandes AA, Silva CD, Vieira BC, Marins JCB. Validade preditiva de equações de referência para força de preensão manual em homens brasileiros de
meia idade e idosos. Fisioter Pesqui 2012;19(4):351-6.
23. Costa TB, Neri AL. Medidas de atividade física e
fragilidade em idosos: dados do FIBRA Campinas, São
Paulo, Brasil. Cad Saúde Pública 2011;27(8):1537-50.
24. Gunther CM, Bürger A, Rickert M, Crispin A,
Schulz CU. Grip strength in healthy caucasian adults:
25. Nicolay CW, Walker AL. Grip strength and
endurance: influences of anthropometric variation, hand dominance, and gender. Int J Ind Ergon
2005;35(7):605-18.
26. Martin FG, Nebuloni CC, Najas MS. Correlação entre estado nutricional e força de preensão palmar em
idosos. Rev Bras Geriatr Gerontol 2012;15(3):493-504.
27. Matsudo SM, Marin RV, Ferreira MT, Araújo TL,
Matsudo V. Estudo longitudinal - tracking de 4 anos -
da aptidão física de mulheres da maioridade fisicamente
ativas. Rev Bras Ciênc Mov 2004;12(3):47-52.
28. Kura GG, RibeiroLSP, Niquetti R, Tourinho Filho
H. Nível de atividade física, IMC e índices de força muscular estática entre idosas praticantes de hidroginástica e ginástica. Rev Bras Ciênc Envelhec
Hum 2004;1(2):30-40.
29. Skelton DA, Young A, Greig CA, Malbut KE. Effects
of resistance training on strength, power, and selected
and functional abilities of women aged 75 and older. J Am Geriatr Soc 1995;43(10):1081-87.
30. Costa EL, Bastos Filho PSC, Moura MS, Sousa TS,
Lemos A, Pedrosa MAC. Efeitos de um programa
de exercícios em grupo sobre a força de preensão manual em idosas com baixa massa óssea. Arq Bras
Endocrinol Metab 2012;56(5):313-8.
31. Jylha M, Guralnik JM, Balfour J, Fried LP. Walking
difficulty, walking speed, and age as predictors of
self-rated health: the Women’s health and aging study.
J Gerontol Ser A Biol Sci Med Sci 2001;56(1):609-17.
32. Olher R, Bocalini DS, Bacurau RF, Rodriguez D,
Figueira Jr A , Pontes FL Jr, et al. Isometric handgrip
does not elicit cardiovascular overload or post-exercise hypotension in hypertensive older women.
Clin Interv Aging 2013;8(1): 649-55.
33. Vale RG, Novaes JS, Dantas EHM. Efeitos do treinamento resistido na força máxima, na flexibilidade e na autonomia funcional de mulheres idosas. Rev Bras Cineantropom Desempenho Hum
2006;8(4):52-8.
34. Moraes MR, Bacurau RF, Simões HG, Campbell CS,
Pudo MA, Wasinski F, et al. Effect of 12 weeks of
resistance exercise on post-exercise hypotension in stage 1 hypertensive individuals. J Hum Hypertens
2012;26(1):533-9.
35. Moraes MR, Bacurau RF, Casarini DE, Jara ZP,
Ronchi FA, Almeida SS, et al. Chronic conventional resistance exercise reduces blood pressure in stage 1 hypertensive men. J Strength Cond Res
2012;26(4):1122-9.
Received: September 23, 2014