Prevalence of High Blood Pressure Levels and Associated Factors
among Adults in Southern Brazil
Giana Zarbato Longo
1,
Janaina das Neves
2,
Valmir Martins Luciano
1,
Marco Aurélio Peres
3Programa de Pós-Graduação em Saúde Coletiva, Universidade do Planalto Catarinense, Lages, SC1; Departamento de Nutrição, Universidade Federal
de Santa Catarina, SC2; Programa de Pós-Graduação em Saúde Pública da Universidade Federal de Santa Catarina, Florianópolis, SC3, Brasil.
Correspondence: Giana Zarbato Longo •
Av. Castelo Branco, 170, Bairro Universitário Caixa Postal 525, 88.509-900, Lages, SC, Brasil.
E-mail:[email protected]
Manuscript received on 03/20/08; revised manuscript received on 09/08/08; accepted on 10/10/08.
Summary
Background: Few population-based studies have been carried out in Brazilian medium-sized cities in order to estimate high levels of blood pressure and associated factors.
Objective: To estimate the prevalence of high blood pressure and associated factors among adults in Lages, Southern Brazil.
Methods: Population-based cross sectional study carried out in adults aged 20 to 59 years living in the urban area (n=2,022). The dependent variable was high levels of blood pressure (≥ 140/90 mmHg). Exploratory variables: sex, age, schooling, per capita family income, self-reported ethnicity, body mass index, tobacco and alcohol addiction, physical activity and self-reported diabetes. The Chi-square test and linear trends were used to test associations between the dependent variable and the exploratory variables. Unadjusted and adjusted multivariate Poisson regression analyses were performed.
Results: Response rate was 98.6%. The prevalence of high blood pressure levels was 33.7% (95CI%: 31.7-36.1) for the population as a whole, ranging from 31.1% in men to 38.1% in women. After statistical adjustment for possible confounders, the following were associated with high blood pressure levels: male gender (PR =1.22 95%CI 1.1-1.4), older age, overweight (PR= 1.40 95%CI 1.18-1.67), obesity (PR = 1.95 95% CI 1.61-2.36), Asian ethnicity (PR 1.29 95%CI 1.12-1.48) and self-reported diabetes mellitus (PR 1.29 95%CI 1.12-1.48).
Conclusions: One third of the assessed adults presented high blood pressure levels, similar to most of the Brazilian findings. Factors that can be prevented, such as overweight, obesity and self-reported diabetes were associated with high blood pressure levels.(Arq Bras Cardiol 2009; 93(3) : 360-366)
Key words: Hypertension; Prevalence; Risk Factors; Adult; Lages (SC); Brazil.
Introduction
The high prevalence and the social and economic consequences of systemic arterial hypertension (SAH) characterize it as a public health problem in Brazil1. In
2006, 17 million Brazilians presented hypertension, which represented 35% of adult individuals older than 40 years2.
Arterial hypertension is associated to a family history of hypertensive disease and other modifiable factors such as overweight, insufficient physical activity, high sodium intake, smoking, abusive alcohol consumption, self-medication, use of drugs that affect the blood pressure (BP), dyslipidemia and diabetes mellitus3.
One of the diagnostic criteria of hypertension is the presence of BP values > 140/90 mmHg, measured in at least two different times4. In epidemiological studies,
measurements of high BP levels estimate the prevalence of
hypertension. Population-based national studies have been carried out since the 90s in all regions of the country, except for the northern region5.
The present study aimed at estimating the prevalence of the high BP among adults living in the urban area of the town of Lages, state of Santa Catarina, southern Brazil. There are no epidemiological information regarding the prevalence of pressure levels and associated factors in the age range and the population evaluated in the present study.
Methods
The present study was carried out in the urban area of the town of Lages, located in the mountain region of the state of Santa Catarina, southern Brazil, 176.5 km from the capital of the state, Florianopolis. The town population in the year 2005 was 166,733 inhabitants, with 97.4% of them residing in the urban area (162,397 inhabitants). The town presented in the year 2000 a dependence ratio of 53.8% and a city human development index (HDI) of 0.8136. The reference
part of a large investigation in which several health-related outcomes were studied.
To calculate the size of the sample, we used the formula for estimating prevalence, considering a reference population equal to 86,998 individuals, confidence level of 95%, prevalence of 25%7,sample errorof 3.5% and study design
effect (sampling by conglomerate) estimated as being equal to 2. Ten percent (10%) was added in order to compensate for refusals and losses and 20% as control of confounding factors, totaling 745 individuals. The calculation was carried out with the program Epi-Info8.
As the investigation included other outcomes such as self-reported diseases, life habits, body mass index, level of physical activity, oral health and use of medical-dental services, the total sample consisted of 2,051 adult individuals. The sampling process was carried out by conglomerates in two stages. First, the censitary sectors were selected by drawing lots, then a block was selected and in that, a corner, on which a starting point was selected for the trajectory to the houses, with the field work being initiated clockwise from the corner selected by drawing lots. Sixty censitary sectors were selected among the 186 sectors in Lages by drawing lots, without replacement, using tables of random numbers9.
All adults present in the selected houses were interviewed at the moment of data collection. All adults living at the house were considered eligible for the study, totaling, approximately, 34 individuals in 17 houses in each sector. All residents from the houses visited at least four times, with at least one visit on weekends and another during the evening period, in which the examiner/interviewer was incapable of locating the interviewee or in cases of refusal to participate, were considered losses.
Exclusion criteria included: pregnant women, amputees, bedridden individuals, individuals with casts, individuals with psychiatric disorders and those who, or some reason, could not remain in the adequate position for the required measurements.
The home visits included the use of a face-to-face questionnaire, BP measurement and anthropometric measurements. To achieve the standardization of the objective measurements such as anthropometric variables and BP values, all field researchers were trained. After the standardization, the pre-test of the questionnaire was carried out by applying it to thirty adult individuals of the same age range of the study in a comprehensive area of a local Basic Health Unit of the town. The pilot study was carried out with 30 people in a censitary sector randomly selected by drawing lots, among those that were not selected for the study itself.
The dependent variable was the systolic (SAP) and diastolic arterial pressure (DAP) levels, later categorized as normal or elevated. The individual was defined as presenting elevated blood pressure levels when the SAP >140 mmHg and/or DAP >90 mmHg, or individuals known to be hypertensive, undergoing regular use of anti-hypertensive medication, whose BP levels were elevated or not at the moment of the interview10. The BP levels were measured before and after the
questionnaire was applied and the second measurement was the one considered for the study11,12.The measurements were
carried out with the interviewee in the sitting position, with feet planted on the floor, left arm relaxed and supported on a table at the level of the heart and the palm facing upward. Electronic equipment with a digital reading system10 (Techiline®) that
had been adequately calibrated were used to measure the blood pressure levels
The independent variables studied were: sex (dichotomous), age (in years), degree of schooling (in complete years of formal education), per capita family income (in minimum wages), self-reported ethnicity, body mass index (in kg/m2), waist
circumference (in cm), smoking, problems with alcohol, level of physical activity and self-reported diabetes mellitus.
The per capita family income was calculated as the sum of the income in the previous month divided by the number of residents in the house (one minimum wage was equivalent to R$380.00 or approximately U$211), categorized according to quartiles (0.026-0.500; 0.510–0.880; 0.890–1.580; 1.590–19.740); the self-reported ethnicity followed the recommendations of the Brazilian Institute of Geography and Statistics (IBGE): Black, Brazilian Mulatto, Caucasian, Asian and Native Brazilian6.
Body weight was obtained with a portable anthropometric scale (Tanita®) with a capacity of 130 kg, calibrated, placed on a level surface; the individuals wore light clothing and were standing with their feet placed together and the arms hanging along the body. Height was measured with an inelastic measuring tape with a length of 150 cm, fixed with adhesive tape to a vertical surface without baseboards to a point 100 cm far from the floor, in an inverted position. During the measurement, the individuals were barefoot and in the orthostatic position, without any head adornments, in the Frankfurt position; with shoulders, gluteal muscles and heels touching the wall and feet placed side-by-side. After the measurements, the body mass index was calculated (weight in kg divided by the square height in meters). Individuals with a BMI < 25 were considered eutrophic; those with BMI between 25.0 and 29.9 were considered as being overweight
and those with BMI ≥30 were classified as obese13.
The measurement of the waist circumference (WC) was carried out with an inelastic measuring tape with millimeter markings, with a capacity of 1.5 m. The measurement was carried out with the individual in the standing position. The tape surrounded the natural line of the smallest waist circumference and the reading was performed at the moment of expiration. The cutoff values used for WC measurement
were: ≤ 102 cm for men and ≤ 88 cm for women14.
Smoking was classified in three categories: non-smoker, ex-smoker and current smoker15. Problems with alcohol were
investigated to identify risk factors for SAH using the CAGE questionnaire, validated for its use in Brazil16.
The level of physical activity was categorized as active or sedentary, according to the summarized version in Portuguese of the International Physical Activity Questionnaire - IPAQ17.
The individual was asked whether the physician had diagnosed the presence of diabetes mellitus.
do Planalto Catarinense/UNIPLAC). The quality control of the data collection was carried out by applying the questionnaire to 10% of the sample through a telephone interview.
The data were entered in duplicate in the Epi-Info program, version 6.08 by previously trained keyboarders. After verifying
the reliability of the data, the statistical analyses were carried out using the statistical package STATA version 9.018. The
analysis was weighted by sex19, with the weights being
determined by the ratio between the proportions of individuals at IBGE and the sample. Initially, the descriptive statistical analysis of the data was carried out. The Chi-square test and the linear trend analysis were used to verify the associations between the dependent variable (pressure level) and each independent variable. The proportions, prevalence ratios and their respective confidence intervals were presented.
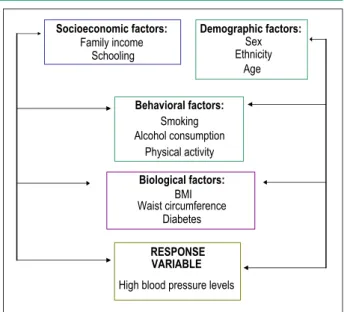
The multiple analysis of variance was carried out by Poisson, presenting the prevalence ratios and respective 95% confidence intervals. The analyses followed a theoretical model of determination, hierarchized in three blocks of variables (Figure 1). The first block, more distal, consisted of the socioeconomic and demographic variables, which condition the variables in block 2, behavioral factors that influence the biological variables from block 3 and the these, the study outcome20.
The variables with p<0.20 at the bivariate analysis were selected for the multiple analysis, comparing the prevalence of elevated blood pressure levels according to the categories of the variables (prevalence ratios – PR). The criterion for the permanence of the variables in their hierarchical levels and
in the final model was p≤ 0.05.
The project was submitted to and approved by the Ethics Committee in Research of UNIPLAC under protocol #.01/2007.
The study participants signed the Free and Informed Consent Form. When some type of health problem was identified in any of the participants, the interviewers referred him or her to the nearest Basic Health Unit for treatment.
Results
All data are presented with the proportions weighted by the gender distribution. The response rate was 98.6%, which corresponds to 2,022 investigated individuals, of whom 47.7% were males and 52.3% were females; the remaining 1.4% corresponds to refusals and losses. The estimated prevalence of elevated BP levels was 33.7% (95% CI: 31.4-36.1).
The mean age was 31.02 years (SD: 11.62). The mean degree of schooling was 9.15 years (SD=4.2) and around 50% of the sample earned up to R$ 334.00 per capita.
The socioeconomic and demographic variables associated with elevated BP levels were: sex, age, degree of schooling and ethnicity. Males presented a prevalence of elevated BP levels of 31.1% and females, of 38.1%. Individuals from the group with a lower degree of schooling had a prevalence that was 62% higher than those with 12 years of schooling or more. There was a dose-response association between age and the prevalence of BP levels that ranged from 16.2% among the younger individuals to 56.5% in the older group. The Asian ethnicity presented a prevalence of elevated BP levels of
54.1, which was higher than the one presented by Caucasian individuals (Table 1).
Table 2 shows a positive association between elevated BP levels and BMI. The prevalence ratio was 1.8 for overweight individuals and 2.9 for obese ones, when compared with individuals that had normal weight. Regarding the waist circumference, the individuals considered to be in the non-ideal category presented a higher prevalence of elevated BP levels (p<0.001). The prevalence of elevated BP levels was 92% higher among the individuals that referred having diabetes mellitus, when compared to those without the disease, whereas the prevalence of the elevated BP levels was 31% higher among ex-smokers when compared to non-smokers.
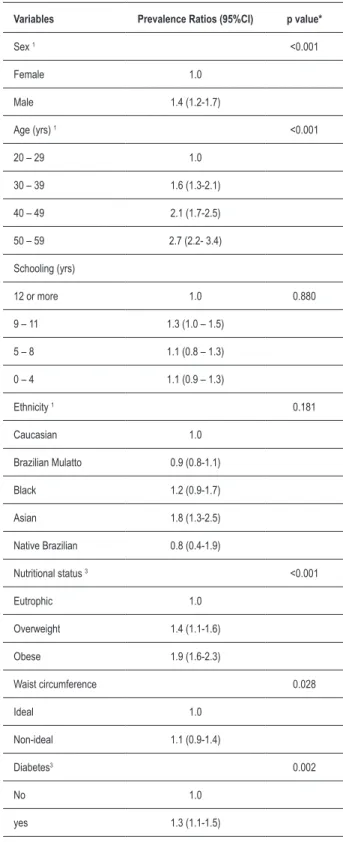
After the adjustment by the variables from the same block and by the variables from the upper blocks, the following factors were associated with elevated BP levels: male sex (p<0.001), older age (p<0.001), Asian ethnicity (PR=1.8 (95%CI: 1.3-2.5), overweight and obesity (p<0.001) and self-referred diabetes mellitus (p=0.002) (Table 3).
Discussion
In Brazil, population-based studies that estimate the arterial hypertension through elevated BP levels are still scarce and therefore, we used studies that analyze the disease for comparison, as these levels are associated with it. Discrepant prevalence rates in these studies can be justified by the use of different methodological procedures. For instance, different cutoffs used to define SAH, variations in the target-population (different age ranges, samples with selected groups), racial/ ethnicity, cultural and socioeconomic variations among the populations in the several studied regions.
In observational, cross-sectional studies, the main limitations are caused by the possibility of selection bias, reverse-causality bias and the involvement of confounding factors. In the present study, we used a representative sample
Behavioral factors:
Smoking Alcohol consumption
Physical activity
Socioeconomic factors:
Family income Schooling
Biological factors:
BMI Waist circumference
Diabetes
RESPONSE VARIABLE
Demographic factors:
Sex Ethnicity
Age
High blood pressure levels
of the population, homogeneously distributed across the different age ranges.
The proportion of females in the present study was higher than the one found in the general population. To correct this difference, the analyses were weighted by sex. The use of calibrated instruments, the standardization and the data quality control, as well as the use of validated questionnaires contributed to internal validity of the study.
Elevated BP levels were defined as levels > 140/90 mmHg, or in the case of individuals that regularly used anti-hypertensive medication. Two BP measurements were performed at the individuals’ homes and the second one was considered for the study, which is in accordance with the literature11.
The present study showed a higher prevalence of elevated BP levels in male individuals, older-aged individuals, those of Asian ethnicity and the self-referred diabetics. According to the recent national investigation of risk factors for non-transmissible diseases of the National Cancer Institute, the prevalence of elevated blood pressure levels for the southern region of Brazil varied from 12.1% to 33.5% in individuals aged 25 to 59 years21.
Other epidemiological studies have also demonstrated a positive association between age and hypertension22,24.
The findings of the present study show an association between hypertension and overweight/obesity, corroborating the studies carried out in Pelotas, state of Rio Grande do Sul, Brazil25, which used a single measurement of the systolic
Table 1 – Distribution of the socioeconomic and demographic variables of the sample, prevalence of high blood pressure levels. Lages-SC, 2007.
Variables n (%)# Prevalence of high
blood pressure levels
Prevalence Ratio
(95%CI) p value
Sex (n=2,022)
Male 779 (47.7) 31.1 1.0 0.001*
Female 1243 (52.3) 38.1 1.22 (1.1-1.4)
Age (yrs) (n=2,018)
20 – 29 623 (30.8) 16.2 1.0 <0.001**
30 – 39 444 (22.0) 29.5 1.8 (1.4-2.3)
40 – 49 528 (26.2) 40.0 2.4 (2.1-3.0)
50 – 59 423 (21.0) 56.5 3.5 (2.9- 4.2)
Schooling (yrs)(n=1,995) <0.001**
12 or more 456 (22.9) 25.2 1.0
9 – 11 611 (30.7) 33.7 1.3 (1.1-1.7)
5 – 8 571 (28.9) 33.8 1.3 (1.1-1.6)
0 – 4 357 (17.4) 43.4 1.7 (1.5-2.0)
Income – quartiles (n=1,984) 0.312**
4th (1.590 – 19.740) 467 (23.5) 32.7 1.0
3rd (0.890 – 1.580) 515 (26.0) 32.2 0.9 (0.80-1.2)
2nd (0.600 – 0.880) 500 (25.2) 37.2 1.1 (0.9-1.4)
1st (0.026 – 0.500) 502 (25.3) 32.8 1.0 (0.8-1.2)
Ethnicity (n=2,017)
Caucasian 1237 (61.3) 33.0 1.0 0.045*
Brazilian Mulatto 595 (29.5) 33.6 1.0 (0.8-1.2)
Black 125 (6.2) 38.4 1.2 (0.9-1.5)
Asian 37 (1.8) 54.1 1.6 (1.2-2.2)
Native Brazilian 23 (1.1) 21.7 0.6 (0.3-1.6)
*- Pearson’s Chi-square Test. ** - Linear Trend Test.
Table 2 – Distribution of the sample nutritional status, behavioral variables and morbidity, prevalence of high blood pressure levels, prevalence ratios and conidence intervals (95%CI). Lages-SC, 2007.
Variable n (%)# Prevalence of blood
pressure levels
Prevalence ratios
( IC 95%) p value
Nutritional status (n=2.022)
Eutrophic 835 (42.4) 19.5 1.0 <0.001**
Overweight 672 (34.1) 36.0 1.8 (1.5-2.2)
Obese 462 (23.5) 55.8 2.9 (2.4-3.4)
Waist circumference <0.001*
Ideal 1116 (56.2) 25.8 1.0
Non-ideal 817 (43.8) 44.1 1.7 (1.5 - 1.9)
Smoking status (n=2.016)
Never smoked 1090 (54.1) 32.2 1.0 0.002*
Ex-smoker 326 (16.2) 42.3 1.3 (1.1-1.5)
Current smoker 600 (29.8) 32.2 1.0 (0.9-1.2)
Problems with alcohol (n=2,022) 0.328*
No problems 1790 (88.5) 33.4 1.0
With problems 232 (11.5) 36.6 1.1 (0.9-1.3)
Physical activity (n=1.952) 0.299*
Active 584 (29.8) 35.6 1.0
Sedentary 1368 (70.1) 33.2 1.1 (0.9-1.2)
Diabetes (n=2.012) <0.001*
No 1873 (93.1) 31.5 1.0
Yes 139 (6.9) 62.6 2.0 (1.7-2.3)
*- Pearson’s Chi-square Test. ** - Linear Trend Test.
# - proportions are presented after being weighted for sex.
arterial pressure > 160 mmHg and a diastolic arterial pressure > 95 mmHg or in current treatment; in 15 Brazilian capital cities and the Federal District21, which used the self-referred
hypertension; in Bambui, state of Minas Gerais23, measured
by the mean value between the second and the third
measurement ≥ 140 mmHg for DAP and 90 mmHg for SAP
or in current treatment; in Catanduva, state of Sao Paulo26,
which used the mean value between the first and the second
measurement ≥ 140 mmHg for DAP and 90 mmHg for SAP
and in Goiania27, which used the second measurement ≥ 140
mmHg for DAP and 90 mmHg for SAP.
Another important association identified in the study was the higher prevalence of hypertension in individuals with self-referred diabetes. In 1997, a population-based study carried out with adult individuals in Bambui23, Minas Gerais,
disclosed a prevalence of arterial hypertension that was 4.75-fold higher in patients with diabetes mellitus, when compared to individuals without the disease.
The ethnicity variable is known to be a factor associated to arterial hypertension28 and the present study confirms
such association, showing a higher prevalence for individuals of Asian ethnicity. Among the marked sociocultural changes that the Japanese population underwent after immigrating to Brazil, are alterations in dietary habits and levels of physical activity29. In addition to environmental factors, one must
consider the importance of epigenetic factors for the genesis of the metabolic syndrome30. There was no association
between the Black ethnicity and hypertension; however, the confidence intervals showed borderline values. Evidence from other studies showed the association between hypertension and Black ethnicity25,28.
the control and prevention of NTCDs must be incorporated to the public health agenda and health policies of Brazil, emphasizing the need to establish educational actions on diet and nutrition, capable of effectively reaching all economic strata of the population.
In 2006, public policies were released to prevent hypertension and promote health among the Brazilian population. The National Policy of Primary Attention to Hypertension and Diabetes Mellitus launched a Practical Manual on Hypertension, with the objective of presenting to the health area professionals, especially those working at the Public Health System, in a practical and didactic form, the main questions related to the diseases, in order to reduce their impact on the Brazilian population2. The National Policy
of Diet and Nutrition, through the Dietary Guide for the Brazilian Population32, shows the official dietary directives for
the prevention of hypertension, as well as for the promotion of health, based on the Global Strategy of the World Health Organization33.
Among the strategies to reduce the prevalence of elevated BP levels are the increased access to primary care, the incentive of popular health education, the stimulation of the family adherence to treatment, the guarantee of an adequate diet, thus preventing overweight, obesity and diabetes mellitus, as well as the prevention of the habit of smoking and the abusive alcohol consumption and the incentive of the practice of regular physical activities.
In conclusion, the prevalence of elevated BP levels in the town of Lages, state of Santa Catarina, Brazil, was 33.7%, corroborating other regional population-based studies22,24.
Population-based investigations on the prevalence of elevated BP levels are fundamental in the country. The identification of the main factors associated to hypertension through population-based studies and effective control strategies, combined with community education and the prioritized monitoring of individuals at high risk, contributed to a significant decrease in mortality in almost all developed countries.
Acknowledgements
We thank Professors Izabella Barisson Matos, coordinator of the Post-Graduation Program in Collective Health of the Universidade do Planalto Catarinense (UNIPLAC) and Karen Glazer Peres, research coordinator.
Potential Conflict of Interest
No potential conflict of interest relevant to this article was reported.
Sources of Funding
This study was funded by Universidade do Planalto Catarinense.
Study Association
This article is part of the thesis of master submitted by Valmir Martins Luciano, from Universidade do Planalto Catarinense - Uniplac e Universidade Federal de Santa Catarina - UFSC.
Table 3 - Multivariate analysis for the prevalence of blood pressure levels in adults according to the variables included in the model. Lages-SC, Brazil, 2007.
Variables Prevalence Ratios (95%CI) p value*
Sex 1 <0.001
Female 1.0
Male 1.4 (1.2-1.7)
Age (yrs) 1 <0.001
20 – 29 1.0
30 – 39 1.6 (1.3-2.1)
40 – 49 2.1 (1.7-2.5)
50 – 59 2.7 (2.2- 3.4)
Schooling (yrs)
12 or more 1.0 0.880
9 – 11 1.3 (1.0 – 1.5)
5 – 8 1.1 (0.8 – 1.3)
0 – 4 1.1 (0.9 – 1.3)
Ethnicity 1 0.181
Caucasian 1.0
Brazilian Mulatto 0.9 (0.8-1.1)
Black 1.2 (0.9-1.7)
Asian 1.8 (1.3-2.5)
Native Brazilian 0.8 (0.4-1.9)
Nutritional status 3 <0.001
Eutrophic 1.0
Overweight 1.4 (1.1-1.6)
Obese 1.9 (1.6-2.3)
Waist circumference 0.028
Ideal 1.0
Non-ideal 1.1 (0.9-1.4)
Diabetes3 0.002
No 1.0
yes 1.3 (1.1-1.5)
* p value for Wald’s test.
1 – All socioeconomic and demographic variables were adjusted for the variables
of the irst level of the conceptual model.
1. Sociedade Brasileira de Cardiologia. V Diretrizes brasileiras de hipertensão. Arq Bras Cardiol. 2007; 89 (3): e24-e79.
2. Brasil. Ministério da Saúde. Secretaria de Atenção à Saúde. Departamento de Atenção Básica. Hipertensão arterial sistêmica para o Sistema Único de Saúde. Brasília ; 2006. (Cadernos de Atenção Básica; 16/ Série A. Normas e Manuais Técnicos).
3. Sociedade Brasileira de Cardiologia. IV Diretrizes brasileiras de hipertensão arterial. Arq Bras Cardiol. 2004; 82 (supl. 4) :1-14.
4. National Institutes of Health. The Sixth Report of the Joint National Committee on Prevention, Detection, Evaluation, and Treatment of High Blood Pressure. Washington DC; 1997. (NIH, Publication Nº 98-4080).
5. Passos VMA, Assis TD, Barreto SM. Hipertensão arterial no Brasil: estimativa de prevalência a partir de estudos de base populacional. Epidemiologia e Serviços de Saúde. 2006; 15 (1): 35-45.
6. IBGE. Instituto Brasileiro de Geografia e Estatística. Censo demográfico/2006. [Acesso em 2007, mar. 18]. Disponível em: http://www.ibge.gov.br.
7. Fuchs FD, Moreira LB, Moraes RS, Bredemeier M, Cardozo SC. Prevalência de hipertensão arterial sistêmica e fatores associados na região urbana de Porto Alegre: estudo de base populacional. Arq Bras Cardiol. 1995; 63 (6): 473-9.
8. Dean AG, Dean JA, Colombier D, Brendel KA, Smith DC, Burton AH, et al. Epi Info, version 6: a word processing, database, and statistics program for epidemiology on microcomputers. Atlanta, Georgia, USA: Centers for Disease Control and Prevention; 1994.
9. Silva NN. Amostragem probabilística: um curso introdutório. São Paulo: EDUSP; 1998.
10. Chobanian AV, Bakris GJ, Black HR, Cushman WC, Lee A, Green LA, et al. The Seventh Report of the Joint National Committee on Prevention, Detection, Evaluation, and Treatment of High Blood Pressure: the JNC 7 report. JAMA. 2003; 289 (19): 2560-72.
11. Klein CH, Silva NAS, Nogueira AR, Block KV, Campos LHS. Hipertensão arterial na Ilha do Governador, Rio de Janeiro, Brasil. I. Metodologia. Cad Saúde Pública. 1995; 11 (2): 187-201.
12. Jardim PCBV, Gondim MRP, Monego ET, Moreira HG, Vitorino PVO, Souza WK, et al. Hipertensão arterial e alguns fatores de risco em uma capital brasileira. Arq Bras Cardiol. 2007; 88 (4): 452-7.
13. World Health Organization. Obesity: preventing and managing the global epidemic. Report of a WHO consultation on obesity. Geneva; 1998.
14. National Institutes of Health, National Heart, Lung, and Blood Institute. Clinical guidelines on the identification, evaluation, and treatment of overweight and obesity in adults: the evidence report. Obes Res. 1998; 6: S51–S210.
15. Menezes AMB, Victora CG, Perez-Padilla R. The Platino project: methodology of a multicenter prevalence survey of chronic obstructive pulmonary disease in major latin american cities. BMC Med Res Methodol. 2004; 17 (4): 15.
16. Masur J, Monteiro M. Validation of the CAGE alcoholism screening test in Brazilian psychiatry inpatient hospital setting. Braz J Med Biol Res. 1983; 16 (3): 215-8.
17. Matsudo S, Araújo T, Matsudo V, Andrade D, Andrade E, Oliveira C, et al. Questionário internacional de atividade física (IPAQ): estudo de validade e
References
reprodutibilidade no Brasil. Rev Bras Ativ Fís Saúde. 2001; 6 (2): 5-12.
18. STATA Corp. Stata Statistical Software Release 9.0. College Station, Px: STATA Corporation, 2001.
19. Henry GT. Practical sampling. Newbury Park: Jage Publication LTD; 1990.
20. Victora CG, Huttly SR, Fuchs SC, Olinto MTA. The role of conceptual frameworks in epidemiological analysis: a hierarchical approach. Int J Epidemiol. 1997; 26: 224-47.
21. Instituto Nacional do Câncer. Inquérito domiciliar sobre comportamento de risco e morbidade referida de doenças e agravos não transmissíveis [dados na Internet]. Rio de Janeiro: Inca; 2005. [acesso 2008 fev. 25]. Disponível em: htpp://www.inca.gov.br/inquerito/hipertensaoarterial.pdf.
22. Castro RAA, Moncau JEC, Marcopito LF. Prevalência de hipertensão arterial sistêmica na cidade de Formiga, MG. Arq Bras Cardiol. 2007; 88 (3): 334-9.
23. Barreto SM, Passos VMA, Firmo JOA, Guerra HL, Vidigal PG, Lima-Costa MFF. Hypertension and clustering of cardiovascular risk factors in a community in Southest Brazil – The Bambuí Health and Ageing Study. Arq Bras Cardiol. 2001; 77 (6): 576-81.
24. Lessa I, Araujo MJ, Magalhães L, Almeida Filho N, Aquino E, Costa MC. Clustering of modifiable cardiovascular risk factors in adults living in Salvador (BA), Brazil. Rev Panam Salud Publica. 2004; 16 (2): 131-7.
25. Costa JSD, Barcellos FC, Sclowitz ML, Sclowitz IKT, Castanheira M, Olinto MTA, et al . Prevalência de hipertensão arterial em adultos e fatores associados: um estudo de base populacional urbana em Pelotas, Rio Grande do Sul, Brasil. Arq Bras Cardiol. 2007; 88 (1): 59-65.
26. Ferreira SRG, Franco LJ, Gimeno SGA, Iochida LC, Iunes M. Is insulin or its precursor independently associated with hypertension? An epidemiology study in Japanese-Brazilians. Hypertension. 1997; 30: 641-5.
27. Freitas OC, Carvalho FR, Neves JM, Veludo PK, Parreira RS, Gonçalves RM, et al. Prevalence of hypertension in the urban population of Catanduva, in the State of São Paulo, Brazil. Arq Bras Cardiol. 2001; 77 (1): 16-21.
28. Jardim PCBV, Gondim MRP, Monego ET, Moreira HG, Vitorino PVO, Souza WKSB, et al. Hipertensão arterial e alguns fatores de risco em uma capital brasileira. Arq Bras Cardiol. 2007; 88 (4): 452-7.
29. Lerario DDG, Gimeno SG, Franco LJ, Iunes M, Ferreira SRG. Excesso de peso e gordura abdominal para a síndrome metabólica em nipo-brasileiros. Rev Saúde Pública. 2002; 36 (1): 4-11.
30. Costa MB, Ferreira SRG, Franco LJ, Gimeno SGA, Iunes M. Japanese-Brazilian Diabetes Study Group: dietary patterns in a high-risk population for glucose intolerance. J Epidemiol. 2000; 10: 111-7.
31. Monteiro CA, (org). Velhos e novos males da saúde pública no Brasil: a evolução do país e de suas doenças. São Paulo: Hucitec; 2001.
32. Brasil. Ministério da Saúde. Secretaria de Atenção à Saúde. Coordenadoria Geral da Política de Alimentação e Nutrição. Guia alimentar para a população brasileira: promovendo a alimentação saudável. Brasília; 2006.