Hypertension Prevalence and its Associated Risk Factors in Adults:
a Population-Based Study in Pelotas
Juvenal Soares Dias da Costa
1,2, Franklin Correa Barcellos
2, Marcelo Leal Sclowitz
2, Iândora Krolow Timm Sclowitz
2,
Marcelo Castanheira
2, Maria Teresa Anselmo Olinto
1, Ana Maria Baptista Menezes
2, Denise Petrucci Gigante
2, Silvia
Macedo
2, Sandra Costa Fuchs
3Universidade do Vale do Rio dos Sinos1, Universidade Federal de Pelotas2 e Universidade Federal do Rio Grande do Sul3 - São Leopoldo,
Objective: To determine hypertension prevalence and its associated risk factors.
Methods: A cross-sectional, population-based study of people ages 20 to 69 living in the urban area of Pelotas, Rio Grande GR6XO%UD]LOZDVFRQGXFWHG7KHGHSHQGHQWYDULDEOHV\VWHPLFK\SHUWHQVLRQZDVGHILQHGDVEORRGSUHVVXUH[PP Hg (average of two readings) or current use of antihypertensive drugs.
Results: Among the 1,968 subjects enrolled in the study, hypertension prevalence was 23.6% (95% CI 21.6 to 25.3). A Poisson regression model was used to control confounding factors effects. The following variables remained statistically significant in the final model: family income, age, skin color, gender, family history of hypertension, extra salt intake, and body mass index.
Conclusion: Compared with a similar study undertaken in 1992, hypertension prevalence increased, particularly in the younger groups.
Key words: Hypertension, prevalence, risk factors.
Mailing Address: Juvenal Soares Dias da Costa •
Av. Duque de Caxias, 250 – 96030-002 – Pelotas, RS, Brazil
Systemic hypertension is a major cause of cardiovascular diseases (such as ischemic heart disease, stroke, and heart failure) and chronic renal diseases1.
Population-based studies carried out in Brazil have shown that hypertension is a common disease, the prevalence of which is about 20%2-5.
Today, cardiovascular diseases constitute the primary cause of death, representing roughly one-third of overall adult mortality in Brazil. In Rio Grande do Sul, in 2002, 21,802 subjects died from circulatory system diseases, also accounting for one-third of the overall mortality6.
Hypertensive complications often lead to costly medical care, as they require regular use of drugs, periodic complementary examinations, and procedures such as dialysis and transplantation7. In Brazil, cardiocirculatory diseases rank among the leading causes of hospital admissions and are known to incur high costs8,9.
In Pelotas, Rio Grande do Sul (RS), a population-based study of the adult population carried out in 1992 estimated hypertension prevalence to be around 20%. This study showed that people older than 40, black, and with family history of hypertension were the most affected; there was no difference between genders.
The identification of groups at higher risk for developing hypertension is an important contribution to both the prevention of morbidities and treatment effectiveness10.
This study sought to determine hypertension prevalence and its associated risk factors in the adult population of Pelotas.
Methods
A cross-sectional, population-based study was conducted to estimate hypertension prevalence and its associated risk factors in the adult population (ages 20 to 69) living in the urban area of Pelotas. The original project evaluated several endpoints related to this adult population’s health and was approved by the Research Ethics Committee of the Medical School of Pelotas Federal University. Among the 301,081 inhabitants of Pelotas, in 2000, 93.2% lived in the urban area; therefore the rural population was not included in the study.
Stata software 7.0 was used for statistical analysis. Unadjusted analysis was done by observing the prevalence ratios and their respective 95% confidence intervals, using the chi-square test for linear trend for ordinal categorical variables16.
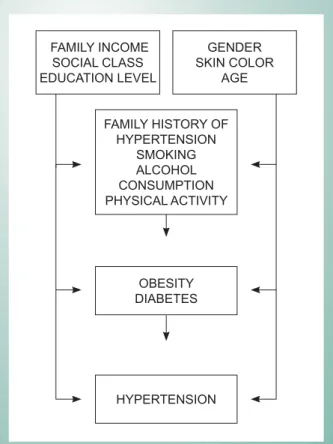
Multivariate analysis was performed by Poisson regression, which uses the prevalence ratio as the effect measure, enabling more accurate interpretations, since the odds ratio overestimates magnitude in highly prevalent diseases, such as hypertension16. Regression analysis followed a conceptual hierarchical framework (Fig. 1) for controlling confounding variables17.
in 608 subjects. Considering the sample size required for other endpoints included in the study, and taking into account possible losses or refusals to participate, a total of 1,800 subjects would be required.
In the cluster sampling, 40 census tracts and, within each tract, 30 households were selected for interview. Therefore, 1,200 families and, in every household, 1.5 people within the study age range were expected to be identified. In every census tract, one block and a starting point were randomly selected. After one house was visited, the next two were consistently skipped, and the fourth house was visited.
Field work took place between December 1999 and April 2000. All participants completed a standard precoded questionnaire. The interviews were held by college students (Pelotas Federal University), who were blinded to the study objectives. All interviewers attended a training program to ensure standardization of procedures. They were trained for measuring blood pressure according to guidelines set forth by the Brazilian Consensus11. Blood pressure was measured using aneroid sphygmomanometers calibrated against a mercury manometer. Study logistics were tested in the pilot study.
The dependent variable hypertension was defined as EORRGSUHVVXUH [ PP +J DYHUDJH RI WZR UHDGLQJV [ PP +J DYHUDJH RI WZR UHDGLQJV160 x 95 mm Hg (average of two readings) or current use of antihypertensive drugs.
Variables related to accumulation of material goods and years of schooling were investigated to determine social class (A, B, C, D or E), according to the Brazilian Association of Marketing Research (ABIPEME - Associação Brasileira de Institutos de Pesquisa de Mercados) classification12. Other variables studied were as follows: family income per capita in number of minimum wages, age, gender, skin color, cigarette smoking, alcohol consumption, use of extra salt at meals, physical activity, body mass index, and self-reported diabetes mellitus.
Smoking was divided into four categories: non-smokers, ex-smokers, smokers of up to 19 cigarettes per day, and smokers of 20 cigarettes or more per day. The habit of adding extra salt at the table was investigated.
Alcohol intake was measured in grams of ethanol per day, using 30g/day as a cut-off point to define abuse. This cut-off point is used in studies of risk factors for hypertension13 and stroke1.
Physical activity was defined as adequate or inadequate to confer beneficial health effects. Leisure-time physical activities that result in energy expenditure of at least 1,000 Kcal/week were considered adequate14.
Body weight (kg) and height (m) were measured for body mass index (BMI, calculated as kg/m2). Subjects with BMI between 25.0 and 29.9 kg/m2 were considered overweight,
DQGWKRVHZLWK%0, NJP NJP30 kg/m2 were classified as obese15. The presence of diabetes mellitus was also investigated, based on history of medical diagnosis previously reported by the participants.
Quality control was achieved by applying simplified questionnaires to 10% of the sample. Data entry and codification, using the Epi-Info software, were done twice in order to reduce potential errors.
Results
Of the 1,200 eligible families, 1,145 (95.4%) were contacted and 55 (4.5%) were classified as losses or refusals. Among those contacted, 2,177 subjects were eligible and 1,968 subjects from 20 to 69 years of age were interviewed (9.6 were losses or refusals).
Hypertension prevalence in the studied sample was
&,WR,IGLDVWROLFEORRGSUHVVXUH
PP+JV\VWROLFEORRGSUHVVXUH RU FXUUHQW XVH RI RU FXUUHQW XVH RI 140 or current use of antihypertensive drugs were considered an endpoint, this prevalence would be 37.2% (95% CI 35.1 to 39.4).
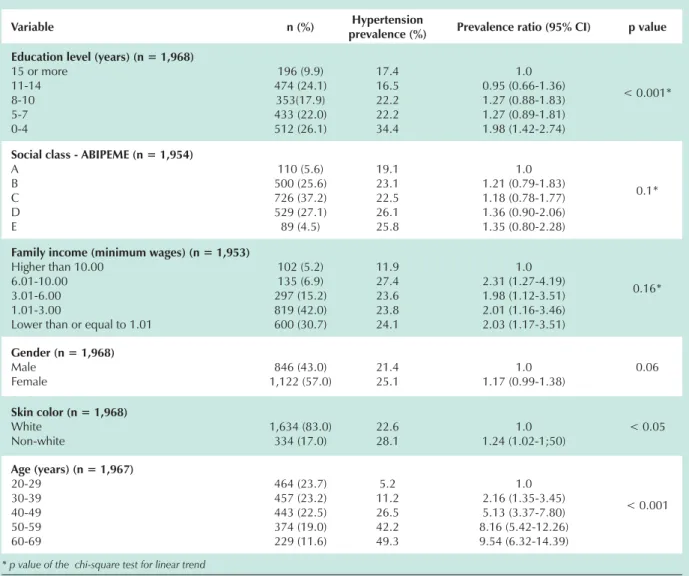
With respect to socioeconomic variables, sample distribution showed that mean education level was 7.8 years (SD ± 4.4), around 30% of the subjects belonged to social classes D and E (ABIPEME), and more than 70% of the families lived on up to three minimum wages (Tab.1). Female gender
Fig. 1 -Conceptual model.
FAMILY INCOME SOCIAL CLASS EDUCATION LEVEL
GENDER SKIN COLOR
AGE
OBESITY DIABETES
HYPERTENSION FAMILY HISTORY OF
predominated (57%), and 83% of the subjects were white, mean age 41.6 (SD ± 13.7).
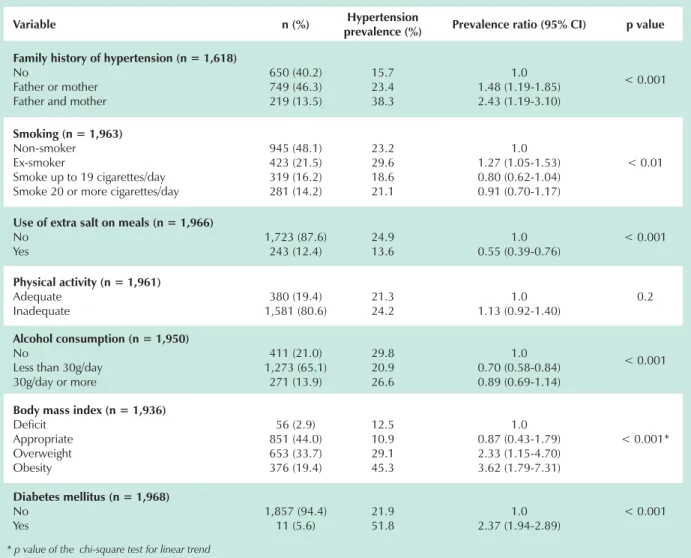
Concerning the distribution of risk factors associated with hypertension, 60% of the subjects had family history of hypertensive disease, 30% were smokers, and approximately 12% added extra salt to their meal. Only 20% of the subjects were involved in physical activity considered adequate to derive health benefits. About 65% drank less than 30g/day of alcohol. Approximately 6% reported having diabetes mellitus, and 53% were overweight or obese (Tab. 2).
In the unadjusted analysis, hypertension was more prevalent in subjects belonging to all income categories than in those who earned ten minimum wages or more; yet, the chi-square test for linear trend showed no statistical significance. In reference to education, our data showed that subjects with less than four years of schooling were twice as likely to have hypertension. No statistically significant differences were found in the ABIPEME classification (Tab. 1).
Women were 17% more likely to have hypertension than
men, although the lower confidence interval limit was below the unit value. As for hypertension and age distribution, a significant and positive trend was found. Regarding skin color, non-white people were 25% more likely to have hypertension than white people (Tab. 1).
Our data showed that a positive family history for at least one parent was associated with higher prevalence of hypertension. It was found that the prevalent ratio was higher in ex-smokers than in non-smokers, but this effect was not maintained in the multivariate analysis. Hypertension rate was lower among subjects who drank less than 30g of alcohol per day than among those who did not drink alcohol, but this effect disappeared in the multivariate analysis. Participants who added extra salt to their meal also had less hypertension. No statistically significant differences were found regarding leisure-time physical activity (Tab. 2).
Subjects who reported having diabetes mellitus showed higher prevalence of hypertension. When compared with people of appropriate weight, overweight subjects were twice
Variable n (%) Hypertension
prevalence (%) Prevalence ratio (95% CI) p value
Education level (years) (n = 1,968)
15 or more 11-14 8-10 5-7 0-4
196 (9.9) 474 (24.1) 353(17.9) 433 (22.0) 512 (26.1)
17.4 16.5 22.2 22.2 34.4
1.0 0.95 (0.66-1.36) 1.27 (0.88-1.83) 1.27 (0.89-1.81) 1.98 (1.42-2.74)
< 0.001*
Social class - ABIPEME (n = 1,954)
A B C D E
110 (5.6) 500 (25.6) 726 (37.2) 529 (27.1) 89 (4.5)
19.1 23.1 22.5 26.1 25.8
1.0 1.21 (0.79-1.83) 1.18 (0.78-1.77) 1.36 (0.90-2.06) 1.35 (0.80-2.28)
0.1*
Family income (minimum wages) (n = 1,953)
Higher than 10.00 6.01-10.00 3.01-6.00 1.01-3.00
Lower than or equal to 1.01
102 (5.2) 135 (6.9) 297 (15.2) 819 (42.0) 600 (30.7)
11.9 27.4 23.6 23.8 24.1
1.0 2.31 (1.27-4.19) 1.98 (1.12-3.51) 2.01 (1.16-3.46) 2.03 (1.17-3.51)
0.16*
Gender (n = 1,968)
Male Female
846 (43.0) 1,122 (57.0)
21.4 25.1
1.0 1.17 (0.99-1.38)
0.06
Skin color (n = 1,968)
White Non-white
1,634 (83.0) 334 (17.0)
22.6 28.1
1.0 1.24 (1.02-1;50)
< 0.05
Age (years) (n = 1,967)
20-29 30-39 40-49 50-59 60-69
464 (23.7) 457 (23.2) 443 (22.5) 374 (19.0) 229 (11.6)
5.2 11.2 26.5 42.2 49.3
1.0 2.16 (1.35-3.45) 5.13 (3.37-7.80) 8.16 (5.42-12.26) 9.54 (6.32-14.39)
< 0.001
* p value of the chi-square test for linear trend
as likely to have hypertension, while in obese subjects this increase was 3.5-fold (Tab. 2).
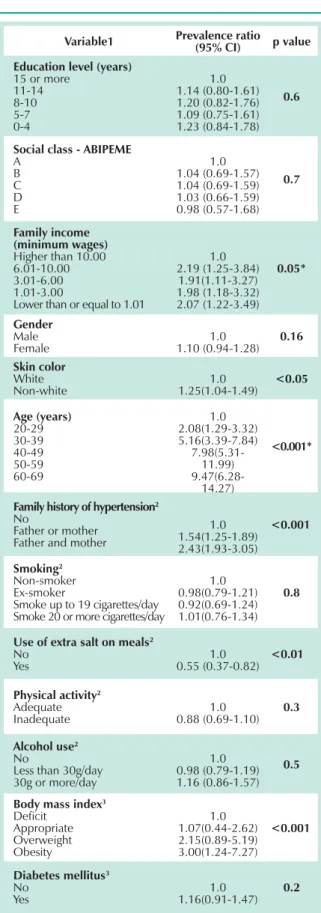
The following variables were maintained in the Poisson regression because they were statistically significant: family income, age, skin color, gender, family history of hypertension, extra salt intake, and body mass index (Tab. 3). The other variables: schooling, social class, smoking, alcohol intake, and presence of diabetes mellitus lost effect after being adjusted to the hierarchal model (Tab. 3).
Discussion
The main limitations of observational studies are the potential for selection bias, involvement of confounding variables, and occasional findings in the analysis18. In this study, sample distribution by gender and age was similar to that of the Pelotas population, thus eliminating any possible selection bias.
Another limitation to be highlighted was the fact that the two blood pressure readings were taken virtually at the same time. It should be remembered that the criteria for clinical
diagnosis recommend that at least two measurements be taken at different moments1. However, the cross-sectional design was used due to logistic and budgetary criteria. A second visit for another blood pressure measurement would have made this study impossible. Thus, as with other cross-sectional studies using the same definition of endpoint2,3,19, the cut-off point was more specific, that is to say, probably the sensitivity and number of false-positive subjects were reduced. Accordingly, prevalence measures may have been underestimated.
In the present study, both blood pressure measurement and classification were similar to that of another population-based study carried out in the same city3, but using a larger sample. Hypertension prevalence in the present investigation was higher than that detected previously. In the earlier study, it was less than 19.8% (95% CI 17.9 to 21.7); whereas in this study it was 23.6% (95% CI 21.6 to 25.3). Despite overlapping confidence intervals, it is believed that hypertension prevalence increased. This might be explained by age differences between the two populations. In the study by Piccini and Victora, around 52% of the population was younger than 19, while in the present study 47% of the population fell into this age group. Prevalences of the Piccini and Victora’
Variable n (%) Hypertension
prevalence (%) Prevalence ratio (95% CI) p value
Family history of hypertension (n = 1,618)
No
Father or mother Father and mother
650 (40.2) 749 (46.3) 219 (13.5)
15.7 23.4 38.3
1.0 1.48 (1.19-1.85) 2.43 (1.19-3.10)
< 0.001
Smoking (n = 1,963)
Non-smoker Ex-smoker
Smoke up to 19 cigarettes/day Smoke 20 or more cigarettes/day
945 (48.1) 423 (21.5) 319 (16.2) 281 (14.2)
23.2 29.6 18.6 21.1
1.0 1.27 (1.05-1.53) 0.80 (0.62-1.04) 0.91 (0.70-1.17)
< 0.01
Use of extra salt on meals (n = 1,966)
No Yes
1,723 (87.6) 243 (12.4)
24.9 13.6
1.0 0.55 (0.39-0.76)
< 0.001
Physical activity (n = 1,961)
Adequate Inadequate
380 (19.4) 1,581 (80.6)
21.3 24.2
1.0 1.13 (0.92-1.40)
0.2
Alcohol consumption (n = 1,950)
No
Less than 30g/day 30g/day or more
411 (21.0) 1,273 (65.1)
271 (13.9)
29.8 20.9 26.6
1.0 0.70 (0.58-0.84) 0.89 (0.69-1.14)
< 0.001
Body mass index (n = 1,936)
Deficit Appropriate Overweight Obesity
56 (2.9) 851 (44.0) 653 (33.7) 376 (19.4)
12.5 10.9 29.1 45.3
1.0 0.87 (0.43-1.79) 2.33 (1.15-4.70) 3.62 (1.79-7.31)
< 0.001*
Diabetes mellitus (n = 1,968)
No Yes
1,857 (94.4) 11 (5.6)
21.9 51.8
1.0 2.37 (1.94-2.89)
< 0.001
* p value of the chi-square test for linear trend
study in the different age groups were standardized in accordance to this population. After standardization, hypertension prevalence was 21.4%, suggesting a higher incidence of this disease. In spite of this, hypertension prevalences rose in virtually all the age groups, but the largest proportional increases were found in the younger groups. These increases went as follows: 126.1% in the 20-29 age group, 24.4% in the 30-39 age group, -4.7% in the 40-49 age group, 13.7% in the 50-59 age group, and 5.1% in the 60-69 age group. However, confidence intervals for the 20-29 age group in both studies overlapped (95% CI in 1992 – 0.8 to 3.8; 95% CI in 2000 – 3.2 to 7.2).
Additionally, regarding hypertension distribution by age, it is worth noting that in the oldest age group, half of the sample had the disease, denoting the disease burden in older people.
Comparison of risk factor distribution in both studies was impaired, because variables were collected in different ways. Piccini and Victora’s report was analyzed, and the nutritional status of young people in both samples could be evaluated; however, no differences were found in overweight and obesity prevalence.
There was an association with family income, showing once again that hypertension is linked to poor living conditions. This finding had already been demonstrated in several studies2,3,20. Skin color is known to be associated with hypertension1, and the present study confirmed this association, showing greater prevalence in non-white subjects.
In this study, hypertension was associated with family history, overweight, and obesity. Other studies also detected an association between hypertension and family history 3,5,20,21. The positive association between hypertension and obesity was also observed in other studies3,19,20,22.
Other known risk factors for hypertension, such as physical activity, smoking, and alcohol consumption1 were not associated in the present study. Although a separate analysis was performed for subjects decompensated who reported hypertension, this association was not established. It was hypothesized that the association might have not been detected due to reverse causality.
On the other hand, the use of extra salt showed to be a protective factor for hypertension, possibly because the question failed to measure the real amount of daily salt intake.
By controlling hypertension, developed countries have decreased mortality rates and improved health levels23,24. Therefore, the implementation of measures aimed at promoting changes in lifestyle and therapeutic control is needed to reduce the disease burden. The fact that two population-based studies have been carried out in Pelotas allowed verification of the trend towards the disease. Therefore, it is suggested that hypertension in the youngest age groups be specifically studied.
Supported by: Fundação de Amparo à Pesquisa do Estado do Rio Grande do Sul (FAPERGS) e CNPq.
Potential Conflict of Interest
No potential conflict of interest relevant to this article was reported.
Variable1 Prevalence ratio (95% CI) p value
Education level (years)
15 or more 11-14 8-10 5-7 0-4
1.0 1.14 (0.80-1.61) 1.20 (0.82-1.76) 1.09 (0.75-1.61) 1.23 (0.84-1.78)
0.6
Social class - ABIPEME
A B C D E
1.0 1.04 (0.69-1.57) 1.04 (0.69-1.59) 1.03 (0.66-1.59) 0.98 (0.57-1.68)
0.7
Family income (minimum wages)
Higher than 10.00 6.01-10.00 3.01-6.00 1.01-3.00
Lower than or equal to 1.01
1.0 2.19 (1.25-3.84)
1.91(1.11-3.27) 1.98 (1.18-3.32) 2.07 (1.22-3.49)
0.05*
Gender
Male
Female 1.10 (0.94-1.28)1.0 0.16
Skin color
White
Non-white 1.25(1.04-1.49)1.0 <0.05
Age (years)
20-29 30-39 40-49 50-59 60-69
1.0 2.08(1.29-3.32) 5.16(3.39-7.84)
7.98(5.31-11.99)
9.47(6.28-14.27)
<0.001*
Family history of hypertension2 No
Father or mother Father and mother
1.0 1.54(1.25-1.89) 2.43(1.93-3.05)
<0.001
Smoking2 Non-smoker Ex-smoker
Smoke up to 19 cigarettes/day Smoke 20 or more cigarettes/day
1.0 0.98(0.79-1.21) 0.92(0.69-1.24) 1.01(0.76-1.34)
0.8
Use of extra salt on meals2 No
Yes 0.55 (0.37-0.82)1.0 <0.01
Physical activity2 Adequate
Inadequate 0.88 (0.69-1.10)1.0 0.3
Alcohol use2 No
Less than 30g/day 30g or more/day
1.0 0.98 (0.79-1.19) 1.16 (0.86-1.57)
0.5
Body mass index3 Deficit
Appropriate Overweight Obesity
1.0 1.07(0.44-2.62) 2.15(0.89-5.19) 3.00(1.24-7.27)
<0.001
Diabetes mellitus3 No
Yes 1.16(0.91-1.47)1.0 0.2
** p value of the chi-square test for linear trend (continued). 1 – All socioeconomic and demographic variables were adjusted to those of the first level of the conceptual model (Figure 1) 2 – Adjusted to variables of the first and second levels of the model. 3 – Adjusted to variables of the first, second, and third levels of the model.
References
1. National Institutes of Health. The Sixth Report of the Joint National Committee on Prevention, Detection, Evaluation, and Treatment of High Blood Pressure. Washington DC; 1997. (NIH, Publication Nº 98-4080).
2. Fuchs FD, Moreira LB, Moraes RS, Bredemeier M, Cardozo SC. Prevalência de hipertensão arterial sistêmica e fatores associados na região urbana de Porto Alegre: estudo de base populacional. Arq Bras Cardiol. 1995;63: 473-9.
3. Piccini RX, Victora CG. Hipertensão arterial sistêmica em área urbana no sul do Brasil: prevalência e fatores de risco. Rev Saúde Pública. 1994; 28: 261-7.
4. Bloch VB, Klein CH, Silva NAS, Nogueira AR, Campos LHS. Hipertensão arterial e obesidade na Ilha do Governador - Rio de Janeiro. Arq Bras Cardiol. 1994; 62: 17-22.
5. Fuchs SC, Petter JG, Accordi MC, Zen VL, Pizzol AD, Moreira LB, et al. Establishing the prevalence of hypertension. Influence of sampling criteria. Arq Bras Cardiol. 2001; 76: 445-52.
6. Rio Grande do Sul. Secretaria da Saúde, Núcleo de Informações em Saúde. Estatísticas de Saúde: mortalidade 2002. Porto Alegre (RS): Secretaria da Saúde; 2003.
7. Johannesson M, Le Lorier J. How to assess the economics of hypertension control programmes. J Hum Hypertens. 1996; 10 (Suppl I): S93-S94.
8. Lessa I, Evangelista Filho D, Santo MEGE. Adesão, eficácia e custo do tratamento da hipertensão arterial. Arq Bras Cardiol. 1983; 41: 119-23.
9. Akashi D, Issa FK, Pereira AC, Tannuri AC, Fucciolo DQ, Lobato ML, et al. Tratamento anti-hipertensivo, prescrição e custo de medicamentos: pesquisa em hospital terciário. Arq Bras Cardiol. 1998; 71: 55-7.
10. Gyarfas I. Lessons from worldwide experience with hypertension control. J Hum Hypertens. 1996; 10 (Suppl I): S21-S25.
11. Sociedade Brasileira de Hipertensão. 3º Consenso Brasileiro de Hipertensão. Campos do Jordão; 1998.
12. Rutter M. Pesquisa de mercado. São Paulo: Ática, 1988.
13. Moreira LB, Fuchs FD, Moraes RS, Bredemeier M, Cardozo S, Fuchs SC, et al. Alcoholic beverage consumption and associated factors in Porto Alegre,
a southern Brazilian city: a population-based survey. J Stud Alcohol. 1996; 57: 253-9.
14. Paffenbarger RS Jr, Hyde RT, Wing AL, Hsieh CC. Physical activity, all-cause mortality and longevity of college alumni. N Engl J Med. 1986; 314: 605-14.
15. World Health Organization. Report of a WHO Concultation on obesity: obesity-preventing and managing the global epidemic. Geneva; 1997.
16. Altman DG. Practical statistics for medical research. London: Chapman & Hall, 1997.
17. Victora CG, Huttly SR, Fuchs SC, Olinto MTA. The role of conceptual frameworks in epidemiological analysis: a hierarchical approach. Int J Epidemiol. 1997; 26: 224-47.
18. Albhom A, Norell S. Introduction to modern epidemiology. Chestnut Hill: Epidemiology Resources Inc.; 1990.
19. Trindade IS, Heineck G, Machado JR, Ayzemberg H, Formighieri M, Crestani M, et al. Prevalência de hipertensão arterial sistêmica na população urbana de Passo Fundo (RS). Arq Bras Cardiol. 1998; 71: 127-30.
20. Freitas OC, Resende de Carvalho F, Marques Neves J, Veludo PK, Silva Parreira R, Marafiotti Gonçalves R, et al. Prevalence of hypertension in the urban population of Catanduva, in the State of São Paulo, Brazil. Arq Bras Cardiol. 2001; 77: 9-21.
21. Costa EA, Klein CH. Meio urbano e doenças cardiovasculares. Cad Saúde Pública. 1985; 1: 305-12.
22. Barreto SM, Passos VM, Firmo JO, Guerra HL, Vidigal PG, Lima-Costa MF. Hypertension and clustering of cardiovascular risk factors in a community in Southeast Brazil, The Bambui Health and Ageing Study. Arq Bras Cardiol. 2001; 77: 576-81.
23. Collins R, Peto R, MacMahon S, Hebert P, Fiebach N, Eberlein KA, et al. Blood pressure, stroke, and coronary heart disease. Part 2, short-term reductions in blood pressure: overwiew of randomised drug trials in their epidemiological context. Lancet. 1990; 335: 827-38.