BAR, Curitiba, v. 8, n. 4, art. 1, pp. 351-375, Oct./Dec. 2011
Stock Market Development: an Analysis from a Multilevel and
Multi-country Perspective
Cristiano Augusto Borges Forti * E-mail address: [email protected] Universidade Federal de Uberlândia – FAGEN/UFU and Fundação Getúlio Vargas – EAESP/FGV Uberlândia, MG, Brazil.
Chen Yen-Tsang E-mail address Fundação Getúlio Vargas – EAESP/FGV São Paulo, SP, Brazil.
Fernanda Maciel Peixoto E-mail address: [email protected] Universidade Federal de Uberlândia – UFU and Universidade Federal de Minas Gerais – UFMG Belo Horizonte, MG, Brazil.
* Endereço: Cristiano Augusto Borges Forti
Rua Francisco Vicente Ferreira, 136, Uberlândia, MG, 38408-102, Brazil.
Abstract
Stock markets have been rapidly developed around the world during the last 20 years. Accordingly, there is sincere academic interest in understanding the determinants of this phenomenon. Most studies advocate that the development of a stock market is influenced by a few individual country variables such as the origin of its legal system, enforcement of law, accounting patterns, transparency, corporate ownership structure, and the level of creditor and minority investor protection. This paper extends previous empirical literature concerning the determinants of stock market development. We built a unique sample of 50 countries, ranging from those with emerging to developed economies. From a set of 60 potential variables, 12 factors were employed using multiple regression. The research breaks new ground by using different constructs taken from financial literature, such as the Human Development Index (HDI, 2010), Managerial Skills of Entrepreneurs and Democracy of the Country. Results showed that more factors may influence the development of stock markets, such as the adaptability of firms and the openness of a country, helping avoid the multicollinearity effects that may have affected earlier studies.
Introduction
Stock markets around the world have been developed vigorously during the past 20 years. Several benefits can be attributed to the development of the stock markets, such as economic development and allocation of resources for productive opportunities (Camargos & Barbosa, 2006). In general, there is a strong correlation between economic development and stock market activity, because stock markets allow people, firms and institutions to invest their savings in productive activities. According to the World Bank (2010), several contributions can be associated with developed stock markets:
⋅ Investment in stocks is a form of long-term saving that is invested directly in production activity.
⋅ Developed markets reward investors by returns maximization and the efficient use of resources, which are the seeds to begin a cycle of development and competitiveness.
⋅ Developed markets with liquidity, volume and regulation stimulate businesses at a firm-level.
⋅ Shareholder activity reflects the expectations of the main market players, as well as their opinions about both domestic and international states of economic affairs.
⋅ Finally, an efficient stock market has a fundamental role in attracting, maximizing, consolidating and retaining external capital.
According to the World Bank (2010) and International Monetary Fund (2010), the Brazilian stock market had an increase in its capitalization from 28% of the GDP in 1996 to 67% in 2006. Despite this growth, the Brazilian market is still proportionately small when compared to other countries such as Chile (120%), Australia (140%), U.S.A. (148%) or Hong Kong (904%).
Another interesting aspect of the Brazilian stock market is the significant increase in the number of investors willing to transfer part of their savings from fixed income to stocks and mutual funds. According to Info Money (2010), the number of individual investors in the Brazilian stock market increased from 85,249 in 2002 to 558,853 in February 2010, representing a555% growth during that period.
Many countries have tried to stimulate the development and investment level of their stock markets as a mean to achieve economic growth and social welfare. Some authors have studied this connection through issues involving corporate governance, pointing out the advantages that firms and markets gained from the adoption of such practices. According to Rogers, Ribeiro and Souza (2005), the development of the stock market depends on the good practices of corporate governance, because the adoption of an efficient system of corporate governance increases liquidity, negotiation volume and share valuation, consequently reducing the exposure of the firms to macroeconomic factors.
Still in the lines of Corporate Governance, we can highlight some studies that tried to identify the characteristics of countries with well-developed stock markets: Shleifer and Vishny, 1997; La Porta, Lopes-de-Silanes, Shleifer and Vishiny, 2000; Dyck and Zingales, 2004. They studied a wide range of factors that could affect corporate governance, from firm and country characteristics to political and legal structure.
countries. The improvement upon existing literature is not limited to selection of the variables, but also extends to how these variables have been treated and argued. We believe that there could be factors that simultaneously influence several of the variables analyzed in the previous literature. If this assumption is true, previous analysis could have been done under a multicollinearity effect, which could invalidate previously proposed models.
In this paper, we initially employed variable reduction through factor analysis. In addition, we ran multiple regression techniques using the previously obtained factors instead of each individual original variable.
The paper is organized as follows. Firstly, we present the existing literature. Secondly, we describe the methodology and data employed in this research. Then, the empirical test results are presented. After that, we discuss the results of the tests and finally we have the conclusion of the paper.
Theory
Recent studies concerning the development of stock markets (Dyck & Zingales, 2004; La Porta et al., 2000; Shleifer & Vishny, 1997) cover a broad range of aspects, namely: (a) origin of legal system and enforcement levels; (b) level of protection for minority shareholders and creditors; (c) ownership structure and corporate control; (d) transparency and accounting standards; and (e) volume of IPOs (Initial Public Offerings) and incentives for IPOs.
At the same time, Zingales (1995), Pagano, Panetta and Zingales (1998), and Brau and Fawcett (2006) pointed out other factors that affect the level of stock market development. These include: (a) concentration of corporate ownership, private benefits of control and expropriation of minority shareholders, (b) resistance of firms to an IPO, (c) informational asymmetries and errors in share pricing, (d) conflicts and agency costs, and (e) unfavorable economic conditions. All these factors are interrelated and characterize the legal and institutional environment of each country under analysis. This paper aims to disentangle these relations by analyzing key aspects separately, while showing their interrelations.
Investor protection, legal origin and enforcement
Several elements of a country’s financial system such as breadth and depth of their stock market, the pace of new bond issues, the patterns of corporate ownership structures and efficiency of investment allocation appear to be explained, conceptually and empirically, by how well (or at what level) the rule of law protects outside investors (La Porta et al., 2000).
La Porta et al. (2000) argue that shareholder and creditors’ legal protection is central to understanding the models of corporate finance in different countries.
Thus, changes in the legal system and its enforcement are central to understand why some firms raise more funds than others across countries. La Porta et al. (2000) stated that when investor rights (i.e., voting rights) and creditor rights (i.e., reorganization and liquidation rights) are well protected and enforced by legislation and courts, they are more willing to finance firms. In such a situation, insiders are required to reduce expropriation, if any exists, and, as a consequence, the private benefits of control are diminished.
David and Brierly (1985) discussed that the legal systems of most countries derive from a few legal families, primarily common law (English) or civil law (French or German). They proposed that the legal origin determines the degree to which outsiders are protected and show that common law countries have stronger outsider investor protection than French civil law countries. In addition, they report that in countries with French civil law, such protection is weaker than in countries with German civil law or Scandinavian countries.
As shown in La Porta et al. (2000), the strong investor protection is associated with effective corporate governance, reflected in broader and more highly valued financial markets, dispersed share ownership and efficient allocation of resources among firms. They cited several attempts at governance reform in countries like Germany, the USA and Poland. Despite the hurdles involved in this process, they argued that the reform of investor protection is politically feasible and can bring significant economic benefits.
Corporate ownership structure and control
Shleifer and Vishny (1997) argued that the structure of ownership and control and the level of legal protection for investors vary greatly between countries. The United States, Germany, Britain and Japan are examples of countries where the governance systems are effective, the ownership structures are dispersed and levels of minority shareholder protection are high. On the other hand, countries that fail to develop good governance mechanisms are characterized by a low level of legal protection and high ownership concentration (Italy, Latin America, Russia and India).
As an example, in Italy, Pagano et al. (1998) claimed that the stock market is underdeveloped due to the following major problems: ownership concentration, lack of effective legal enforcement, greater potential for agency conflicts and large expropriation of minority investors. According to the authors, in Italy, tax evasion is a common practice, and firms often keep two parallel accounting controls, indicating a low level of transparency.
La Porta, Lopez-De-Silanes and Shleifer (1999) conducted a study on the ownership structure of large corporations in 27 developed countries. In contrast to the Berle and Means’ (1932) modern corporation, they find that few firms have dispersed ownership. In addition they show that the primary agency conflict observed in most countries is of the majority-minority shareholder type, unlike what happens in the United States, where the conflict of interest between management and shareholders prevails. According to La Porta et al. (1999), Claessens, Djankov, Fan and Lang (2002) and Bozec and Bozec (2007), pyramidal structures and the existence of multiple classes of shares are two ways to separate cash flow rights from control in firms, and increase the use of private benefits of control.
In the Brazilian context, for instance, Leal, Carvalhal-da-Silva and Valadares (2002), showed that there is a high amount of shareholders with voting rights and, therefore, the one share-one vote rule does not apply. In 1998, from the 225 firms analyzed in this study, 155 (69%) had a single shareholder who owned more than 50% of the voting rights.
Grossman and Hart (1988) and Harris and Raviv (1988) showed that in firms which do not operate under one share-one vote, there is a tendency to have higher private benefits of control, which occurs mainly when these firms are located in countries with weak enforcement.
In a related study, Dyck and Zingales (2004) measured private benefits of control (PBC) in 39 countries using 393 blocks of ownership stock sales during the period of 1990-2000. They realized that, on average, corporate control relates to 14% of the equity value of the firm, ranging from -4% in Japan to 65% in Brazil. This result is consistent with what was already shown by Shleifer and Vishny (1997).
To do so, Dyck and Zingales (2004) used 29 large and distinct firm and country characteristics including the premium price for a controlling block, market capitalization relative to GDP of the country, concentration of ownership, initial public offerings, number of listed firms, takeover regulation, accounting standards, anti-director rights, the quality of the rule of law, the stock market rules, newspaper circulation, the level of tax compliance, and legal origin. As main results, Dyck and Zingales (2004) found that higher PBCs are associated with less developed stock markets, more concentrated ownership, and more privatizations negotiated by the private sector. They also found that many institutional variables, taken separately, are shown to be associated with a lower level of PBCs: better accounting standards, better legal protection of minority shareholders, intense market competition, high level of press diffusion and high tax compliance.
Disclosure
According to Wong (2009), transparency (measured by the level of information disclosed) is one of the most common governance mechanisms used by firms, as well being the fundamental pillar to the development of stock markets. He notes that well-governed organizations increase transparency in order to give access to the same information to both insider and outsider shareholders, reducing the potential for insider expropriation. He also emphasizes that transparency is at the top of concerns about investment decisions for institutional investors.
In line with these findings Malacrida and Yamamoto (2006) assessed the relationship between the level of disclosure of accounting data and the volatility of stock returns for 42 firms belonging to the BOVESPA in 2002. They found that a higher disclosure level implies on lower average volatility of stock returns for the sample. In a separate stream, Fernandes and Ferreira (2007) argued that investment opportunities, external funding dependence, dispersion of ownership, cash holdings, an environment of strong legal protections for investors and greater visibility and access to global stock markets tend to increase transparency of organizations and reduce earnings management.
For the Brazilian context, Lopes and Walker (2008) found that stricter governance choices and the decision to issue ADRs (American Depositary Receipts) are negatively related to the manipulation of financial reporting in firms inserted in the same institutional environment. In a similar stream, Fernandes and Ferreira (2008) concluded that firms that issue ADRs reduce the variation in the returns of their stock and that the information about the firms is quickly incorporated into stock prices.
Dalmácio (2009) assessed the relationship between good corporate governance practices and accuracy of forecasts of analysts of the Brazilian market from the perspective of the Signaling Theory. He concluded that analysts seem to be incorporating the signal (governance) issued by firms, leading to a more accurate profit forecast.
Silveira and Dias (2007) investigated the impact of disclosure disputes between controlling and minority shareholders on the share price in the Brazilian stock market. They found a significant negative abnormal return of shares (7%) shortly after the publication of gathered news.
Volume of IPOs (Initial Public Offerings) and incentives for IPO
Evidence of large variations in the number of IPOs across countries and over time suggests that the market conditions represent the most important factor in the decision to go public. The firm’s life cycle stage is shown as the second most important factor (Ritter & Welch, 2002).
By the early ‘80s, the decision to go public was a natural step for a firm to grow. However, in the ‘80s and ‘90s, some firms that went public started to become private again (Zingales, 1995).
Pagano, Panetta and Zingales (1994) found that, three years after an IPO, there is a high increase in the turnover in firm control. According to Zingales (1995), this suggests that the decision to go public should possibly be seen as an ideal method for selling a firm. Following this argument, Zingales (1995) claim that, by doing an IPO, the owner can change the balance between cash flow rights and control rights of the firm. Thus, the owner would use the IPO to optimize ownership structure, in order to maximize their total earnings in a future transaction.
In this model, the decision to go public is entirely directed by the willingness to maximize the owner’s surplus. This can lead to a dispute between the ideal private situation and the ideal social situation.
Under a similar point of view, Pagano et al. (1998) analyzed the reasons of leading Italian private firms to go public. Using a panel of 2,181 firms from the period 1982-1992 they presented the costs and benefits of joint stock. The concerns are: costs arising from adverse selection, information asymmetry between insiders and outsiders, dubious pricing and moral hazard, fixed costs, loss of confidentiality of the firm's data. As benefits, they mentioned that an IPO helps in: overcoming the funding constraints, diversification, increased liquidity, better monitoring by the stock market, increasing the number of potential investors, increasing bargaining power with banks, transferring control, and adjusting stock pricing.
Pagano et al. (1998) also found that in Italy and Europe as a whole, firms do not go public in order to finance subsequent investments and growth. Instead, they do so in order to re-balance their accounts after a period of high investment and growth. Finally, they verify that the probability of an IPO in Italy increases with firm size and the industry’s market-to-book ratio.
According to Ritter and Welch (2002), the amount of firms going public in the U.S. from 1980 to 2001 surpassed one per business day. The number of initial public offerings (IPOs), however, has varied from year to year, with some years seeing fewer than 100 IPOs, and others seeing more than 400. These IPOs raised $488 billion (in 2001 dollars) in gross incomes, an average of $78 million per deal. The long-run performance of IPOs varies over time.
Brau and Fawcett (2006) conducted a survey in 2000-2002, with 336 chief financial officers (CFOs), comparing theory with practice on the subject of initial public offering (IPO). They found that the main motivations for a firm to conduct an IPO involve the creation of shares for use in future acquisitions and the definition of market price or value of the firm concerned.
At the same time, Brau and Fawcett (2006) argued that 63% of the sample used in their study involved firms that chose not to go public in this period. They said that among the reasons to remain private are: maintaining control in decision-making, avoiding dilution of ownership, and poor conditions of industrial levels and the market.
Hypotheses, Data and Empirical Methods
Nations (UN, 2010), and World Competitiveness Year Book, we consolidated a new database with information concerning countries that presents information of Firms Market Value. The variables used in the initial selection are related to the economic information, finances, politics, legalities, enterprise and society which are all available in these databases (the variables used are similar to those used by the authors of previous studies, except this paper initially selected a superior volume of variables). A partial analysis of these data provides an initial idea of how these factors/constructs could be formed. Eight expected factors have been created based on this insight: Institutional Framework, Business Legislation, Societal Framework, Finance, Management Practices, Attitudes and Values, Democracy, and Human Development.
Hypotheses
This paper focuses on the hypothesis that there are other factors that influence the development of stock markets, but due to multicollinearity problems, were not evident in previous studies. Therefore we investigated the existence of additional factors/constructs that may arise in this paper because of its methodology, which attempts to mitigate the problems of inflation of variance by reducing the variance in orthogonal factors. Figure 1 summarizes the set of hypotheses that could influence the size of these markets. The details of the variables contained in each of the factors/constructs can be viewed in Appendix 1.
Figure 1. Summary of Hypotheses.
Source: Authors.
Sample and Data
The data used in this study are secondary. They had been collected from the following databases: World Development Indicator, The Economist, United Nations and World Competitiveness Year Book of 2006. We merged all databases into one using specific variables from each one as follows:
⋅ The dependent variable, Capitalization of the Market divided by Gross Domestic Product (MktCapGDP) was obtained from the database World Development Indicator. The initial sample consisted of all countries of the world. However the analysis of the database, containing a total of 209 countries, resulted with 105 with complete data (50.2%). The variable demonstrates the size of the stock market of a country in relation to its Gross Domestic Product (GDP); the variable is measured in percentage.
Size of the Stock Market Institutional
Framework
Business Legislation
Societal Framework
Finance
Management Practices Attitudes
and Values Democracy
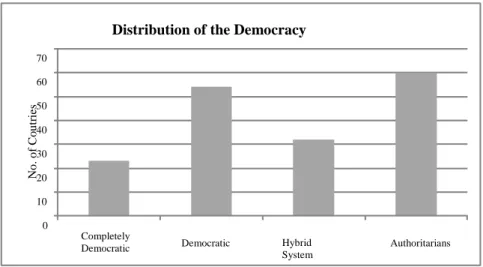
⋅ Democracy Factor: Extracted from the yearbook edition of the magazine The Economist. The database provides the classification of the countries according to their political situation. This database provides information on 169 countries, of which 105 can also found in the World Development Indicator database.
According to The Economist, the countries can be classified based on their grades such as (a) Completely democratic; (b) Democratic; (c) Hybrid system; (d) Authoritarian. This distribution is demonstrated in the Figure 2.
Figure 2. Countries and their Political Situation.
Source: Adapted from the yearbook edition of the magazine The Economist. (2007). Yearbook. Retrieved April 6, 2010, from
This construct is composed of 5 dimensions (Electoral Process and Pluralism, Functioning of Government, Political Participation, Political Culture, and Civil Liberties). The construction of this variable, as well as its items and scale, is defined by the yearbook edition of the magazine The Economist. The score of the variable Democracy is built on the arithmetic mean of the 5 dimensions according to magazine. The scale goes from 0 to 10.
⋅ Human Development Factor: We use the Index of HDI (2010) obtained from the United Nation (UN) database referring to year 2006. This search resulted in a sample of HDI from 182 countries. Despite the limitation of the definition, this variable was chosen as a proxy of the social-human situation, since it is the only one available with information published by a relevant international agency (UN).
⋅ The other factors, Institutional Framework, Business Legislation, Societal Framework, Finance, Management Practices, Attitudes and Values, were obtained from the World Competitiveness Year Book database (See Appendix 1 for detailed information about each Factor). This database provides information on 61 localities, of which 53 are countries and 8 are administrative regions. Among the countries, 51 have capitalization of stock markets information available in the database of World Development Indicator. There are 60 variables of the World Competitiveness Year Book database. The scale goes from 0 to 10, and they are grouped in 6 categories: (a) Institutional Framework; (b) Business Legislation; (c) Social Framework; (d) Finance; (e) Management Practices; (f) Attitudes and Values. Some categories have sub-groups, as shown in Table 1.
0 10 20 30 40 50 60 70
Completely
Democratic Democratic Hybrid System
Authoritarians
N
o
. o
f C
o
u
tr
ie
s
Table 1
Categories and Sub-groups of Variables: World Competitiveness Year Book
Category Sub-Groups
Institutional Framework ⋅Political Efficiency
Business Legislation
⋅Openness
⋅Competition and Regulations
⋅Labor Regulations Societal Framework ⋅Societal Framework
Finance
⋅Bank Efficiency
⋅Stock Market Efficiency
⋅Finance Management Management Practices ⋅Management Practices Attitudes and Values ⋅Attitudes and Values
Note. Source: World Competitiveness Year Book from International Institute for Management Development. (2006). IMD
world competitiveness yearbook 2006. Retrieved April 2, 2010, from
http://www.imd.org/research/publications/wcy/Factors_and_criteria.cfm
After crossing the data, a sample of analyzed countries is presented below:
Table 2
Sample of Countries Analyzed
Countries
Argentina Czech Republic Indonesia New Zealand Sweden
Australia Denmark Ireland Norway Switzerland
Austria Estonia Israel Philippines Thailand
Belgium Finland Italy Poland Turkey
Brazil France Japan Portugal United Kingdom
Bulgaria Germany Jordan Romania United States
Canada Greece South Korea Russia Venezuela
Chile Hong Kong Luxembourg Slovakia
China Hungary Malaysia Slovenia
Colombia Iceland Mexico South Africa
Croatia India Netherlands Spain
Note. Source: Authors.
Figure 3. Distribution of the Dependent Variable and the Outlier (Hong Kong).
Source: Authors.
The average of market capitalization is approximately 74 ±100% of the GDP (taking into consideration the city of Hong Kong), however, with the withdrawal of that city the average falls to 66 ± 60%. The data demonstrates a great variation of this phenomenon.
Table 3
Mean, Deviation & Distribution of Market Capitalization / Gross Domestic Product
Data with Hong Kong Data without Hong Kong
Mean 74,0309 Mean 66,0546
Std. Deviation 101,67668 Std. Deviation 60,77418
Minimun 0,65 Minimun 0,65
Maximun 903,56 Maximun 318,74
Percentiles
25 20,5985
Percentiles
25 20,4445
50 49,9492 50 46,9763
75 93,8360 75 93,1523
Note. Source: Authors.
Factor analysis
Our main concern about previous studies on development of Stock Markets is the supposed covariance between the variables that can lead to a multicollinearity problem. In an ideal model of multiple regression (using OLS) there is no correlation between the dependent variables; they are orthogonal. Our solution is to identify unobservable factors that explain the correlations between observable variables. Instead of using all variables, we use factors that represent the covariance matrix of a group of variables. Still, it is fundamental to assure that all the factors are efficient and optimized; in other words, they must be orthogonal and reduce the number of variables without significant loss of data. Thus, we use eigenvalue 1.00 as the criteria for defining the amount of variables of each factors and the VARIMAX rotation technique for optimization of loads (Hair, Anderson, Tatham, & Black, 2006). According to Fávero, Belfiore, Silva and Chan (2009), it is unusual to apply a factor analysis with a sample of 50 observations. The size of a recommended sample for factor analysis should be,
9 8 7 6 5 4 3 2 1 0
Switzerland South Africa Hong Kong, China
preferentially, equal or superior to 100 observations. In spite of this recommendation, we have not found evidence for rejecting the application of this technique to a database with 50 observations.
In short, Exploratory Factor Analysis techniques are used to obtain grouping of variables (factors), that later on in the analysis process will be used in the multiple regression technique to verify the existence of relationship among the dependent variable and the factors obtained (Hair et al., 2006). This methodology is also called two-step regression.
The first step is to find the factor loadings for each variable that represents the correlation structure between the variables which constitute each construct. The model is:
Fjk = fj1.X1k + fj2 X2k + . . . + fjp Xpk (j=1,...,m; k=1,...n)
Where:
X = observable variables; fj= factor coefficient or factor load. Calculated by the matrix covariance between the variables of the factor; j = each firm and k = each factor.
This way, each sub-grouping of the variable suggested by World Competitiveness Year Book (WCYB) was submitted through the factor analysis with two objectives: Reduction of the number of variables and validation of the factor/constructs used by the WCYB. Among the sub-groupings proposed by the WCYB, only two of them had been separated into more than one factor (Social Framework and Management Policy) by the factor analysis procedure. The Table 4 exhibits the results of the factor analysis of each sub-grouping variables of WCYB with each factor load (component – second column). This produced 12 factors that represent the 60 variables of the WCYB Database.
After this step, a database was built with 14 constructs (12 constructs from WCYB according to Table 4, 1 Construct of democracy and 1 Construct of Social-Human index, HDI, 2010) and the dependent variable size of the stock market (Capitalization of the Market divided by Gross Domestic Product [MktCapGDP]), comprising a single database that will be used for multiple regression.
Table 4
Constructs Obtained through Factor Analysis of the Data WCYB
Variables Component Factor/Construct
PDG 0.883
LRF 0.947
AGP 0.893 Political Efficiency
GD 0.963
TRANS 0.932
BURO 0.940
BC 0.812
CA 0.860
PROTEC 0.930
PSC 0.933 Openness
FI 0.857
AMC 0.937
TI 0.950
Table 4 (continued)
Variables Component Factor/Construct
SUB 0.883
CL 0.897
PC 0.832
PE 0.889 Competition and Regulation
RI 0.904
EDB 0.903
CF 0.834
LR 0.918
UL 0.915 Labor Regulation
IL 0.198
JUST 0.890
PSPP 0.938
RPI 0.933 Societal Framework 1
SC 0.895
DISC 0.621
HARAS 0.923
Z_FIP 0.692 Societal Framework 2
GIR 0.893
CREDIT 0.947
INV_RISK 0.793
VC 0.907 Bank Efficiency
BFS 0.957
BR 0.944
SM 0.891
SR 0.967 Stock Market Efficiency
FIT 0.944
CASH_F 0.985 Finance Management
CD 0.985
EP 0.129
CM 0.176
CB 0.193
AAP 0.138 Management Practice 1
SV 0.169
CS 0.117
MKT 0.174
Table 4 (continued)
Variables Component Factor/Construct
SOCIALR 0.099
AOC 0.521
ENTRE 0.514 Management Practice 2
HSEG 0.106
ATG 0.936
IA 0.805
NC 0.851
FA 0.782 Attitude and Values
NESR 0.891
VS 0.939
CV 0.785
Note. Source: Authors.
Results
OLS regression
Starting with the new database obtained by the factor analysis, we accomplish the empirical testing using multiple regression. Due to the exploratory approach of this paper we adopted the stepwise backward method for the selection of the variables. Thus, we initialized the regression with all available variables and the method drops each variable without statistical significance. Remember that the variables mentioned here refer to the factors found during the factor analysis. Appendix 2 exhibits the first step with all factors regression.
The method of the stepwise backward multiple regression generated the following result: Table 5
Result of the Multiple Regression
Coefficientsa
Unstandardized
Coefficientsac Standardized
95% Confidence Interval for B
Collinearity Statistics
Bb Std.
Error Beta T Sig.
Lowder Bound
Upper
Bound Tolerance VIF
(Constant) .941** .069 13.712 .000 .803 1.079
Openess -.493** .138 -.747 -3.578 .001 -.770 -.216 .253 3.954
Stok Market
Eficiency .620** .133 .939 4.662 .000 .352 .888 .271 3.684
Management
Practice 2 .319** .077 .483 4.117 .163 .163 .474 .802 1.248
From the 14 evaluated factors, only 3 were significant at 1% level. An important item that deserves mention is the low value (less than 5) found for the VIF (Variance Inflation Factors), which means that factors used presented low multicollinearity. ANOVA (Table 6) presents the following results:
Table 6
Resultant ANOVA of the Regression
Model SQ df MQ F Sig.
1 Regression 10,538 3 3,513 14,927 0,000**
Residual 10,824 46 0,235
Total 21,362 49
Note. Source: Authors. (** P-value < 0.01)
From the ANOVA (Table 6), the hypothesis which tests whether all the coefficients are equal to zero is rejected, also at the significance of 0.01.
To finish the validation of the model, it was verified that the normality of the residual through the graph qq (Normal distribution test) and its distribution is random and homoscedastic (see Figure 4).
Figure 4. Residual Analysis of the Model.
Source: Authors.
Once the model is validated, the R² presented is 0.49 and the adjusted one is 0.46 which means the model is capable of explaining 46% of the variability of the studied phenomenon.
Table 7
Explaining ‘Power’ of the Model
Model R R2 R 2 Adjusted Std. Error of the Estimate
0.702 0.493 0.46 0.485
The analysis of the proposed model, leads to the acceptance of the following hypotheses:
1. Financial and Political Structure influence the size of the stock market: The acceptance is confirmed by the coefficient related to the factor Openness (Customs’ authorities, Protectionism, Public sector contract, Freedom for foreign investors, Accessibility of the Stock market, Investments Incentive) with the dependent variable (Coef. = -0.493). Again remember this coefficient is significant at p-value less than 0.01.
In order to understand the negative coefficient for Openness it is important to review, briefly, the literature about economic liberalization and protectionism. In terms of classical and neoclassical theories of trade, Smith (1776), in his work The Wealth of Nations, covered the theory of international trade based on absolute cost advantage. Ricardo (1817) advocated a free market based on the concept of comparative advantages between countries. Besides them, the neoclassical model of international trade from Heckscher-Ohlin-Samuelson, called H-O-S Model, explained international trade based on the abundance or scarcity of production factors that each country has (Leamer, 1995).
Regarding the protectionist approach, Johann Gottlieb Fichte, German philosopher active in the late eighteenth century, wrote a book that advocated economic protectionism, called The Closed
Commercial State, in 1800, which deals with customs prohibition, currency inconvertibility and
the need to have an economically self-sufficient territory managed by the State (Fichte, 1980). Georg Friedrich List, in his critical approach to the classical school, does not see protectionism as an end in itself, but as a means of developing a strong nation able to trade in a world of free trade (List, 1983). After List, Raúl Prebisch presented protectionism as a mechanism of development directed towards the periphery of the capitalist system (as cited in Bielschowsky, 2000).
Several authors have noted the present persistence of protectionist policies. According to Hill (2010), “in spite of the apparent promise of open capital markets offered by globalization and convergence theory, protectionism is on the rise internationally” (p. 1). The author cites the example of China, where, although the authorities deny publicly trade protectionism, it is clear that the decisions of the Ministry of Commerce continue to impose barriers to foreign investment. Similarly, Aaken and Kurtz (2009) found evidence of discrimination against foreign investors in international economic law in the post-crisis 2008. On the other hand, Aktas, Bodt and Roll (2006) found protectionist motivations in the intervention of European regulatory agencies in the period 1990-2000.
Thus, the negative coefficient obtained in this paper confirms the theory enunciated by Fichte (1980), List (1983) and Bielschowsky (2000), and corroborates findings of the existence of economic protectionism nowadays by Aktas et al. (2006), Aaken and Kurtz (2009) and Hill (2010). The result contradicts the classical theories of free trade set out by Smith (1776), Ricardo (1817) and Leamer (1995), among others.
2. The second coefficient of the regression Stock Market Efficiency (Stock Market, Shareholders’ Right, Financial Institutions, Transparency) presents a positive coefficient of 0.62, statistically significant at a level less than 0.001. This factor represents the answers proposed by the papers mentioned in the theoretical reference of this study, in a condensed form (Dyck & Zingales, 2004; La Porta et al., 2000; Wong, 2009).
would be that a more competitive environment results in best practices to ensure the survival of firms. Another channel would be evidence that improvements in management practices and efficiency have an impact on the capital market where managers are more fearful of losing their jobs. Bloom and Reenen (2010) also found that public companies have better management practices. Our literature review did not uncover any specific relationship between management practices and stock market development.
Analysis of the result
In this paper, we aimed to search for factors/constructs that are capable of explaining the size of the stock market of countries in relation to their GDP. The use of factors was considered due to the small number of countries (about 50) in relation to the initial number of available variables (about 70) and the number of variables used by other authors in studies cited in the literature review. The purpose of factor analysis is to reduce the number of variables and to avoid variables with multicollinearity. The data treatment enacted found three factors that explain 46% of the variability of the dependent variable. These factors represent at least two different constructs capable of explaining the reason for the stock market size for the analyzed countries. We can affirm that these factors are different from each other by the low correlation coefficient (low VIF). The cross section multiple regression with the factors has demonstrated significant coefficients at a level of significance of 0.01, which allows us to conclude that they are distinct and relevant factors.
Concerning the other hypotheses initially proposed, the hypothesis of Democracy was not confirmed once the Factor/Construct related to the democracy of the country was eliminated during regression due to presenting low significance. The others (1) Institutional Framework, (3) Social Framework, (5) Management Practices, were also not able to be confirmed for the same reason. The HDI (2010) showed little significance in explaining stock market size.
The biggest advantage of the factor analysis, introduced in the present study, in relation to the direct use of the multiple regression carried through by the previous works (Dyck & Zingales, 2004; La Porta et al., 1997, 1998; Pagano et al., 1998; Ritter & Welch, 2002) is that the possibility of diverse common variables presented in this study can be represented, in the proper proportion, by the constructed factors (Table 4 presents the load of each variable at the factor analysis). Finally, it is possible to assure better quality in the multiple regression by using factors with low correlation between them and minimizing the effect of the multicollinearity possibility which could have been responsible for the elimination of important variables in previous studies mentioned in the theoretical review.
Conclusion
Due to the unequivocal importance stock markets for country development, this paper sought to extend upon previous empirical literature as to the determinants of stock market development.
The factors Openness and Stock Market Efficiency are recurrent issues, highly debated in the financial and economic literature (Dyck & Zingales, 2004; Fichte, 1980; La Porta et al., 2000; Pagano et al., 1998, among others). However, the questions related to management practices, entrepreneurship and adaptability of the company to market changes had not yet been approached by cited papers as to the capability of developing stock markets. Our paper’s contribution comes from this aspect. For future research, we suggest analyzing the issue using panel data, but first making the factorial analysis for each year and using fixed effects, so problems regarding specific characteristics of each year of analysis can be mitigated and a greater representation of variables by a large amount of records could be performed.
Received 21 November 2010; received in revised form 12 July 2011.
Acknowlodgements
The authors acknowledge the financial support provided by CAPES (Coordenação de Aperfeiçoamento de Pessoal de Nível Superior) to carry out this research.
References
Aaken, V., & Kurtz, A. J. (2009). The global financial crisis and international economic law [Working Paper No 4]. University of St. Gallen Law & Economics, Washington, District of Columbia, Washington. Retrieved June 23, 2011, from http://ssrn.com/abstract=1417957
Aktas, N., Bodt, E., & Roll, R. W. (2006). Is European M&A regulation protectionist? [Working Paper No 2318]. EFA Maastricht Meetings Paper, Maastricht, The Netherlands. Retrieved June 10, 2011, from http://ssrn.com/abstract=567106. doi: 10.2139/ssrn.567106
Berle, A. A., & Means, G. C. (1932). The modern corporation and private property. New York: MacMillan.
Bielschowsky, R. (2000). Cinqüenta anos de pensamento da CEPAL. Rio de Janeiro: Record.
Bloom, N., & Reenen, J. V. (2010). Why do management practices differ across firms and countries? Journal of Economic Perspectives, 24(1), 203-224. doi: 10.1257/jep.24.1.203
Bozec, Y., & Bozec, R. (2007). Ownership concentration and corporate governance practices: substitution or expropriation effects? Canadian Journal of Administrative Sciences, 24(3), 182-195. doi: 10.1002/cjas.23
Brau, J. C., & Fawcett, S. E. (2006). Initial public offerings: an analysis of theory and practice. Journal of Finance, 61(1), 399-436. doi: 10.1111/j.1540-6261.2006.00840.x
Camargos, M. A., & Barbosa, F. V. (2006, setembro). Evidência empírica do impacto da adesão aos níveis diferenciados de governança corporativa sobre o comportamento das ações na Bovespa. Anais do Encontro Nacional da Associação Nacional de Pós-Graduação e Pesquisa em Administração, Salvador, BA, Brasil, 30.
Dalmácio, F. Z. (2009). Mecanismos de governança e acurácia das previsões dos analistas do mercado brasileiro: uma análise sob a perspectiva da teoria da sinalização (Tese de doutorado). Universidade de São Paulo, São Paulo, SP, Brasil.
David, R., & Brierley, J. (1985). Major legal systems in the world today. London: Stevens and Sons. Doidge, C., Karolyi, G. A., Stulz, R. M., Lins, K. V., & Miller, D. P. (2005). Private benefits of
control, ownership, and the cross-listing decision [Working Paper Nº 77]. Dice Center Working Paper, Brussels, Belgium. Retrieved May 7, 2010, from http://ssrn.com/abstract=668424. doi: 10.2139/ssrn.668424
Dyck, A., & Zingales, L. (2004). Private benefits of control: an international comparison. Journal of Finance, 59(2), 537-600. doi: 10.1111/j.1540-6261.2004.00642.x
Fávero, L. P., Belfiore, P., Silva F. L., & Chan, B. L. (2009). Análise de dados - modelagem multivariada para tomada de decisões. Rio de Janeiro: Elsevier.
Fernandes, N. G., & Ferreira, M. A. (2007). The evolution of earnings management and firm valuation: a cross-country analysis. EFA, Ljubljana Meetings Paper, Ljubljana, Slovenia. Retrieved June 5, 2010, from http://ssrn.com/abstract=965636
Fernandes, N. G., & Ferreira, M. A. (2008). Does international cross-listing improve the information
environment. Journal of Financial Economics, 88(2), 216-244. doi:
10.1016/j.jfineco.2007.06.002
Fichte, J. G. (1980). L'Etat commercial fermé. Lausanne: Editions de l'Age d'Homme.
Grossman, S., & Hart, O. (1988). One-share-one-vote and the market for corporate control. Journal of Financial Economics, 20(1-2), 175-202. doi: 10.1016/0304-405X(88)90044-X
Hair, J. F., Jr., Anderson, R. E., Tatham, R. L., & Black, W. C. (2006). Multivariate data analysis (6th ed.). Hardcover: Prentice Hall.
Harris, M., & Raviv, A. (1988). Corporate governance: voting rights and majority rules. Journal of Financial Economics, 20(1-2), 203-236. doi: 10.1016/0304-405X(88)90045-1
Hill, J. G. (2010). Takeovers, poison pills and protectionism in comparative corporate governance [Working Paper No 168]. ECGI Law Working Paper, Brussels, Belgium. Retrieved June 5, 2011, from http://ssrn.com/abstract=1704745
Human Development Reports. (2010). Human development index. Retrieved April 2, 2010, from http://hdr.undp.org/en/statistics
Info Money. (2010). Número de investidores pessoa física na bolsa segue em alta. Retrieved June 10,
2010, from http://web.infomoney.com.br/templates/news/view.asp?codigo=1796697&path=/suasfinanca/
International Institute for Management Development. (2006). IMD world competitiveness yearbook
2006. Retrieved April 2, 2010, from
http://www.imd.org/research/publications/wcy/Factors_and_criteria.cfm
International Monetary Fund. (2010). IMF financial data by country. Retrieved April 5, 2010, from http://www.imf.org/external/data.htm
La Porta, R., Lopez-de-Silanes, F., Shleifer, A., & Vishny, R. W. (1997). Legal determinants of external finance. Journal of Finance, 52(3), 1131-1150.
La Porta, R., Lopez-de-Silanes, F., Shleifer, A., & Vishny, R. W. (1998). Law and finance. Journal of Political Economy, 106(6), 1113-1155.
La Porta, R., Lopes-de-Silanes, F., Shleifer, A., & Vishiny, R. W. (2000). Investor protection and corporate governance. Jounal of Financial Economics, 58(1-2), 3-27. doi: 10.1016/S0304-405X(00)00065-9
Leal, R. P. C., Carvalhal-da-Silva, A. L., & Valadares, S. M. (2002). Estrutura de controle das companhias brasileiras de capital aberto. Revista de Administração Contemporânea, 6(1), 7-18. doi: 10.1590/S1415-65552002000100002
Leamer, E. E. (1995). The heckscher-ohlin model in theory and practice. Princeton, New Jersey: Princeton University Press.
List, G. F. (1983). Sistema nacional de economia política. São Paulo: Abril Cultural.
Lopes, A. B., & Walker, M. (2008). Firm-level incentives and the informativeness of accounting reports: an experiment in Brazil [Working Paper]. Manchester Business Scholl, Manchester, United Kingdom. Retrieved March 10, 2010, from http://ssrn.com/abstract=1095781
Malacrida, M. J. C., & Yamamoto, M. M. (2006). Governança corporativa: nível de evidenciação das informações e sua relação com a volatilidade das ações do Ibovespa [Edição Especial]. Revista de Contabilidade e Finanças da USP, 17, 65-79. doi: 10.1590/S1519-70772006000400006
Pagano, M., Panetta, F., & Zingales, L. (1994). Why do companies go public? An empirical analysis [Working Paper Nº 402]. University of Chicago, Chicago, United States.
Pagano, M., Panetta, F., & Zingales, L. (1998). Why do companies go public? An empirical analysis. Journal of Finance, 53(1), 27-64. doi: 10.1111/0022-1082.25448
Ricardo, D. (1817). On the principles of political economy and taxation. London: John Murray.
Ritter, J. R., & Welch, I. (2002). A review of IPO activity, pricing, and allocations. Journal of Finance, 57(4), 1795-1828. doi: 10.1111/1540-6261.00478
Rogers, P., Ribeiro, K. C. S., & Sousa, A. F. (2005). Comparações múltiplas das carteiras de bolsa no Brasil: avaliação da performance do índice de governança corporativa. Revista de Gestão da USP, 12(4), 55-72.
Shleifer, A., & Vishny, R. W. (1997). A survey of corporate governance. Journal of Finance, 52(2), 737-783.
Silveira, A. D. M., & Dias, A. L., Jr. (2007, julho). Impacto da divulgação de disputas entre acionistas controladores e minoritários sobre o preço das ações no Brasil. Anais Encontro Brasileiro de Finanças, Sociedade Brasileira de Finanças, Rio de Janeiro, RJ, Brasil, 7.
Smith, A. (1776). The wealth of nations. London: W. Strahan and T. Cadell.
The Economist (2007). Yearbook. Retrieved April 6, 2010, from http://www.economist.com/node/8908438
The World Bank (2010). World development indicators. Retrieved April 14, 2010, from http://www.worldbank.org/data/wdi
Wong, S. C. Y. (2009). Uses and limits of conventional corporate governance instruments: analysis and guidance for reform (integrated version) [Research Paper/10-32], Chicago, United States of America, Private Sector Opinion, Global Corporate Governance Forum. Retrieved June 2, 2010, from http://ssrn.com/abstract=1409370
APPENDIX
Appendix 1
Table 1
Variables Obtained from the World Competitiveness Year Book Database
Institutional Framework
Political Efficiency
Policy Direction of the Government (PDG) Efficiency of Policy Direction of the Government
Legal and regulatory Framework (LRF) The legal and regulatory framework encourages the competitiveness of enterprises.
Adaptability of government policy (AGP) Adaptability of government policy to changes in the economy is high. Government decision (GD) Government decisions are effectively implemented.
Transparency (TRANS) Transparency of government policy is satisfactory Bureaucracyc (BURO) Bureaucracy does not hinder business activity. Bribing and corruption (BC) Bribing and corruption do not exist
Business Legislation
Openness
Custom Authorities (CA) Customs’ authorities do facilitate the efficient transit of goods. Protectionism (PROTE) Protectionism does not impair the conduct of your business. Public sector contract (PSC) Public sector contracts are sufficiently open to foreign bidders. Foreign investor (FI) Foreign investors are free to acquire control in domestic firms. Access to Capital Market (ACM) Capital markets (foreign and domestic) are easily accessible. Investment incentives (II) Investment incentives are attractive to foreign investors.
Competition and Regulations
Subsidies (SUB) To private and public firms as a percentage of GDP
Competition legislation (CL) Competition legislation is efficient in preventing unfair competition. Price Control (PC) The intensity of the price controls.
Parallel economy (PE) Parallel (black-market, unrecorded) economy does not impair economic development.
Regulation Intensity (RI) The intensity of the regulation of competition and the market. Ease of doing business (EDB) Ease of doing business is supported by regulations.
Creation of firms (CF) Creation of firms is supported by legislation.
Labor Regulations
Labor Regulation (LR) Labor regulations (hiring/firing practices, minimum wages, etc.) do not hinder business activity.
Unemployment legislation (UL) Unemployment legislation provides an incentive to look for work. Immigration laws (IL) Immigration laws do not prevent your firm from employing foreign labor.
Table 1 (continued)
Societal Framework
Justice (JUST) Justice is fairly administered.
Personal security and private property (PSPP) Personal security and private property are adequately protected. Risk of political instability (RPI) The risk of political instability is very low.
Social cohesion (SC) Social cohesion is a priority for the government. Females in parliament (FIP) Percentage of total seats held by females in Parliament. Gender income ratio (GIR) Ratio of estimated female to male earned income globally. Harassment (HARAS) Individuals are treated with respect and dignity
Finance
Bank Efficiency
Credit (CREDIT) Credit is easily available for businesses.
Investment risk (IR) Investment risk.
Venture capital (VC) Venture capital is easily available for businesses.
Banking and financial service (BFS) Structure of banking and financial service (higher, better structure). Banking regulation (BR) Finance and banking regulation is sufficiently effective
Stock Market Efficiency
Stock Market (SM) Stock Market Operations (higher, better operation). Shareholders’ rights (SR) Shareholders' rights are sufficiently implemented.
Finacial institution tranparency (FIT) Financial institutions' transparency is sufficiently implemented.
Finance Management
Cash flow (CASH_F) Situation of the cash flow of the firms (higher, better).
Corporate debt (CD) Corporate debt does not restrain the ability of enterprises to compete. Management Practices
Abilities of the company (AOC) Adaptability of firms to market changes is high. Ethical practice (EP) Ethical practices are implemented in firms. Credibility of manager (CM) Credibility of managers in society is strong.
Corporate board (CB) Corporate boards supervise the management of firms effectively.
Auditing and account practice (ACP) Auditing and accounting practices are adequately implemented in business. Shareholder value (SV) Respect for shareholder value.
Customer satisfaction (CS) Customer satisfaction is emphasized in firms.
Entrepreneurship (ENTRE) Entrepreneurship of managers is widespread in business.
Marketing (MKT) Investment in marketing.
Social responsibility (SOCIAL_R) Social responsibility of business leaders is high. Attitudes and Values
Health, safety and Environmental concerns (HSEC)
Health, safety & environmental concerns are adequately addressed by management.
Attitude toward globalization (ATG) Attitudes toward globalization are generally positive in your society. Image Abroad (IA) The image abroad of your country encourages business development. National culture (NC) The national culture is open to foreign ideas.
Table 1 (continued)
Attitudes and Values
Flexibility and adaptability (FA) Flexibility and adaptability of people are high when faced with new challenges.
Need for economic and social reform (NESR) The need for economic and social reforms is generally well understood. Values of Society (VS) The value system in your society supports competitiveness.
Corporate Values (CV) Corporate values take into account the values of employees.
Note. Source: World Competitiveness Year Book from International Institute for Management Development. (2006). IMD
world competitiveness yearbook 2006. Retrieved April 2, 2010, from
http://www.imd.org/research/publications/wcy/Factors_and_criteria.cfm
Appendix 2
Table 1
First Step of Stepwise Backward Method – Regression with all Factors
MktCapGDP(%) (All factors model)
HDI – Human Development Index -1.6754
(1.8542)
Political Efficiency -0.1895
(0.2768)
Openness -0.5830***
(0.1980)
Competition and Regulations 0.4550
(0.4033)
Labor Regulations 0.1879
(0.1887)
Societal Framework 1 -0.0825
(0.2982)
Societal Framework 2 -0.0187
(0.0847)
Bank Efficiency 0.0665
(0.2602)
Stock Market Efficiency 0.4781**
(0.2194)
Finance Management 0.2158
(0.1811)
Management Practices 1 -0.2191
Table 1 (continued)
MktCapGDP(%) (All factors model)
Management Practices 2 0.2751**
(0.1315)
Attitude and Values -0.1846
(0.1844)
Democracy Index 0.1539
(0.2018)
_cons 2.4241
(1.6598)
N 50
r2-adj 0.57
Note. Source: Authors.