BAR, Curitiba, v. 8, n. 4, art. 3, pp. 395-411, Oct./Dec. 2011
Operational Practices and Financial Performance: an Empirical
Analysis of Brazilian Manufacturing Companies
André Luís de Castro Moura Duarte *
E-mail address: [email protected] Instituto de Ensino e Pesquisa – INSPER São Paulo, SP, Brazil.
Luiz Artur Ledur Brito
E-mail address: [email protected] Fundação Getúlio Vargas – EAESP/FGV São Paulo, SP, Brazil.
Luiz Carlos Di Serio
E-mail address: [email protected] Fundação Getúlio Vargas – EAESP/FGV São Paulo, SP, Brazil.
Guilherme Silveira Martins
E-mail address: [email protected] Fundação Getúlio Vargas – EAESP/FGV São Paulo, SP, Brazil.
* Corresponding author: André Luís de Castro Moura Duarte
INSPER, Rua Quatá, 300, Vila Olímpia, São Paulo, SP, 04546-042, Brazil.
Abstract
In the operations management field, operational practices like total quality management or just in time have been seen as a way to improve operational performance and ultimately financial performance. Empirical support for this effect of operational practices in financial performance has been, however, limited due to research design and the inherent difficulties of using performance as a dependent variable. In this paper, we tested the relationship between selected operational practices (quality management, just in time, ISO certification and services outsourcing) in financial performance outcomes of profitability and growth. A sample of 1200 firms, operating in São Paulo, Brazil, was used. Analysis using multiple regression explored the direct effect of practices and their interaction with industry dummies. Results did not support the existence of a positive relationship with financial performance. A negative relationship of outsourcing with both profitability and growth was found, supporting some critical views of the outsourcing practice. A weaker negative relationship between ISO certification and growth was also found. Some interactions between practices and industries were also significant, with mixed results, indicating that the effect of practices on performance might be context dependent.
Introduction
The search for a recipe for superior performance using operational practices has been a frequent concern in management literature since the early days of the scientific management by Taylor (1911). Several managerial publications claim to have found the formula for business success like the book by Joyce, Nohria and Roberson (2003) that states it in the title What really works: the 4+2 formula for sustained business success. Operations management has extensively explored the potential of the then successful Japanese management techniques when applied to western companies. This resulted in the Quality Management movement (Cole, 1998) and the Lean Manufacturing approach (Womack & Jones, 1996).
Despite its relevance to the field, a more rigorous and scientific evaluation of the impact of management practices in financial performance still shows mixed results as demonstrated in more detail in the literature review section of this paper. Several reasons can account for these mixed results. First, financial performance is an elusive dependent variable (March & Sutton, 1997) being affected by multiple variables simultaneously, making any investigation limited in terms of controls. Second, some operational practices may deliver positive outcomes in some settings, but negative outcomes in others, and identifying these interactions is not simple. Outsourcing is one example, as indicated by Rossetti and Choi (2005). Third, identifying what constitutes a practice is also not simple. Powell (1995) showed that the soft, cultural aspects of quality management are the ones that can affect performance and not simply the adoption of practices. Tan, Kannan and Narasimhan (2007) found that the capabilities behind the practice is what drives performance, a result consistent with the Resource-based theory (RBT) of strategy (Barney & Clark, 2007). Fourth, imitation of successful practices continuously wears out financial benefits through competition, following the RBT logic. Finally, given all the above points, large samples are necessary to have the power to identify relationships that may have been weakened or diluted by all of these factors.
This paper contributes to the attempt of answering the question: do management practices lead to superior financial performance? Addressing some, but not all, of the above points, we explore the impact on performance of a set of practices (Just-in-time; quality management; services outsourcing; ISO standards) in a sample of 1200 firms in the state of São Paulo, Brazil.
In the next section we review the literature and previous studies that explore the impact of operational practices and performance. A methodology section describes the sample, operationalization of variables and method of analysis used. We then present and discuss the results and a conclusions section ends the paper.
Operating Practices and Firm Performance
Assuming that internal factors at firms are primarily responsible for performance variation, organizations are expected to make changes based on best practices to their structural and infrastructural elements in order to attain selected performance goals (Narasimhan, Swink, & Kim, 2005). According to Hayes and Pisano (1996), firms are on performance curves based on the resources they use, but new manufacturing technologies, including management-related ones, such as JIT and TQM (Total Quality Management), might place firms on new performance curves.
Table 1
Operational Practices and Theoretical-empirical References
Operational
Practices References
Quality Ross (1993); Mohrman, Tenkasi, Lawler and Ledford (1995); Powell (1995); Kaynak (2003); Cho and Pucik (2005); Sila (2007).
JIT
Bartezzaghi, Turco and Spina (1992); Flynn, Sakakibara and Schroeder (1995); Vuppalapati, Ahire and Gupta (1995); Upton (1998); Claycomb, Dröge and Germain (1999); Slack, Chambers and Johnston (2002); Cheryl and Fawson (2003); Fullerton, Cheryl and Fawson (2003); Sale and Inman (2003).
ISO Standards Heras, Dick and Casadesús (2000); Rao and Holt (2005)
Outsourcing
Williamson, (1975, 1985); Prahalad and Hamel (1990); Barney, (1991); Peteraf, (1993); Lei and Hitt (1995); Londsdale (1999); Gilley and Rasheed (2000); Hays, Hunton and Reck (2000); Jones (2000); Barrar, Wood, Jones and Vedovato (2002); Jiang and Qureshi (2006); Holcomb and Hitt, (2007); McIvor, (2009)
Note. Source: authors.
Quality and Performance Practices
TQM can be defined as a management philosophy that integrates with a series of practices emphasizing continued improvement, meeting consumer expectations and needs, reducing re-work, long-term planning, redesigning processes, competitive benchmarking, teamwork, constant results measurement, and a close relationship with suppliers (Ross, 1993).
The results of several of the empirical studies on ties between quality practices and organizational performance are mixed. Powell (1995), for example, uses RBT to study the impact of some elements of TQM programs on the creation of competitive advantage. The results suggest that practices associated with TQM programs are not capable of generating sustainable competitive advantages, but some of the characteristics present in quality programs help form intangible and behavioral elements such as leadership, organizational skills and culture.
Kaynak (2003) contributed to the discussion with a comprehensive review of the literature. The author investigated the links between the different TQM practices, attempting, in particular, to determine how they affect organizational performance on three levels: operational, marketing and financial. The results support the argument that only a few TQM practices (supplier quality management, product/service project, and process management) have a positive effect on an organization’s operational performance. The same practices also affect financial and marketing performance through the organization’s operational performance.
Cho and Pucik (2005) examined the relationship between quality, innovation, growth, profitability and the firm’s market value. The results of the structural equations model show that quality has different effects on profitability and growth. While the quality has a direct impact on profitability, its effect on growth is mediated by innovation. On the other hand, Mohrman et al.
(1995), were unable to use financial statistics to find a connection between adopting TQM and financial performance. Still, some positive ties were found between TQM and market share and between TQM and employee efficiency.
organizational efficiency, but no significant connection was found with either financial or market performance. Only indirect effects of TQM made themselves felt on these two latter performance variables.
Based on all of the above studies, we may say that some positive connection may be expected between quality and performance, but this relationship is not always direct, as suggested by some researchers. Furthermore, some results are difficult to compare and, sometimes, conflicting.
JIT and Performance
Literally, JIT means producing goods and services exactly when they become needed, not before or after. Slack, Chambers and Johnston (2002) divide JIT into philosophy and a series of techniques. The philosophy of JIT helps guide the actions of an organization’s managers and is based on doing things well and simply, improving them constantly, and eliminating waste; all of this with the involvement of everyone in the organization. JIT as a set of techniques and tools represents the means to attain the fundamentals the philosophy prescribes.
Some of the main elements of JIT are also to be found in the TQM philosophy (Flynn, Sakakibara, & Schroeder, 1995). Vuppalapati, Ahire and Gupta (1995) argue that firms that implement both philosophies jointly attain better performance than those that view and implement them in isolation.
Several of the authors who empirically investigated the benefits of JIT, such as Bartezzaghi, Turco and Spina (1992) and Upton (1998), focused their studies on the benefits relative to organizations’ operating performance, including reduced lead time, production time and procurement batches, increased process flexibility, accelerated delivery, low cost and low cycle time, to name a few. As a result, these authors found significantly improved operational efficiency.
Claycomb, Dröge and Germain (1999) surveyed executives with 200 American organizations. The authors also found a positive relationship between JIT and financial and efficiency metrics. Fullerton, Cheryl and Fawson (2003) surveyed 95 firms that had implemented JIT and 158 firms without JIT in various US manufacturing industries. They found that firms with a broader adoption of the JIT approach were able to attain better financial performance. But no significant correlation was found between exclusive JIT variables (Kanban and JIT procurement) and profitability. The authors were also unable to find a positive correlation between the Manufacturing JIT variable and profitability, and a negative correlation between Quality JIT and profitability. Finally, the authors show that no significant evidence exists that firms with JIT become more profitable over the years.
Sale and Inman (2003) also performed an empirical comparison between JIT and TOC (Theory of Constraints) adopters and traditional manufacturers. Their results show that the best performance and greatest evolution were found with firms that had implemented TOC. JIT firms had no better performance than traditional manufacturers. In addition, they showed no performance improvement after implementing JIT.
ISO Standards and Performance
The ISO standards were first published in the late 1970s and quickly became a benchmark for quality management. This study takes account of two ISO standards: ISO 9000 and ISO 14000.
In terms of competitive performance, Heras, Dick and Casadesús (2000) made headway with the finding that the causal link lies not in the direction of certified firms have performed better than uncertified ones. In fact, the causal link is firms with better financial performance are more likely to get ISO 9000-certified.The authors suggest some hypotheses as to why this might be. According to them, the systems certification requirements generate high implementation and maintenance costs, which make highly profitable firms more likely to implement than others. In the same sense, larger firms could better dilute those costs across their operations, which smaller firms lack such a choice. Finally, more profitable and bigger firms tend to compete internationally. Because global players make efforts to become world-class firms based on their quality management systems, certification becomes a seal of assurance that helps entering and operating in certain international target markets.
More broadly, Rao and Holt (2005) show that the economic performance of ISO 14001-adopting firms is not only associated with internal processes, but also with their suppliers and customers. The most remarkable result of Rao and Holt (2005) is that firms must integrate their suppliers into the adopting of environmentally correct practices, as this is crucial to successfully reducing production-process waste and residue. As for competitive gains the study shows that supply chains with integrated environmental practices (green chains) not only achieve substantial cost reductions, but can also expand sales and market share and even exploit new commercial opportunities.
As seen in this section, not many works investigate the relationship between ISO standards and performance and, in particular, ISO standards and financial performance. In most studies, this assessment is more qualitative than quantitative.
Outsourcing and Performance
Lei and Hitt (1995) define outsourcing as reliance on a certain outside source of manufactured components or value-added activities. Gilley and Rasheed (2000) attempt to clarify the concept of outsourcing, defining it as the purchase of a good or service that was originally produced internally, or might have been produced internally, but was in fact produced by a supplier.
Outsourcing is a critical element of organizational strategy, as a powerful vehicle to reduce costs and improve performance (Holcomb & Hitt, 2007). To study outsourcing, two theories make a valuable contribution (McIvor, 2009): transaction cost economics (TCE) and the resource-based theory (RBT) of the firm. TCE specifies the conditions under which an organization should manage an economic exchange internally within its boundaries, and the conditions suitable for outsourcing - managing an economic exchange externally (Williamson, 1975, 1985). The level of transaction specific investment in the economic exchange is the principal determinant of whether an activity should be internalized or not. An alternative theory to understanding the outsourcing decision is the RBT, which views the firm as a bundle of assets and resources that, if employed in distinctive ways, can create competitive advantage (Barney, 1991; Peteraf, 1993). The RBT is important to the study of outsourcing, as superior performance achieved in organizational activities relative to competitors would explain why such activities are internalized within the organization. Prahalad and Hamel (1990) were pioneers in the idea that firms should focus on their core competences to become more competitive, thereby avoiding the waste of efforts on secondary activities.
the decisions to outsource and on control over the outsourcing process, and few empirical, results-focused studies are to be found from the literature.
Londsdale (1999) suggests that only 5 percent of the surveyed firms attained significant benefits from outsourcing. Jones (2000) was interested in assessing the impact of outsourcing on the Research and Development (R&D) area of pharmaceutical companies. The results of the survey show a 5-16 percent increase in firms’ R&D cost when they choose to outsource this service. Barrar, Wood, Jones and Vedovato (2002) used DEA (Data Envelopment Analysis) to compare the efficiency of firms that outsource their accounting services and of those that do not. The survey shows that outsourcing accounting services is more efficient only in terms of productivity. Hays, Hunton and Reck (2000) investigate the impact of outsourcing on share prices. Hays et al. (2000) find empirical evidence that outsourcing has a positive effect on stock prices.
More recently, Jiang, Frazier and Prater (2006) did a broader empirical research with a focus on performance. The authors assessed the results of outsourcing in terms of three distinct performance variables: cost, productivity and profitability. The study showed evidence that outsourcing may improve a firm’s costs, but failed to find that it can improve an organization’s profitability and productivity.
Methodology
This study used a secondary database called PAEP (Pesquisa da Atividade Econômica Paulista — São Paulo State Economic Activity Survey), developed by SEADE (Fundação Sistema Estadual de Análise de Dados — State Data Analysis System Foundation). This is broad-based and full of administrative, financial and operational information, based on a census survey in companies over 30 employees. It is, therefore, a detailed portrait of São Paulo industry, but is little explored by Brazilian scholars. The survey occurs every five years and our database is composed of two editions: 1996 (10,658 companies) and 2001 (11,524 companies). Our research comprises the industrial sector and has only companies that participated in both surveys, a total of 3,589 companies. Additionally, this research chose to use only single-site enterprises, i.e. those companies that had only one industrial plant installed in São Paulo (Table 2).
Table 2
Selected Industries and Firms
CNAE Code Industry Firms
158 Manufacturing, other food products 82
181 Garments tailoring 107
193 Manufacturing, footwear 74
213 Manufacturing, paper or cardboard containers 50
251 Manufacturing, rubber articles 56
252 Manufacturing, plastic goods 190
264 Manufacturing, ceramic products 96
283 Forging, Stamping, metallurgy and metal-treatment serv. 75
289 Manufacturing, various metallic products 112
292 Manufacturing, general machinery and equipment 65
Table 2 (continued)
CNAE Code Industry Firms
296 Manufacturing, other specific machinery and equipment 66
344 Manufacturing, automotive parts and accessories 104
361 Manufacturing, furniture 65
369 Manufacturing, various products 58
TOTAL 1.200
Note. Source: research results.
We use only single-location ones, that is, firms with only one manufacturing unit in the São Paulo State. This is due to the fact that PAEP provides aggregate organization data, that is, data on an organization’s various manufacturing units. Using information on single-location firms increases data reliability, as responses to the questionnaires always concerned that particular unit. The main implication of this choice was removal from the sample of a significant share of larger firms that normally have more than one manufacturing unit.
For the purposes of this study, a categorization was created from the first three digits of the CNAE code (an industry classification similar to NAICS). The purpose was to group together the largest possible number of firms with similar characteristics. Because some three-digit industries were left with a reduced number of firms, and to facilitate the analysis, we chose to work only with industries with 50 or more firms. Table 1 shows the industries and the number of firms.
The sample is large enough to be regarded as a contribution to business administration knowledge in the specific area of operations management. In spite of this, the sample is not probabilistic and, therefore, the results have no outside validity and the conclusions cannot be generalized.
The study uses two variables to measure firm performance: a profitability (P) estimate and the
revenue growth rate (RGR), as seen in the equations (1) and (2).
Profitability (P) = Total Revenue2001–(Total Expenses2001+Total Wages2001)
Total Revenue2001
(1)
Revenue Growth Rate (RGR) = Revenue2001 – Revenue1996 (2)
Revenue1996
The operating practices variables are the study’s main independent variables. They were construed using indicators available in the database. The rationale and detailed operationalization are described in sequence.
Table 3
Research Variables
Independent Variables Dependent Variable Control Variables
Profitability (P) Quality Practices (Q) Revenue (R)
Revenue Growth Rate (RGR) Just-in-Time Practices (JIT) Age (A)
ISO Standards (ISO)
Services Outsourcing Level (O):
⋅ Quality Practices (Q): formed from a set of quality-related programs, methods and techniques adopted by the surveyed firms. The bigger the number of methods and techniques a firm uses, the greater the variable for the firm. The survey measures the adoption of eight quality practices: total preventive maintenance, kaizen, use of mini-plants, total quality management, quality auditing, statistical process control, quality indicators, and final inspection. We created a variable that counts the number of practices said to be adopted by each company. The variable ranges from zero to eight, depending on the number of practices each firm adopts. Strictly speaking, this is a categorical variable, but may be regarded as ordinal, assuming that the larger the number of practices, the more intense the use of quality management practices in general. In its use as an independent variable in regressions, however, it is treated as an interval variable, which is a brave approximation at the very least. This treatment assumes that differences in an additional practice are equivalent across the scale, which is unlikely to have conceptual grounds. But the procedure may lead to an acceptable approximation where the dependent variable is monotonic and a large number of data is used (Nunnally & Bernstein, 1994).
⋅ Just-in-Time Practices (JIT): the original survey has two items to measure JIT, one exploring internal JIT and the other external JIT. A dummy variable was created with the value of zero if the company used neither internal nor external JIT and with the value of one when the company practiced either one of them.
⋅ ISO Standards (ISO): the original survey also had two items related to ISO. One identifying the usage of ISO9000 standards and another with ISO14000. A similar approach to JIT was used. A dummy variable was created with the value zero for companies that used neither ISO9000 nor ISO14000 and with the value 1 if the company used either one.
⋅ Services Outsourcing Level (O): a continuous interval variable was defined based on each manufacturing firm’s expenditures in the purchase of services provided by other suppliers. We therefore assume the level of outsourcing to be the level of spending on the purchase of services from third parties. The variable was calculated as follows, as seen in equations (3).
Service Outsourcing Level (O) = Enatural entities + Elegal entities
Revenue2001
*100 (3)
Beside operating variables, two control variables were used. Control variables are factors the investigator purposefully neutralizes or cancels out in a study to prevent them from interfering with the analysis of the relationship between the study’s independent and dependent variables (Lakatos & Marconi, 1985). The control variables used here were selected based on their possible influence on dependent variables and the study’s other independent variables. The following control variables are used:
⋅ Revenue (R): the firm’s total 2001 revenues in Brazilian Reais (R$). Represents firm size, under the assumption that bigger firms will have bigger revenues;
⋅ Age (A): a firm’s age in years.
In order to compare the results of firms in different industries, we chose to standardize certain variables based on the industry’s mean and standard deviation. Variables standardized based on the industry’s mean were: Revenue, Age, Services Outsourcing Level and Profitability. Standardization transformed the mentioned variables as being a certain number of standard deviations above or below the industrial mean, thereby minimizing industries’ effects on the analysis.
To answer the study’s questions we use the statistical tools of Multiple Regression. Regression analysis goes beyond correlation analysis insofar as it estimates the parameters of the systematic behavior across them, besides measuring the association between output variable Y and a set of independent variables (X1, X2, ...., Xp) (Lira, 2004).
Two regressions were run for each dependent variable: one using production variables only, indistinctly for the various manufacturing industries, as the dependent variables are standardized by industry; and another with a set of dummy independent variables by industry. Interaction between dummy industries and other independent variables were also tested. Because industry-effect was already addressed through variable standardization, the idea was to explore different industry-related links between other independent variables and the dependent variable. The purpose of this second regression is to investigate whether production variables may exert different influences in different industries. Regressions used the stepwise variable-selection method.
Results and Analyses
The operational practices are used more intensively in some industries and less in others, which may indicate the sector’s level of competitiveness. This is the main conclusion of descriptive analysis in Table 4. Sector 344 (Manufacturing, automotive parts and accessories) is one that most uses operational practices of Quality, JIT, ISO and outsourcing. Moreover, this sector has companies with the highest average age and larger average size, in terms of revenue, among the sectors analyzed. On the other hand, the level of practices adoption is small in the sectors 181 (Garments tailoring), 193 (Manufacturing, footwear) and 264 (Manufacturing, ceramic products) and, for the chosen sample, these sectors are represented by the smaller companies.
Table 4
Descriptive Analysis of Operational Practices Adoption
CNAE
Code Industry
Outsourcin g levela
Quality
Practicesb JIT
c ISO
Standardsc
158 Manufacturing, other food products 2,59 3,34 4,9 3,7
181 Garments tailoring 2,53 2,61 2,8 0,9
193 Manufacturing, footwear 5 2,66 8,1 0
213 Manufacturing, paper or cardboard containers 4,76 3,56 8 22
251 Manufacturing, rubber articles 6,02 3,96 12,5 35,7
252 Manufacturing, plastic goods 4,16 4,12 9,5 21,6
264 Manufacturing, ceramic products 2,16 2,9 4,2 10,4
283 Forging, Stamping, metallurgy and metal-treatment serv. 4,08 4,61 12 42,7
289 Manufacturing, various metallic products 6,98 4,28 16,1 36,6
292 Manufacturing, general machinery and equipment 5,48 3,11 9,2 15,4
296 Manufacturing, other specific machinery and equipment 5,18 3,58 1,5 19,7
344 Manufacturing, automotive parts and accessories 5,86 5,22 24 55,8
361 Manufacturing, furniture 3,02 2,92 4,6 1,5
369 Manufacturing, various products 4,61 3,52 5,2 8,6
Note. Source: research results. Note: apercentage of net spent on third-party services; beight practices; cpercentage of
The first regression model presented used the dependent variable Profitability. The goal was to determine how much of the variation of the StPROFIT variable could be explained with the firm’s production variables. The results of this model can be seen in Table 5. The model explained only 6.9 percent of the variation of Profitability (StPROFIT2001) through variables Size and Service
Outsourcing Level, with size as the variable that most explained variation of StPROFIT2001. Size
positively affected profitability, while outsourcing had a negative effect on it. The other variables, representing the various operating practices, had no significant effect on the dependent variable to be selected by means of the stepwise method.
Table 5
Multiple Regression for Profitability
Variables Coefficient t-test p-value
(Constant) 0.050 2.012 0.044
LnStR2001 0.206 7.964 <0.001
StO2001 -0.131 -5.143 <0.001
Note. Source: research results.
The second regression, including dummy industry variables, and interactions of these dummies with the other independent variables explained 8.9 percent of Profitability variation. The variables that most contributed to the explanation are listed in Table 6. Note that the size variable affected industries 283 (forging, stamping, powder metallurgy and metal-treatment services) and 361 (manufacturing, furniture) differently, that is, with negative impact on industry 283 and positive for 361. In this case, for industry 283, a one-unit increase to variable LnStR2001 reduces Profitability by –0.134 (=0.210–
0.344) deviations from the industry, while in industry 361 a similar increase would cause Profitability to rise by 0.478 (=0.210+0.268) deviations. Likewise, the variable Age (StA) helped explain Profitability change in industry 252 (Manufacturing, plastic goods) with its negative effect on firm Profitability.
Table 6
Multiple Regression for Profitability with Industry Dummies and Interaction Terms
Variables Coefficient t-test p-value
(Constant) 0.049 0.00 1.000
LnStR2001 0.210 7.723 <0.001
LnStRa2001*D283 -0.344 -3.270 0.001
StO2001 -0.128 -5.047 <0.001
StA*D252 -0.162 -2.591 0.010
LnStR2001*D361 0.268 2.406 0.016
Note. Source: research results.
The second model to be tested checked for the effect of production variables on variation of the revenue growth rate, represented by the variable RevenueGR.
Revenue Growth Rate. Size remained the model’s primary explanatory variable and also had the greatest impact on RevenueGR; meanwhile, the other two operating practice variables showed negative coefficients, indicating that they were associated with lower growth and have lower explanatory power.
Table 7
Multiple Regression for Revenue Growth Rate
Variables Coefficient t-test p-value
(Constant) 0.384 17.479 <.001
LnStR2001 0.373 18.300 <0.001
StO2001 -0.125 -6.350 <0.001
StT2001 -0.075 -3.806 <0.001
ISO -0.168 -3.407 0.001
Note. Source: research results.
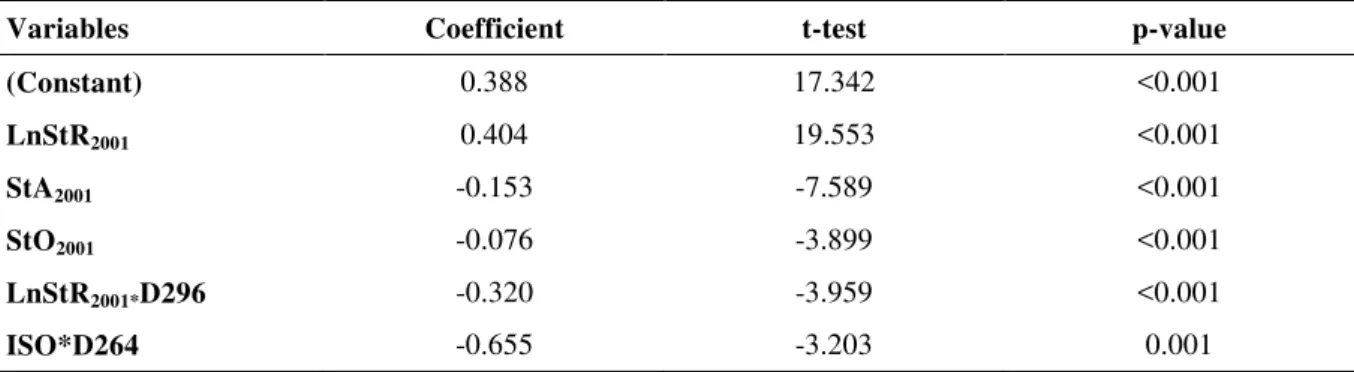
The model with industry dummies and their interaction terms for the revenue growth rate variable explained 28.6 percent of RevenueGR variation. This is an indication that the operational practices had industry-dependent effects.
Table 8 displays these results and shows that the variables Size and Age remained the most important ones. Size had a positive effect on Revenue Growth Rate, while the effect of Age was negative. The size effect, though positive, was weaker for industry 296 (Manufacturing, other specific machinery and equipment), and the age effect was positive for industry 264 (Manufacturing, ceramic products), unlike the other industries studied here.
As for operating practice variables, we can see that inclusion of the ISO variable into the regression model in Table 8 was largely due to the influence of industry (Manufacturing, ceramic products). For this industry, ISO certification had a stronger negative effect on a firm’s growth rate than in other industries. The effect of adopting quality practices appeared to be significant and positive for industry 292 (Manufacturing, general machinery and equipment), but negative for industry 181(Garments tailoring). In both cases, however, despite statistically significant coefficients (due to the large number of observations) the practical significance of the results may be questioned, and it may be more accurate to interpret the results as absence of relevant relationships between quality practices and firm’s financial performance.
Table 8
Multiple Regression for Revenue Growth Rate with Industry Dummies and Interaction Terms
Variables Coefficient t-test p-value
(Constant) 0.388 17.342 <0.001
LnStR2001 0.404 19.553 <0.001
StA2001 -0.153 -7.589 <0.001
StO2001 -0.076 -3.899 <0.001
LnStR2001*D296 -0.320 -3.959 <0.001
ISO*D264 -0.655 -3.203 0.001
Table 8 (continued)
Variables Coefficient t-test p-value
StA2001*D264 0.275 3.962 <0.001
ISO -0.154 -3.117 0.002
Q*D292 0.052 2.544 0.011
Q*D181 -0.044 -2.385 0.017
Note. Source: research results.
Conclusions and Limitations
This study explored the broad SEADE database developed from PAEP surveys done in 1996 and 2001 to find relationships between the use and intensity of operating practices such as quality management, just in time, ISO certifications, outsourcing level and firm’s financial performance. The operations management literature, with its theoretical and empirical studies, indicates the presence of a positive relationship between those practices and performance. Previous studies, however, have not been conclusive about this positive relationship.
Our results, in general terms, did not find a positive relationship between operational practices and financial performance (growth and profitability), even using a sample of 1,200 companies. These findings did not support the notion that the practices can drive superior performance, or even create competitive edge-generating competencies for organizations (Hayes & Pisano, 1996; Ketokivi & Schroeder, 2004). Several reasons can be a possible explanation for these findings. The effects can be too small to be detected even using a large sample. An alternative is that the impact of these practices in performance can be dependent on the context. The fact that we found some significant interaction terms between practices and industries points in that direction. Finally, the impact on performance may be dependent on the development of more complex capability and not simply the result of practice adoption, as suggested by other authors (Powell, 1995; Tan, Kannan & Narasimhan, 2007). These capabilities would constitute the resources that under the RBT logic could promote competitive advantage. The variables present in the PAEP survey did not allow exploring this aspect and this is a clear limitation.
The only variable showing consistent negative relationships with profitability and growth was outsourcing level. This finding leads to a reflection on the fad of outsourcing, which may not be producing the expected results and endures constant criticism (Rossetti & Choi, 2005) and empirical studies that have been equally unable to identify a direct tie between outsourcing and financial performance (Jiang, Frazier, & Prater, 2006).The remaining practices (quality management, just in time, ISO certifications) showed no significant effect, except relatively weakly and in certain specific industries. PAEP survey did not allow exploring this aspect and this is a clear limitation.
Some of the interactions between industries (represented by dummy variables) and practices proved to be significant. Although no clear pattern could be identified, this suggests that the impact of practices on performance may be dependent on context. The presence of ISO certification had a negative influence on the growth rate of industry 264 (Manufacturing, ceramic products), which may indicate a growth advantage for non-ISO certified firms in the period at hand. Other interaction terms with industry and practices inserted into the regression model for the revenue growth rate were also significant, such as quality for industries 292 (Manufacturing, general machinery and equipment) and 181 (Garments tailoring).
growth, confirming previous studies done with data from the United States and other countries (Brito & Vasconcelos, 2005, 2009).
It is also important to note several limitations of this study that may be addressed in future efforts. The first limitation, which is evident in a study such as this, concerns the use of a secondary database created for a purpose other than that of the research at hand. Venkatraman and Ramanujam (1986) also suggest using a primary data source to validate the information.
Another limitation, as noted by March and Sutton (1997) concerns the instability of the performance advantage. This limitation is valid given that the impact of independent production variables on the output variables may be reduced over time, especially as it concerns comparisons with the competition. The competitive effect of a certain production practice will be greater for early adopters and followers will not extract the same competitive advantage as more pioneering firms. The selection of a limited set of management practices available in the database is another limitation that can be overcame in future studies.
Yet another limitation lies in the absence of a historical data series year-to-year. This prevents evaluating the time needed to adopt a certain practice and limits us to telling whether or not a firm had such a practice in place in 2001. A firm that adopted the practice earlier might be able to extract more benefits than a recent adopter.
Received 5 March 2010; received in revised form 28 October 2010.
References
Barney, J. (1991). Firm resources and sustained competitive advantage. Journal of Management, 17(1), 99-120. doi: 10.1177/014920639101700108
Barney, J., & Clark, D. N. (2007). Resource-based theory. New York: Oxford.
Barrar, P., Wood, D., Jones, J., & Vedovato, M. (2002). The efficiency of accounting service provision. Business Process Management Journal, 8(3), 195-217. doi: 10.1108/14637150210428925
Bartezzaghi, E., Turco, F., & Spina, G. (1992). The impact of the JIT approach on production system performance: a survey of Italian industry. International Journal of Operations & Production Management, 12(1), 5-17. doi: 10.1108/EUM0000000001292
Brito, L. A. L., & Vasconcelos, F. C. (2005). Desempenho das empresas brasileiras: efeitos ano, ramo de negócios e firma individual [1a Edição Especial]. Revista de Administração Contemporânea, 9, 65-85. doi: 10.1590/S1415-65552005000500004
Brito, L. A. L., & Vasconcelos, F. C. (2009). The variance composition of firm growth rates. Brazilian Administration Review, 6(2), 118-136. doi: 10.1590/S1807-76922009000200004
Cho, H. J., & Pucik, V. (2005). Relationship between innovativeness, quality, growth, profitability and market value. Strategic Management Journal, 26(6), 555-575. doi: 10.1002/smj.461
Claycomb, C., Dröge, C., & Germain, R. (1999). The effect of just-in-time with customers on organizational design and performance. International Journal of Logistics Management, 10(1), 37-58. doi: 10.1108/09574099910805923
Cole, R. E. (1998). Learning from the quality movement: what did and didn't happen and why?
Flynn, B. B., Sakakibara, S., & Schroeder, R. G. (1995). Relationship between JIT and TQM: practices and performance. The Academy of Management Journal, 38(5), 1325-1360. doi: 10.2307/256860
Fullerton, R. R., Cheryl, S. M., & Fawson, C. (2003). An examination of the relationships between JIT and financial performance. Journal of Operations Management, 21(4), 383-404. doi: 10.1016/S0272-6963(03)00002-0
Gilley, K. M., & Rasheed, A. (2000). Making more by doing less: an analysis of outsourcing and its effects on firm performance. Journal of Management, 26(4), 763-790. doi: 10.1016/S0149-2063(00)00055-6
Hayes, R., & Pisano, G. (1996). Manufacturing strategy: at the intersection of two paradigm shifts.
Production and Operations Management, 5(1), 25-41. doi:
10.1111/j.1937-5956.1996.tb00383.x
Hays, D. C., Hunton, J. E., & Reck, J. P. (2000). Information systems outsourcing announcements: investigating the impact on the market value of contract-granting firms. Journal of Information Systems, 14(2), 109-125. doi: 10.2308/jis.2000.14.2.109
Heras, I., Dick, G. P. M., & Casadesús, M. (2002). ISO 9000 registration’s impact on sales and profitability: a longitudinal analysis of performance before and after accreditation. International
Journal of Quality & Reliability Management, 19(6), 774-791. doi:
10.1108/02656710210429618
Holcomb, T. R., & Hitt, M. A. (2007). Toward a model of strategic outsourcing. Journal of Operations Management, 25(2), 464-481. doi: 10.1016/j.jom.2006.05.003
Jiang, B., & Qureshi, A. (2006). Research on outsourcing results: current literature and future opportunities. Management Decision, 44(1), 44-55. doi: 10.1108/00251740610641454
Jiang, B., Frazier, G. V., & Prater, E. P. (2006). Outsourcing effects on firms operational performance: an empirical study. International Journal of Operations & Production Management, 26(12), 1280-1300. doi: 10.1108/01443570610710551
Jones, O. (2000). Innovation management as a post-modern phenomenon: the outsourcing of the pharmaceutical R&D. British Journal of Management, 11(4), 341-356. doi: 10.1111/1467-8551.00177
Joyce, W. F., Nohria, N., & Roberson, B. (2003). What really works: the 4+2 formula for sustained business success. New York: HarperBusiness.
Kaynak, H. (2003). The relationship between total quality management practices and their effects on firm performance. Journal of Operations Management, 21(4), 405-435. doi: 10.1016/S0272-6963(03)00004-4
Ketokivi, M. A., & Schroeder, R. G. (2004). Manufacturing practices, strategic fit and performance: a routine-based view. International Journal of Operations and Production Management, 24(2), 171-191. doi: 10.1108/01443570410514876
Lakatos, E. M., & Marconi, M. (1985). Fundamentos da metodologia científica. São Paulo: Atlas.
Lei, D., & Hitt, M. (1995). Strategic restructuring and outsourcing: the effect of mergers and acquisitions and LBOs on building firms skills and capabilities. Jornal of Management, 21(5), 835-859. doi: 10.1016/0149-2063(95)90043-8
Londsdale, C. (1999). Effectively managing vertical supply relationships: a risk management model for outsourcing. Supply Chain Management: an International Journal, 4(4), 176-183. doi: 10.1108/13598549910284499
March, J. G., & Sutton, R. I. (1997). Organizational performance as a dependent variable.
Organization Science, 8(6), 698-706. doi: 10.1287/orsc.8.6.698
McIvor, R. (2009). How the transaction cost and resource-based theories of the firm inform outsourcing evaluation. Journal of Operations Management, 27(1), 45-63. doi: 10.1016/j.jom.2008.03.004
Mohrman, S. A., Tenkasi, R. V., Lawler, E. E. I., & Ledford, G. E. J. (1995). Total quality management: practice and outcomes in the largest US firms. Employee Relations, 17(3), 26-41. doi: 10.1108/01425459510086866
Narasimhan, R., Swink, M., & Kim, S. W. (2005). An exploratory study of manufacturing practice and performance interrelationships: implication for capability progression. International Journal of
Operations and Production Management, 25(10), 1013-1033. doi:
10.1108/01443570510619509
Nunnally, J. C., & Bernstein, I. H. (1994). Psychrometric theory (3rd ed.). New York: McGraww-Hill.
Peteraf, M. A. (1993). The cornerstones of competitive advantage: a resource-based view. Strategic Management Journal, 14(3), 179-191. doi: 10.1002/smj.4250140303
Powell T. C. (1995). Total quality management as competitive advantage: a review and empirical study. Strategic Management Journal, 16(1), 15-37. doi: 10.1002/smj.4250160105
Prahalad, C. K., & Hamel, G. (1990). The core competence of the corporation. Harvard Business Review, 68(3), 79-81.
Rao, P., & Holt, D. (2005). Do green supply chains lead to competitiveness and economic performance? International Journal of Operations & Production Management, 25(9), 898-916. doi: 10.1108/01443570510613956
Ross, J. (1993). Total quality management: text, cases and readings. Delray Beach, FL: St. Lucie Press.
Rossetti C., & Choi, T. Y. (2005). On the dark side of strategic sourcing: experiences from the aerospace industry. Academy of Management Executive, 19(1), 46-60. doi:10.5465/AME.2005.15841951
Sale, M. P., & Inman, R. A. (2003). Survey-based comparison of performance and change in performance of firms using traditional manufacturing, JIT and TOC. International Journal of
Production Researc
Sila, I. (2007). Examining the effects of contextual factors on TQM and performance through the lens of organizational theories: an empirical study. Journal of Operations Management, 25(1), 83-109. doi: 10.1016/j.jom.2006.02.003
Slack, N., Chambers, S., & Johnston, R. (2002). Administração da produção (2a ed.). São Paulo: Atlas.
Tan, K. C., Kannan, V. R., & Narasimhan, R. (2007). The impact of operations capability on firm performance. International Journal of Production Research, 45(21), 5135-5156. doi: 10.1080/00207540600871269
Upton, D. (1998). Just-in-time and performance measurement systems. International Journal of Operations & Production Management, 18(11), 1101-1110. doi: 10.1108/01443579810231688
Venkatraman, N. N., & Ramanujam, V. (1986). Measurement of business performance in strategy research: a comparison of approaches. Academy of Management Review, 11(4), 801-814. doi:10.5465/AMR.1986.4283976.
Vuppalapati, K., Ahire, S. L., & Gupta, T. (1995). JIT and TQM: a case for joint implementation.
International Journal of Operations & Production Management, 15(5), 84-94. doi:
10.1108/01443579510083686
Williamson, O. E. (1975). Markets and hierarchies. New York: Free Press.
Williamson, O. E. (1985). The economic institutions of capitalism: firms, markets and relational contracting. New York: Free Press.