* Doutorando em Administração pela Universidade Federal de Minas Gerais. Professor do Instituto Federal de Minas Gerais, Campus Sabará. E-mail: [email protected]
** Doutorado em Administração - Aston University. Professor Adjunto da Universidade Federal de Minas Gerais. E-mail: [email protected]
*** Doutor em Economia Aplicada pela Universidade Federal de Viçosa. Professor Adjunto do Depar-tamento de Administração, Universidade Federal de Viçosa. E-mail: [email protected]
in Primary care: the case of Brazil’s southeastern cities
Lucas Maia dos Santos* Márcio Augusto Gonçalves** Marco Aurélio Marques Ferreira***
Abstract
T
his study aimed to analyze the performance of cities of Brazil’s southeastern region on primary care expenditure, from 2007 to 2010. In order to do the performance analysis we used the technical eficiency scores produced by the Data Envelopment Analysis (DEA) methodology and the Ray and Desli Malmquist Index as the quantitative metrics. Before starting the cities’ eficiency analysis, the cluster analysis was applied to group similar cities. This study proposes an analytical model of the comparative performance of 1097 cities, based on the Na -tional Primary Care Policy. The eficiency scores obtained highlights the disparities in the allocation of resources and lost in productivity through the years analyzed. This fact could be justiied due the absence of procedures of relative comparison between cities and the decentralization of public expenses in public healthcare. The results shed light on the possibility to improve the quantity of primary care services, given the current level of expenditure.Keywords: Primary Care. Performance. Public Expenditure. DEA. Malmquist Index.
Resumo
E
ste estudo teve como objetivo analisar o desempenho dos municípios da região sudeste do Brasil na alocação de recursos em atenção básica, de 2007 a 2010. A im de fazer a análise de desempenho foram usados escores de eiciência técnica da Análise Envoltória de Dados (DEA) e índice de Malmquist de Ray e Desli. Mas, antes da análise de eiciência, a análise de cluster foi aplicada para agrupar os municípios semelhantes. Assim, este estudo propõe constituir um modelo de análise do desempenho de 1097 cidades, com base na Política Nacional de Atenção Básica. Os escores de eiciência obtidos destacam as disparidades na alo -cação de recursos e o baixo desempenho dos municípios. Este fato pode ser justiicado devido ausência de procedimentos de comparação relativa entre os municípios e a descentralização dos gastos públicos na área de saúde pública. Os resultados lançam luz sobre a possibilidade de aumento da oferta de serviços em atenção básica, dado o nível atual de recursos alocados.Introduction
I
n order for SUS to become effective, primary care needs to be strengthened. It is being capable of solving around 80% of the health needs and problems, also highlighting the importance of prevention and immunization in this care level. (BRASIL, 2007; ELIAS et al., 2006)However, in Brazil there are still citizens which do not possess access to primary care service, for various reasons, among them the low relation between supply and demand for these services. The limitation of public resources may be considered as a restricting factor to the increase in the offer of healthcare services, requiring that the public administrator allocate eficiently his resources instead of seeking the increase of budget sources. (FLEURY; BARIS, 2001; FLEURY; BAHIA, AMARANTE, 2007)
According to the Brasil (2008) the results which Brazil has obtained in the healthcare area are below the expected results considering the invested amount of money. Little by little, the public policy makers begin to admit that money may not have been well invested. Among the main possible solutions for the problem we can state: increase the amount of inancial resources – probably unviable due to the re -source limitation – or increase the eficiency in re-source allocation.
Focusing on the above highlighted problems and seen the increasing of ef -iciency as a feasible solution for the improvement of the results which Brazil has obtained in healthcare area, this study was carried out to answer the following ques -tion: what is the comparative performance of cities in the southeastern region of Brazil in primary care expenditure? According to Selden and Sowa (2004) and Scott and Davis (2007), the idea of performance is focused, typically, in the outputs and outcomes of programs or policies. According to Farrel (1957) and Charnes, Cooper and Rhodes (1978) technical eficiency is the ability to produce more outputs with a given amount of inputs and according Scott and Davis (2007) could be applied as a performance assessments.
It is justiied that the evaluation of eficiency in public resources allocation may serve as an instrument to support public managers’ decision making as well as identifying benchmark cities so that the ineficient cities may looking for the best practices from eficient cities. In performance analysis, according to Greiling (2006), benchmarking is designed to make learning easier as a continuum and systematic process of measuring products, services and practices aiming at correcting failures and improving results. This idea of a comparison between units of analysis by rela -tive eficiency scores is found in the performance analysis literature. (BEHN, 2003; GREILING, 2006; SELDEN; SOWA, 2004; SCOTT; DAVIS, 2007)
Given the problems proposed and the justiications for conducting this study, this study was carried out to analyze the comparative performance of cities in the southeastern region of Brazil in primary care expenditure, from 2007 to 2010. More speciically, we separated the groups of the most similar cities according to char -acteristics which could have inluence on expenditure eficiency scores and then applied the proposed eficiency model by Data Envelopment Analysis and Ray and Desli Malmquist Index.
The research and data collection strategy
From the population of 1668 cities in Southeastern region of Brazil we chose only cities which had at least one Family Health Team – the group of physician, nurses, nurse assistants and other professionals - classiied as the main strategy according the National Primary Care Policy. Afterwards, after an exploratory analysis of the data, we excluded from the sample those with inconsistent variables and with the absence of some observation for one or more analyzed years (2007-2010). It was excluded 570 cities because of that.
The inal sample was comprised of about 70% of the cities in Minas Gerais, 60% of the cities in the State of Espírito Santo, 50% of the cities in Rio de Janeiro and 52% of the cities in São Paulo. In some cases, existing secondary data create an opportunity for evaluative and simpliied comparisons. The performance mea -sures may contribute not only to indicate the organizations are making mistakes but also to indicate when they are doing well. Performance measures provide jus -tiication for the existence of the organizations. (BEHN, 2003; GREILING, 2006; HALACHMI, 2005)
For data collection and analysis, the National Primary Care Policy from 2006 was established as the reference public policy. By this deinition, the analysis period was from 2007 - the irst year of this policy - to 2010, due to this being the last year with available data in the researched databanks. All of these variables were collected during the period from July to September 2011.
Analysis procedures
In order to do the performance analysis as the quantitative measure we used in this study the technical eficiency scores produced by the Data Envelopment Anal -ysis (DEA) methodology. But, before starting the cities’ eficiency anal-ysis the cluster analysis was applied to group similar cities according to Short and others (2007) and Ferguson, Deephouse and Ferguson (2000). It becomes necessary that the compared units were similar in order to avoid spurious comparisons and group the most similar cities and separating the most distinct. Therefore, it will be possible to compare similar measures according to the discussion which approaches the concepts of benchmarking in the literature. (BEHN, 2003; GREILING, 2006)
In the cluster analysis we used the non-hierarchical k-means method quoted in Maroco (2003) and Hairand others (2005) for partitioning the city groups. This method was utilized due to the fact that it is an advantage in relation to the hier-archical methods because to the ease which it can be applied to very sizable data matrixes and there is no need to calculate and store a new dissimilarity matrix in each step of the algorithm. According to Maroco (2003) the probability of a wrong classiication of a given subject in a given cluster is lower in the non-hierarchical methods. (MAROCO, 2003)
According to Sugar and James (2003), a fundamental problem in cluster anal -ysis is to determine the best number of groups. In order to determine this number that shall be used in the study we employed the Calinski and Harabaz index whose equations are in Milligan and Cooper (1985) and Sugar and James (2003). According to Milligan and Cooper (1985), the Calinski and Harabaz index is considered a robust index for deining the number of clusters.
Equation 1
∑
∑
∑
∑
= = = = ∀ ≥ = = ≥ = ≤ n j j n j j n j i VRS rj j n j i ij j VRS j s r y y m i x x Max 1 1 1 , 0 1 , 0 , 0 1 ,..., 2 , 1 ,..., 2 , 1 , : Subject to l l q l l qIn the Equation 1 the Decision making units (DMU) represented by the cities use m inputs, s products; j is associated with the analyzed DMU0 and n corresponds to the total number of DMU; xij is the consumed quantity of the input i (i = 1,2, ..., m) by DMUj; yrj is the quantity produced of the product r (r = 1,2,3 …s) for DMUj;
j
l
is the weight of the composition of the analyzed DMU0 virtual (projection on the eficient frontier); VRSq
is the eficiency score output-oriented supposing variable return to scale.The output orientation was applied because the objective of the cities must be to increase the primary care services production and not to reduce the budget allocat -ed in the ield. Also, quot-ed authors have discuss-ed the scarcity of resources for this sector, indicating that the increase in expenditure eficiency is necessary. (FLEURY; BARIS, 2001; WORLD BANK, 2007; BRASIL, 2008)
The Data Envelopment Analysis is able to classify the analyzed units by indexes from 0 to 100% through mathematical programming. So it was possible to rank the cities and compare them. The structures of the classic models are found in Charnes, Cooper and Rhodes (1978), Banker, Cooper and Rhodes (1984) and Banker and Thrall (1992) that show the classic models in Data Envelopment Analysis.
The supposition of variable return to scale was tested by the Theorem 2 of Banker (1996) quoted by Ray (2004) which has shown itself to be a consistent analysis. After the application of the above mentioned test, comparing the scores according to Ray (2004), we did not notice a prevalence of only one type of return to scale. In this case, the quoted authors recommend the assumption of variable returns to scale (VRS).
In this study we have a panel of eficiency scores for verifying both changes in the productivity and difference in eficiency scores over the years. According to Banker et al. (2005) the Malmquist index was proposed by Caves, Christensen and Diewet (1982) with the objective of measuring changes in productivity between two periods of time by the distance between a DMU and the frontier of production for each period. This calculation to measure the productivity changes are interesting in a context in which multiple inputs and outputs, as well as longitudinal dependent panel coexist.
Equation 2 2 / 1 1 1 1 1 1 1 1 1 1 1 1 1 1 1 1 2 1 1 1 1 1 1 1
)
,
(
)
,
(
)
,
(
)
,
(
)
,
(
)
,
(
)
,
(
)
,
(
)
,
(
)
,
(
)
,
(
)
,
(
)
,
(
)
,
(
Index
Malmquist
(1997)
Desli
and
Ray
×
×
×
×
×
=
=
+ + + + + + + + + + + + + + + + + + + + + t t t VRS t t t CRS t t t VRS t t t CRS t t t VRS t t t CRS t t t VRS t t t CRS t t t VRS t t t VRS t t t VRS t t t VRS t t t VRS t t t VRSy
x
D
y
x
D
y
x
D
y
x
D
y
x
D
y
x
D
y
x
D
y
x
D
y
x
D
y
x
D
y
x
D
y
x
D
y
x
D
y
x
D
Where the ratio outside the brackets
(
,
)
)
,
(
1 11 t t t VRS t t t VRS
y
x
D
y
x
D
+ + +indicates the change in technical eficiency, i.e., how far the DMU is from the maximum production ob -served, between year t and t+1. The geometric mean of two ratios in brackets
2 1 1 1 1 1 1 1
)
,
(
)
,
(
)
,
(
)
,
(
×
+ + + + + + t t t VRS t t t VRS t t t VRS t t t VRSy
x
D
y
x
D
y
x
D
y
x
D
captures the shift in the production frontier. Note
that t
(
t,
t)
VRS
x
y
D
=1 happens if and only if(
x
t,
y
t)
is in production frontier. According to Farrell (1957) that occurs when production is technically eficient.)
,
(
t+1 t+1t
VRS
x
y
D
is a function of maximum ratio expansion of output vectory
t+1given the inputs
x
t+1practicable in relation to the frontier of period t.D
VRSt+1(
x
t,
y
t)
is a function of maximum ratio expansion of output vector
y
t given the inputsx
tpracticable regarding the boundary of period t+1. E t+1
(
t+1,
t+1)
VRS
x
y
D
is a function ofmaximum expansion ratio of the output vector of
y
t+1 given the inputsx
t+1 practicable regarding the frontier of period t+1.In the situation of
x
t=
x
t+1andy
t=
y
t+1 in which there has been no change in the inputs and outputs through the periods, the signal of productivity index does notchange and
Malmquist
index
=
1
. The CRS and VRS symbols are the abbreviationof constant returns to scale and variable returns to scale, respectively.
According Fare and others (1994) productivity gain is found when the Malm -quist index is greater than 1. The deterioration of performance over time is associated with the Malmquist index less than 1. To calculate productivity change among DMUs is necessary to calculate the eight different linear programming problems:
D
t(
x
t,
y
t)
,)
,
(
1 t t
t
y
x
D
+ ,D
t(
x
t+1,
y
t+1)
andD
t+1(
x
t+1,
y
t+1)
all assuming constant returns to scale and variable returns to scale.Analytical model for performance evaluation in
Primary Care resource allocation
This study agrees with Elias and others (2006) and Brasil (2008) when they discuss that the analysis of health must take into consideration the “Social Space”, considering that society has different access to the consumption of goods, including health services. In this discussion we include the fact that the characteristics of the analyzed regions such as the demographic and epidemiologic proile should be taken into consideration.
The grouping of similar cities make possible for a given ineficient city in its expenditure to be compared to other cities with similar characteristics, or the most similar possible. Another advantage of obtaining groups of cities with the most similar characteristics possible is the fact that this comparison offers better benchmarking for the ineficient cities.
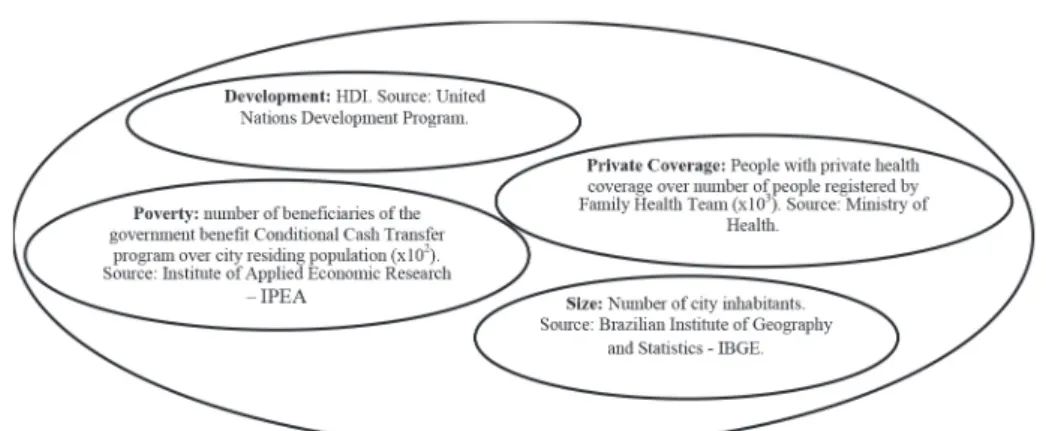
What will deine how similar the groups are internally are the variables inserted to characterize them. In this study, the model for ranking the cities was built from four dimensions considered to be important for primary care in health and may have impact on the expenditure of distinct cities: private coverage, development, size and poverty. Figure 1 describes the four dimensions.
Private health coverage was considered the most important dimension for the separation between the groups. In order to explain the importance of this dimension we quote the arguments of Wibulpolprasert, Tangcharoensathien and Kanchanachitra (2008) who state that most of the population in development countries do not have any access to private health services, which makes the access to
health, immunization and medicine more dificult.
Figure 1 – Dimensions for characterizing the cities
Source: Elaborated by the author.
In this direction, individuals with private health coverage may need less the services offered by Brazilian Uniied Health System than individuals who do not have any access to private services. The arguments of Ibañez and others (2006), Henrique and Calvo (2009) and Machado, Lima and Viana (2008) converge towards the ex -istence of a relation between poverty and access to health services. The individuals who do not possess any private coverage will need to refer themselves to the public primary care services.
Therefore, the irst group – labeled group A - was comprised by cities with 10% or less of the population registered by the Family Health Team covered by the private services. The other group – labeled group B - was formed by the cities with more than 10% of the population with private coverage. It is considered that the irst group has a higher dependency on public primary care services than the second one. After the sep -aration approximately 56% of the cities were put in group A and 44% were in group B. Between the four dimensions inserted for characterizing the groups, poverty was represented by the proportion of population beneited by the Conditional Cash Trans -fer program called “Bolsa Família”. These are people who seek public health services according Ibañez and others (2006), Conill (2008) and Henrique and Calvo (2009). These quoted authors consider that this part of the population is found in areas with higher nutrition risk, lower education, living and basic sanitation conditions and which will depend with a higher frequency on the public health services.
Size was another variable to be considered. This is because according to Hen -rique and Calvo (2009) and Conill (2008) the implantation of primary care programs were predominant in smaller cities, in which high complexity care did not fulill the population’s needs. So, we expect that cities with a smaller population size will have a more developed primary care system than those in bigger cities.
The last dimension to be considered was development represented by the Human Development Index (HDI). This variable was chosen because it took into consideration, in composing the index, not only GDP, but longevity and education. This variable al -lows for the identiication of cities with a more structured health system highlighting the relation between longevity and health. It is necessary to state that education is an important component for prevention and promotion of health (BRASIL. Ministério da Saúde, 2007; ELIAS et al., 2006; IBAÑEZ, 2006)
After the deinition of the clusters we inserted some more variables available by Ministry of Health for additional characterization the cities. These variables are related to the cities’ infrastructures as the following ones:
· Proportion of houses with water piping (x102); · Proportion of houses with garbage collection (x102); · Proportion of houses with sewage piping (x102); · Proportion of houses made of bricks (x102); · Proportion of houses which have electricity (x102).
According to the World Bank (2007) these variables were used because other factors such as the access to drinking water and sanitation may also have an inluence on comparisons between expenditures and results. Wibulpolprasert and others (2008) afirm that apart from the reduction in child mortality and immunization for achieving the objectives of primary care it is necessary the access to drinking water and basic sanitation.
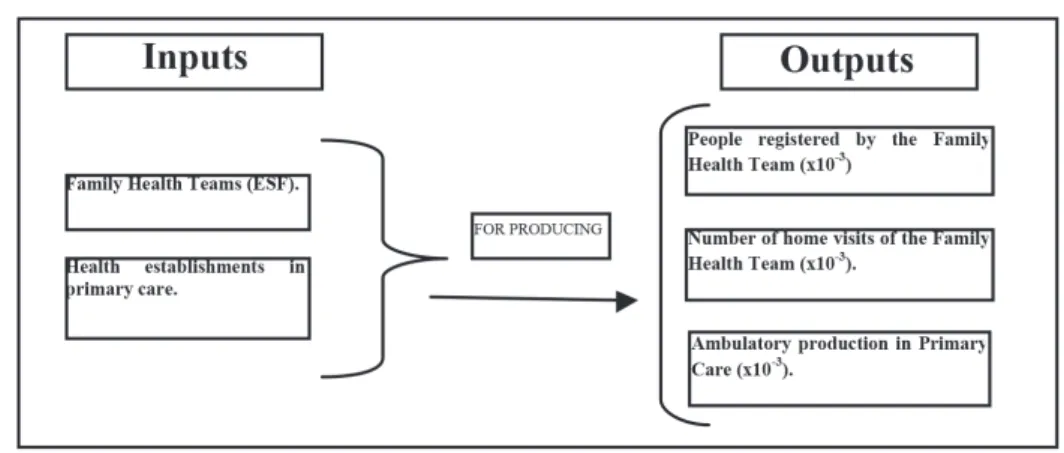
It was possible to perform the relative technical eficiency analysis after group the similar cities. According to Brasil (2007) primary care resources should be allo -cated for paying the Family Health Team and maintaining the primary health units. In this direction, the allocation of resources for the primary care will be represented by the number of Family Health Teams and number of health establishments. These two variables according to National Primary Care Policy represent the primary care main expenditure i.e resource allocation.
Relating to the justiication for formulating this model we may quote as a refer -ence the work of Starield (1998) which characterized primary care as the “entrance door” which gives accessibility to population health needs. So, the irst output was characterized by the number of people registered by the Family Health Team. Accord -ing to Henrique and Calvo (2009), this variable is important for resource allocation because primary care coverage is just around a third of the country’s population. Also, according to Elias and others (2006) and Brasil (2007) the population registration has the importance of enabling the program to know about morbidity characteristics and thus act towards prevention and promotion of health.
Figure 2 – The model of technical eficiency in expenditure on primary care
Source: elaborated by the authors.
According to Brasil (2007) at least the Health Family Team are comprised of a doctor, a nurse, a nursing assistant and community health agents. The Health Family Team are responsible for maintaining the family and individual records updated and using the data for analyzing the health situation taking into consideration the social, economical, cultural, demographic and epidemiologic characteristics of the territory.
Starield (1998) and Brasil (2007) state that the primary care evaluation has to encompass the regular use of the primary care services which is represented by the number of home visits by the Health Family team. Also, Starield (1998) afirms that primary care should supply the minimum range of adequate services to the population which is represented by the ambulatory production in primary care. In this production we include the primary care procedures performed according to the Table of Procedures, Medicine, Orthesis, Prosthetics and Special Material of Brazilian Uniied Health System.
Analysis of the results
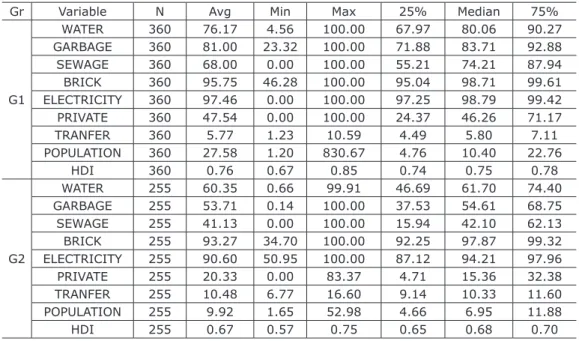
In the division of the city groups for the cluster analysis, we labeled as Group A the one with the lower private health coverage, i.e, cities with less than 10% of the population with private coverage. Table 1 shows the division of Group A in two groups of cities as follow: Group 1 and Group 2. As previously mentioned, in the tables we can ind the results of the tests performed for choosing and differentiating the groups.
Comparing groups we can afirm that, in general, Group 2, shown in Table 1, presented lower averages for all the variables used to rank them, except for proportion of the population covered by the Conditional Cash Transfer program.
We observe that Group 2 was formed by cities with at most 53 thousand inhab -itants, while Group 1 has cities with up to approximately 830 thousand inhabitants. Analyzing the quartiles, 75% of the cities in Group 1 have less than 23 thousand inhabitants while in Group 2 there are less than 12 thousand.
We highlight that these differences do not imply that in Group 2 there will be only smaller cities and in Group 1 only the bigger cities. As we inserted 4 dimensions in the cluster analysis, it is possible to have, in a same group, bigger and smaller cities which are then similar by the other dimensions.
Table 1 Descriptive Statistics – Group A split in Group 1 and Group 2*
Gr Variable N Avg Min Max 25% Median 75%
G1
WATER 360 76.17 4.56 100.00 67.97 80.06 90.27
GARBAGE 360 81.00 23.32 100.00 71.88 83.71 92.88
SEWAGE 360 68.00 0.00 100.00 55.21 74.21 87.94
BRICK 360 95.75 46.28 100.00 95.04 98.71 99.61
ELECTRICITY 360 97.46 0.00 100.00 97.25 98.79 99.42
PRIVATE 360 47.54 0.00 100.00 24.37 46.26 71.17
TRANFER 360 5.77 1.23 10.59 4.49 5.80 7.11
POPULATION 360 27.58 1.20 830.67 4.76 10.40 22.76
HDI 360 0.76 0.67 0.85 0.74 0.75 0.78
G2
WATER 255 60.35 0.66 99.91 46.69 61.70 74.40
GARBAGE 255 53.71 0.14 100.00 37.53 54.61 68.75
SEWAGE 255 41.13 0.00 100.00 15.94 42.10 62.13
BRICK 255 93.27 34.70 100.00 92.25 97.87 99.32
ELECTRICITY 255 90.60 50.95 100.00 87.12 94.21 97.96
PRIVATE 255 20.33 0.00 83.37 4.71 15.36 32.38
TRANFER 255 10.48 6.77 16.60 9.14 10.33 11.60
POPULATION 255 9.92 1.65 52.98 4.66 6.95 11.88
HDI 255 0.67 0.57 0.75 0.65 0.68 0.70
Variables: WATER – proportion of houses with water piping (x102); GARBAGE – proportion
of cities with garbage collection (x102); SEWAGE – proportion of houses with sewage piping
(x102); BRICK – proportion of houses made of bricks (x102); ELECTRICITY – proportion of
houses which have electricity (x102); PRIVATE – proportion of population covered by private
healthcare assistance (x10-3); TRANSFER – proportion of population beneited by the “Con
-ditional Cash Transfer” program (x102); POPULATION – population living in the city (x10-3);
HDI – Human Development index; Gr – group.
Tests results: highest pseudo-F of Calinski and Harabaz: 362.71; p-value<0.01 for uni
-variate normality asymmetry and kurtosis test and bi-variate and multi-variate normality of
Doornik-Hansen; p-value<0.01 for differences between the groups G1 and G2 by the Krus
-kal-Wallis non-parametric test.
Source: research results.
Regarding the cities’ infrastructure and basic sanitation, Group 1 has higher water network coverage for the houses (76% versus 60% of Group 2), higher garbage collection (81% versus 54% of Group 2), sewage piping (68% versus 41% of Group 2), brick houses (96% versus 93% of Group 2) and electricity coverage (97% versus 90% of Group 2). These values indicate a higher basic sanitation and infrastructure coverage for the cities in Group 1, when comparing to Group 2.
Due to the opposing characteristics observed in the groups, it was expected that because of the higher averages attained for infrastructure coverage and the lower ones for poverty, Group 1 would show a higher HDI average. Therefore, we found an average of the index of 0.76 versus Group 2 which presented an average index of 0.67.
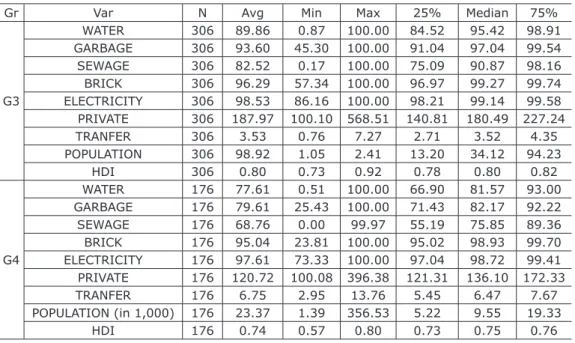
About the splitting of Group B, according to the pseudo-F criteria, we should choose the solution comprised by 5 clusters, with the highest value of 276.84 for a pseudo-F, due to them being more distinct. However, when analyzing the amount of cities in each group, we noticed that one of them was formed by only 2 cities. These were the cities of São Paulo and Rio de Janeiro. Knowing the characteristics of these cities as the biggest cities and the most important inancial centers, it was expected that these cities would be grouped separately, for a better distinction among the groups. We opted, then, for considering these two as outliers in the study and taking them out of the analyses due to their distinct characteristics when comparing to other cities.
With the exclusion of the two cities a new cluster analysis was performed and, as we can see in Table 2, the highest Calinski Harabaz pseudo-F value of 314.02 was shown to be the best division with two groups.
Group B was partitioned into Groups 3 and 4 after the Cluster analysis. Ana -lyzing the descriptive statistics of the variables which integrate the groups, we may notice that Group 3 has a higher average for the infrastructure variables such as water piping coverage (90% versus 78%), garbage collection (94% versus 80%), sewage (83% versus 69%), brick housing (96% versus 95%) and electric energy (99% versus 57%). The quartile analysis also shows that most cities in Group 3 have higher values observed for the variables of infrastructure and sanitation.
As for the private coverage, Group 3 has the cities with higher private coverage average (19% versus 13%) as the observation shows. Apart from having a higher private health coverage than Group 4, this group has a lower number of people de -pendent on Conditional Cash Transfer program (4% versus 7%).
Regarding size, Group 3 hasw a higher average population and a higher range than Group 4. Group 3 has an average 98,929 inhabitants versus 23,369 inhabitants of Group 4. Analyzing the quartiles, 75% of the cities in Group 3 have less than 95 thousand inhabitants, while this value is less than 20 thousand inhabitants for Group 4.
Table 2 Descriptive Analysis – Group B split in Groups 3 and 4*
Gr Var N Avg Min Max 25% Median 75%
G3
WATER 306 89.86 0.87 100.00 84.52 95.42 98.91
GARBAGE 306 93.60 45.30 100.00 91.04 97.04 99.54
SEWAGE 306 82.52 0.17 100.00 75.09 90.87 98.16
BRICK 306 96.29 57.34 100.00 96.97 99.27 99.74
ELECTRICITY 306 98.53 86.16 100.00 98.21 99.14 99.58
PRIVATE 306 187.97 100.10 568.51 140.81 180.49 227.24
TRANFER 306 3.53 0.76 7.27 2.71 3.52 4.35
POPULATION 306 98.92 1.05 2.41 13.20 34.12 94.23
HDI 306 0.80 0.73 0.92 0.78 0.80 0.82
G4
WATER 176 77.61 0.51 100.00 66.90 81.57 93.00
GARBAGE 176 79.61 25.43 100.00 71.43 82.17 92.22
SEWAGE 176 68.76 0.00 99.97 55.19 75.85 89.36
BRICK 176 95.04 23.81 100.00 95.02 98.93 99.70
ELECTRICITY 176 97.61 73.33 100.00 97.04 98.72 99.41
PRIVATE 176 120.72 100.08 396.38 121.31 136.10 172.33
TRANFER 176 6.75 2.95 13.76 5.45 6.47 7.67
POPULATION (in 1,000) 176 23.37 1.39 356.53 5.22 9.55 19.33
Variables: WATER – proportion of houses with water piping (x102); GARBAGE – proportion
of cities with garbage collection (x102); SEWAGE – proportion of houses with sewage piping
(x102); BRICK – proportion of houses made of bricks (x102); ELECTRICITY – proportion of
houses which have electricity (x102); PRIVATE – proportion of population covered by private
healthcare assistance (x103); TRANSFER – proportion of population beneited by the “Condi
-tional Cash Transfer” program (x102); POPULATION – population living in the city (x10-3); HDI
– Human Development index; Gr – group.
Tests results: highest pseudo-F of Calinski and Harabaz: 314.02; p-value<0.01 for uni
-variate normality asymmetry and kurtosis test and bi-variate and multi-variate normality of
Doornik-Hansen; p-value<0.01 for differences between the groups G3 and G4 by the Krus
-kal-Wallis non-parametric test.
Source: research results.
It was possible to see that, for the analyzed dimensions, groups 1, 2, 3 and 4 were formed with cities of different sizes, but similar by other dimensions. Despite this fact, Group 2, with the lowest private coverage has the cities with the lowest population and, by analyzing the quartiles, 75% of these have less than 12 thousand inhabitants. This group also showed the smallest averages for the other variables, indicating the presence of the smallest cities and also the poorest of the sample.
Group 1 and Group 4 have similar characteristics, except for the private cov -erage percentage. While Group 1 has 75% of the cities with less than 23 thousand inhabitants, Group 4 has 75% of the cities with less than 20 thousand inhabitants. As to development, they are close in HDI indexes, Group 1 having an HDI index average of 0.76 and Group 4 has 0.74.
Group 3 showed itself to be opposed to Group 2, presenting the highest averages for variables analyzed. This group may be considered as the one formed by the big -gest cities in the sample and, at the same time, being in average the most developed. In general, the 4 groups presented the best possible distinction for the four proposed dimensions which could have inluence over the expenditure eficiency in primary care. The formation of these groups will enable to perform the analysis of technical eficiency to identify better benchmark cities.
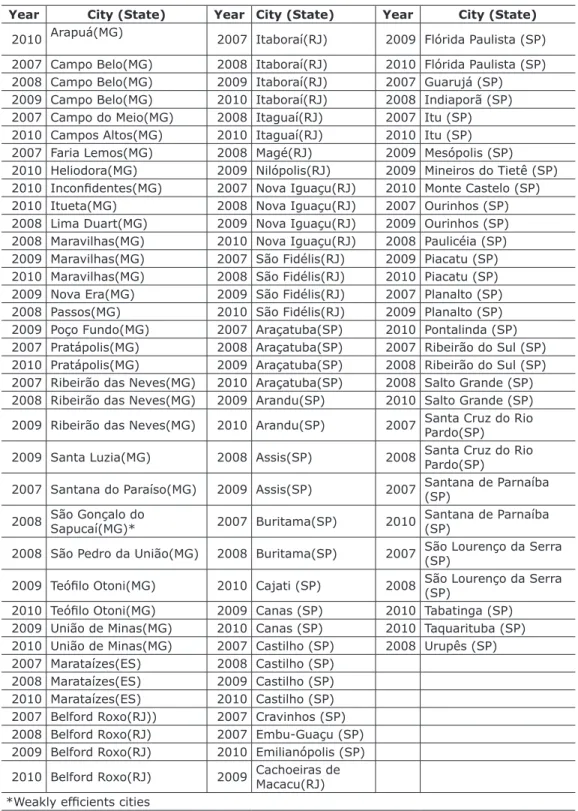
Placing the groups in an imaginary line which measures the dimensions stated for ranking the cities, we may say that Groups 2 and 3 are at the extremities of this imaginary line, while Groups 1 and 4 are in intermediate positions. The list of eficient cities by groups are available in the appendix of this study after the references.
Technical efficiency analysis
The descriptive statistics of technical eficiency in allocating primary care resources for Group 1 are set out in Table 3 through the four years. We may notice that the average eficiency of resource allocation was, respectively and approximately, 58%, 59%, 65% and 62% from 2007 to 2010. Analyzing the quartiles of the technical eficiency scores we can observe that in all years 75% of the cities had eficiency scores lower to 75% approximately. As to the inferior quartile, 80% of the cities have indexes higher than 44%. Relatively, we may say that these results are far from 100% eficiency.
Table 3 - Technical eficiency and productivity changing for Group 1
Eficiency Malmquist
Year Obs Avg Min Max 25% Median 75% Avg 25% Median 75%
2007 360 57.68 18.95 100.00 44.59 54.84 66.06 - - -
-2008 360 59.34 20.03 100.00 44.98 56.33 70.16 0,99 0,90 0,99* 1,06
2009 360 65.11 19.70 100.00 52.95 64.20 75.53 0,99 0,90 0,98* 1,05
2010 360 62.39 22.68 100.00 48.74 58.37 73.56 1,01 0,90 1,00 1,07
Obs – Observations; Min – Minimum; Max – Maximum; Avg – average
Observations: p-value<0.05 for univariate normality asymmetry and kurtosis test and bivar
-iate and multivar-iate normality of Doornik-Hansen; * signiicant at 5% by the nonparametric Wilcoxon test for the theoretical value of the median equal to 1.
Source: research results.
About the differences in eficiency through the years was not possible to verify signiicant changes in productivity (Malmquist) in the range 2009-2010. For the other years, it can be inferred that the cities had Malmquist indexes different from 1 (one). From Table 2 it can be seen that more than half of the cities in Group 1 showed a lost in productivity in the ranges of 2007-2008 and 2008-2009. In the interval 2009-2010 there were no signiicant changes. According to the average there was a loss of 1% in productivity in the range from 2007 to 2008 and the same amount for 2008-2009.
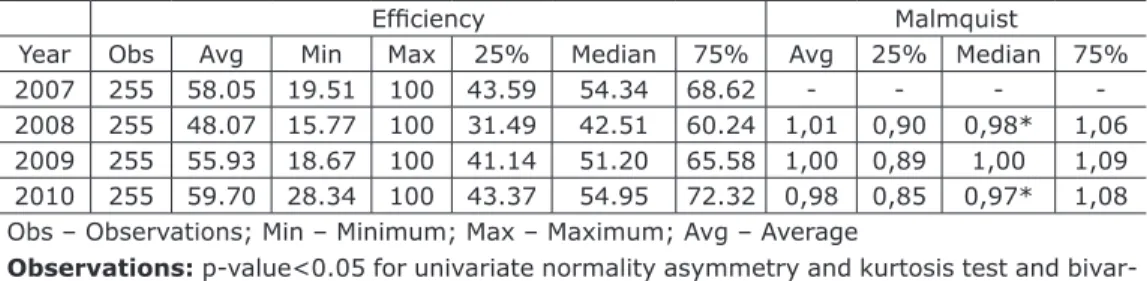
Group 2, formed by 255 cities, forms Group A of cities with lower coverage of private health insurance. The technical eficiency scores and scale of this group are presented in Table 4.
For the respective analyzed years, the average technical eficiency scores were, approximately, 58%, 48%, 56% and 60%. We may see by the scores’ descriptive statistics a considerable range for eficiency which has a minimum of 20% for year 2007; approximately 16% for year 2008; 28% for year 2009; 29% for year 2010. Similar ranges were observed when analyzing Group 1, reinforcing the hypothesis that the analyzed cities are different in primary care expenditure eficiency. The eficiency of the cities are low when we analyze that 75% of the sample have eficiency scores below 73% between the four years analyzed. If we analyze only year 2008, this value falls to 60%.
Looking at Table 4 we could see that most cities in Group 2 showed lost in productivity in the range 2007-2008 and 2009-2010. On average there was a gain in productivity by 1% from 2007 to 2008 and an average reduction of 2% in 2009-2010. Even with the average increase in the interval 2007-2008, most municipalities have reduced productivity as seen in quartiles.
Table 4 Technical eficiency and productivity changing for Group 2
Eficiency Malmquist
Year Obs Avg Min Max 25% Median 75% Avg 25% Median 75%
2007 255 58.05 19.51 100 43.59 54.34 68.62 - - -
-2008 255 48.07 15.77 100 31.49 42.51 60.24 1,01 0,90 0,98* 1,06
2009 255 55.93 18.67 100 41.14 51.20 65.58 1,00 0,89 1,00 1,09
2010 255 59.70 28.34 100 43.37 54.95 72.32 0,98 0,85 0,97* 1,08
Obs – Observations; Min – Minimum; Max – Maximum; Avg – Average
Observations: p-value<0.05 for univariate normality asymmetry and kurtosis test and bivar
-iate and multivar-iate normality of Doornik-Hansen; * signiicant at 5% by the nonparametric Wilcoxon test for the theoretical value of the median equal to 1.
Group 3, formed by 306 cities, has its eficiency scores presented in Table 5. As we can observe, the technical eficiency scores were, approximately, 61%, 54%, 60% and 60% for the years analyzed. Regarding range, this group shows cities with lower eficiency scores, namely 15% for 2007 and 14% for 2008.
Table 5 Technical eficiency and productivity changing for Group 3
Eficiency Productivity changing
Year Obs Avg Min Max 25% Median 75% Avg 25% Median 75% 2007 306 61.64 15.41 100 46.80 58.67 74.11 - - -
-2008 306 54.14 13.87 100 38.60 48.86 65.48 1,04 0,89 0,99 1,10
2009 306 59.53 24.22 100 42.92 54.46 74.76 1,01 0,89 0,98* 1,05
2010 306 60.06 19.64 100 43.96 56.73 72.38 0,99 0,86 0,97* 1,05
Obs – Observations; Min – Minimum; Max – Maximum; Avg – Average
Observations: p-value<0.05 for univariate normality asymmetry and kurtosis test and bivar
-iate and multivar-iate normality of Doornik-Hansen; * signiicant at 5% by the nonparametric Wilcoxon test for the theoretical value of the median equal to 1.
Source: research results.
As can be seen in Table 5, there was a lost in the productivity for most cities. In Group 3, from the irst to the second year (2007-2008) no signiicant change in productivity was found. In the rest of the intervals analyzed, it was observed that most cities lost expenditure productivity in primary care, although the averaged gain of 1% from 2008 to 2009.
We can observe through the descriptive statistics that 50% of the cities have eficiency scores below 60% over all the years analyzed. Thus, we expect a higher percentage increase in the outputs generated by these cities so that they may improve technical eficiency.
In Table 6 we have available the eficiency scores for Group 4, formed by 176 cities. The average eficiency found was of 65%, 70%, 67% and 50%, respectively, for the years analyzed. Technical eficiency for the year 2010 was inferior to the other years, contrary to the averages of years 2007 to 2009. By analyzing the quartiles, for the year of 2010 it is possible to infer on the presence of cities with low scores for the year of 2010. Again Table 6 shows that most cities lost expenditure productivity. In other years there was no signiicant change in the median productivity.
Table 6 Technical eficiency and productivity changing for Group 4
Eficiency Productivity changing
Year Obs Avg Min Max 25% Median 75% Avg 25% Median 75%
2007 176 65.42 30.52 100.00 51.95 62.48 76.59 - - -
-2008 176 69.76 31.84 100.00 54.89 68.26 82.02 1,02 0,94 0,99 1,03
2009 176 67.33 15.63 100.00 53.36 64.31 79.73 1,03 0,96 1,01 1,05
2010 176 49.58 10.34 100.00 29.14 42.67 62.78 1,01 0,86 0,98* 1,05
Obs – Observations; Min – Minimum; Max – Maximum; Avg - Average
Observations: p-value<0.05 for univariate normality asymmetry and kurtosis test and bivar
-iate and multivar-iate normality of Doornik-Hansen; * signiicant at 5% by the nonparametric Wilcoxon test for the theoretical value of the median equal to 1.
Analyzing the quartiles, we notice that 75% of the cities have eficiency indexes above 50%, except for year 2010. In the same direction, except for the year of 2010, 75% of the analyzed cities have eficiency scores below 75%.
Overall, it can be inferred that most of the cities analyzed showed lost in produc -tivity in primary care expenditure over the years analyzed. This result can be inferred by analyzing median of Malmquist Index of Ray and Desly (1997). It may be possible that the reduction of this productivity is related to stabilization of Primary Care National Policy since the early years there may be greater effort by governments to promote policy and this effort would be reduced over the year. This is a hypothesis not tested in this study and it is not possible to tell if this is the cause of most lost in productivity.
The analysis posted here meet the performance studies, such as Behn (2003) and Greiling (2006) who claim that the performance measures that diverge from the expected can create opportunity for learning and that these measures may suggest topics for research.
Conclusions
This study was developed aiming at being utilized by the city managers and researchers as an instrument for supporting the decision making, so that the ineficient cities can look for their benchmarks (100% eficient cities) of the best public resource allocation practices seeking to increase the primary care services offer for the popu-lation. We have attached the list of eficient cities in the appendix of this study that could offer more services in primary care with the same level of resource allocation. One of this study’s main contributions was the proposal of the analytic model of performance in primary care expenditures. This model take in account the main variables described by literature. Furthermore, this study took into consideration a longitudinal analysis which is not taken into consideration in most studies which use eficiency indexes in Brazil.
Analyzing the most similar possible cities, in four different groups, the eficien -cy scores evidenced the disparities in resource allocation in the southeastern region because of the differences in the eficiency scores, a fact which could be justiied by their autonomy in allocating their resources and the absence of relative comparison procedures between them for these expenditures. The 1988 Federal Constitution gave attributions to municipalities and states besides the federal government by the decen -tralization process in the public management. This study proposes a model to solve this problem of a lack of relative comparisons. According this study there is space for increase the primary care service offer.
As a proposal for a performance analysis, this model should be applied con -tinuously, so that it may be justiied as a performance study. This study is the initial proposal of a model so that the measuring is not restricted only the period of this study. The building of reference units or benchmarks may be an instrument to direct the decision-making of city managers, as well as other higher public management levels.
It was important to incorporate all possible cities from southeast region to create a practical frontier. We indicate not exclude or look for outlier in these frontiers assuming that all cities are under the same conditions to manage his resources because of the decentralization of primary care resource allocation. That is why we did not apply the super-eficiency of Banker and Chang (2006) for identifying outliers in the production frontier. Maybe exceptional eficient cities should be taken into account to know why that could be so different in offering more services with some level of investments. By the way the ineficient cities should try to reach these exceptional eficient cities and not those with the same productivity level. That was one of the reasons to apply a non parametric metric to analyze the expenditure eficiency.
performance, public managers need to understand how they can inluence people’s behavior inside their cities which produce their results, and how they can inluence the citizens’ behavior, which is converted into results from these outputs.
We questioned whether there were changes in productivity from 2007 to 2010 and we found that there was no gain in productivity in any of the four groups obtained. For most cities there were no statistically signiicant changes in productivity or when it was found, these were caused by lost in productivity. The analysis of the cause of productive lost is not in this study but there are a main hypothesis about that: the rise in the difference between the eficient cities and ineficient cities. In this case, we could analyze in future studies if this difference was caused by the improvement of eficient cities or worse of ineficient cities.
Since the importance cited in this study, the need to increase eficiency at the expense of the budget increase for the sector, it is important to try to seek the causes of reduced productivity and work so that resources can be allocated more productively.
Besides analyses of productivity lost, future studies could analyze and compare the validity among different models that could incorporate other variables as num -ber of physicians, num-ber of nurses and epidemiological and mortality variables (as childhood mortality, frequency of diabetes and arterial hypertension). The purpose of studies like that are beyond this study purpose and could incorporate statistical analysis as structural equation modeling and path analysis to test which model could be more appropriate to rank the eficiency of cities.
References
BANKER, R. D. Hypothesis tests using Data Envelopment Analysis. The Journal of Productivity Analysis, n.7, p. 139-159, 1996.
BANKER, R. D.; CHANG, H. The super-eficiency procedure for outlier identiication, not for ranking eficient units. European Journal of Operational Research, 175, p.1311-1320, 2006.
BANKER, R. D.; CHANG, H.; NATARAJAN. Productivity change, technical progress, and relative eficiency change in the public accounting industry. Management Science, v. 51, n. 2, p. 291-304, 2005.
BANKER, R. D.; CHARNES, A.; COOPER, W.W. Some models for estimating technical and scale ineficiencies in data envelopment analysis. Management Science, v. 30, n. 9, p. 1078-1092, 1984.
BANKER, R. D.; THRALL, R.M. Estimation of returns to scale using DEA. European Journal of Operational Research, v. 62, n. 1, p. 74-84, 1992.
BEHN, R.D. Why measure performance? Different purposes require different measures. Public Administration Review, v. 63, n. 5, 2003.
BRASIL. Ministério da Saúde. Avaliação econômica em saúde. Brasília, 2008 BRASIL. Ministério da Saúde. Política nacional de atenção básica. 4. ed. Brasília, 2007. 68 p.
CAVES, D.W.; CHRISTENSEN, L.R.; DIEWERT, W.E. The economics theory of index numbers and the measurement of input, output and productivity”. Econometrica, v. 50, n. 1, pp. 1393-1414, 1982.
CONILL, E.M. Ensaio histórico-conceitual sobre a Atenção Primária à Saúde: desaios para a organização de serviços básicos e da Estratégia Saúde da Família em centros urbanos no Brasil. Caderno de Saúde Pública, Rio de Janeiro, v. 24, n. 1, p. S2-S27, 2008.
ELIAS, P. E. et al. Primary health care: a comparison of PSF and UBS units per stratum of socially excluded users in the city of São Paulo. Ciência e Saúde Coletiva, v. 11, n. 3, p. 633-64, 2006
FARRELL, M.J. The measurement of productive eficiency. Journal of the Royal Statistical Society, v. 120, n. 3, p. 253-90, 1957.
FARE, R. et al. Productivity growth, technical progress and eficiency change in industrialized countries. The American Economic Review, v. 84, n. 1, p. 66-83, 1994.
FERGUSON, T. D.; DEEPHOUSE, D. L.; FERGUSON, W. L. Do strategic groups differ in reputation? Strategic Management Journal, n. 21, p. 1195-1214, 2000.
FLEURY, S. S. B.; BARIS, E. Reshaping health care in Latin America: a comparative analysis of health care reform in Argentina, Brazil, and Mexico. Ottawa:
International Development Research Centre (IDRC), 2001.
FLEURY, S.; BAHIA, L.; AMARANTE, P, (Org.). Saúde em debate: fundamentos da Reforma Sanitária.Rio de Janeiro: Cebes, 2007. ISBN-978-85-88422-09-4. FONSECA, P. C.; FERREIRA, M. A. M. Investigação dos níveis de eiciência na utilização de recursos no setor de saúde: uma análise das microrregiões de Minas Gerais. Saúde & Sociedade, v. 18, n. 2, p. 199-213, 2009.
GIL, C. R. R. Atenção primária, atenção básica e saúde da família: sinergias e singularidades do contexto brasileiro. Cadernos de Saúde Pública, v. 22, n. 6, p. 1171-1181, 2006.
GIOVANELLA, L. Primary care in European Union countries: conigurations and organizational reforms in the 1990s. Caderno de Saúde Pública, v. 22, n. 5, p. 951-963, 2006.
GREILING, D. Performance measurement: a remedy for increasing the eficiency of public services? International Journal of Productivity and Performance Management, v. 55, n. 6, 2006.
MAROCO, J. Analyze estatística. Lisboa: Sílabo, 2003. 508 p.
HAIR, J. F. et al. Multivariate data analysis. New Jersey: Upper Saddle River, 2005. HALACHMI, A. Performance measurement is only one way of managing
desempenho. International Journal of Productivity and Desempenho Management, v. 54, n. 7, 2005.
HENRIQUE, F.; CALVO, M.C.M. The degree of implementation of the Family Health Program and social indicators. Ciência e Saúde Coletiva, v. 14, n. 1, p. 1359-1365, 2009.
IBAÑEZ, N. et al. Care performance assessment of primary health care services inthe State of São Paulo. Ciência e Saúde Coletiva, v. 11, n. 3, p. 683-703, 2006. LA FORGIA, G. M.; COUTTOLENC, B. F. Desempenho hospitalar no Brasil: em busca da excelência. São Paulo: Singular, 2009. 496 p.
MILLIGAN, G. W.; COOPER, M. C. An examination of procedures for determining the number of clusters in a data set. Psychometrika, v. 50, n. 2, p. 159-179, 1985. RAY, S. C.; DESLI, E. Productivity growth, technical progress, and eficiency change in industrialized countries: comment. The American Economic Review, v. 87, n. 5, p.1033-1039, 1997.
RAY, S.C. Data envelopment analysis: theory and techniques for economics and operations research. New York: Cambridge University Press. 2004.
SANTOS, L. M. et al. Public health expenditure in Brazil: an analysis of eficiency. In: ENANPAD, 34., 2010, Rio de Janeiro. Proceedings... Rio de Janeiro: Anpad, 2010.
SCOTT, R. S. Effectiveness of organizational effectiveness studies. Goodman and Johannes M. Pennings. San Francisco, p. 63-95, 1977.
SCOTT, W. R.; DAVIS, G. F. D. Organizations and organizing: rational, natural, and open system perspectives. Upper Saddle River, NJ: Prentice Hall, 2007.
SELDEN, S. C.; SOWA, J. E. Testing a multi-dimensional model of organizational performance: prospects and problems. Journal of Public Administration Research and Theory, v. 14, n. 3, p. 395-416, 2004.
SHORT, J.C. et al. Firm, strategic group, and industry inluences on performance. Strategic Management Journal, v. 28, p. 147-167, 2007.
STARFIELD, B. Primary care: balancing health needs, services, and technology. New York: Oxford University Press, 1998.
SUGAR, C. A.; JAMES, G. M. Finding the number of clusters in a dataset: an information-theoretic approach. Journal of the American Statistical Association, v. 98, n. 463, p. 750-763, 2003.
WIBULPOLPRASERT, S.; TANGCHAROENSATHIEN, V.; KANCHANACHITRA, C. Three decades of primary health care: reviewing the past and deining the future. Bulletin of the World Health Organization, v. 86, n.1, 2008.
WORLD BANK. Brazil: governance in Brazil’s Uniied Health System (SUS): raising the quality of public spending and resource management. Washington, DC: World Bank, 2007.
WORLD HEALTH ORGANIZATION – WHO. Brazil: health proile 2010. Available at: <http://www.who.int/countries/bra/en/
>
. Accessed on: 23 mar. 2011.Appendix - Cities on the frontier
Table 1 – Group 1
Year City (State) Year City (State) Year City (State)
2010 Arapuá(MG) 2007 Itaboraí(RJ) 2009 Flórida Paulista (SP)
2007 Campo Belo(MG) 2008 Itaboraí(RJ) 2010 Flórida Paulista (SP)
2008 Campo Belo(MG) 2009 Itaboraí(RJ) 2007 Guarujá (SP)
2009 Campo Belo(MG) 2010 Itaboraí(RJ) 2008 Indiaporã (SP)
2007 Campo do Meio(MG) 2008 Itaguaí(RJ) 2007 Itu (SP)
2010 Campos Altos(MG) 2010 Itaguaí(RJ) 2010 Itu (SP)
2007 Faria Lemos(MG) 2008 Magé(RJ) 2009 Mesópolis (SP)
2010 Heliodora(MG) 2009 Nilópolis(RJ) 2009 Mineiros do Tietê (SP)
2010 Inconidentes(MG) 2007 Nova Iguaçu(RJ) 2010 Monte Castelo (SP)
2010 Itueta(MG) 2008 Nova Iguaçu(RJ) 2007 Ourinhos (SP)
2008 Lima Duart(MG) 2009 Nova Iguaçu(RJ) 2009 Ourinhos (SP)
2008 Maravilhas(MG) 2010 Nova Iguaçu(RJ) 2008 Paulicéia (SP)
2009 Maravilhas(MG) 2007 São Fidélis(RJ) 2009 Piacatu (SP)
2010 Maravilhas(MG) 2008 São Fidélis(RJ) 2010 Piacatu (SP)
2009 Nova Era(MG) 2009 São Fidélis(RJ) 2007 Planalto (SP)
2008 Passos(MG) 2010 São Fidélis(RJ) 2009 Planalto (SP)
2009 Poço Fundo(MG) 2007 Araçatuba(SP) 2010 Pontalinda (SP)
2007 Pratápolis(MG) 2008 Araçatuba(SP) 2007 Ribeirão do Sul (SP)
2010 Pratápolis(MG) 2009 Araçatuba(SP) 2008 Ribeirão do Sul (SP)
2007 Ribeirão das Neves(MG) 2010 Araçatuba(SP) 2008 Salto Grande (SP)
2008 Ribeirão das Neves(MG) 2009 Arandu(SP) 2010 Salto Grande (SP)
2009 Ribeirão das Neves(MG) 2010 Arandu(SP) 2007 Santa Cruz do Rio
Pardo(SP)
2009 Santa Luzia(MG) 2008 Assis(SP) 2008 Santa Cruz do Rio
Pardo(SP)
2007 Santana do Paraíso(MG) 2009 Assis(SP) 2007 Santana de Parnaíba
(SP)
2008 São Gonçalo do Sapucaí(MG)* 2007 Buritama(SP) 2010 Santana de Parnaíba
(SP)
2008 São Pedro da União(MG) 2008 Buritama(SP) 2007 São Lourenço da Serra
(SP)
2009 Teóilo Otoni(MG) 2010 Cajati (SP) 2008 São Lourenço da Serra
(SP)
2010 Teóilo Otoni(MG) 2009 Canas (SP) 2010 Tabatinga (SP)
2009 União de Minas(MG) 2010 Canas (SP) 2010 Taquarituba (SP)
2010 União de Minas(MG) 2007 Castilho (SP) 2008 Urupês (SP)
2007 Marataízes(ES) 2008 Castilho (SP)
2008 Marataízes(ES) 2009 Castilho (SP)
2010 Marataízes(ES) 2010 Castilho (SP)
2007 Belford Roxo(RJ)) 2007 Cravinhos (SP)
2008 Belford Roxo(RJ) 2007 Embu-Guaçu (SP)
2009 Belford Roxo(RJ) 2010 Emilianópolis (SP)
2010 Belford Roxo(RJ) 2009 Cachoeiras de Macacu(RJ)
*Weakly eficients cities
Table 2 – Group 2
Year City (State) Year City (State) Year City (State)
2009 Chapada Gaúcha (MG) 2007 São João Evangelista (MG) 2007 São José do Goiabal (MG)
2010 Coroaci (MG) 2010 São João Evangelista (MG) 2008 São José do Jacuri (MG)
2007 Engenheiro Caldas (MG) 2009 Orizânia (MG) 2010 São Sebastião do Anta (MG) 2008 Engenheiro Caldas (MG) 2009 Passa-Vinte (MG) 2009 Bonito de Minas (MG) 2010 Estrela Dalva (MG) 2010 Pedra Azul (MG) 2010 Bonito de Minas (MG)
2009 Felício dos Santos
(MG) 2007 Pedras de Maria da Cruz (MG) 2010 Ubaporanga (MG)
2010 Felício dos Santos
(MG) 2009 Pedras de Maria da Cruz (MG) 2007 Várzea da Palma (MG)
2009 Glaucilândia (MG) 2010 Pedras de Maria da Cruz
(MG) 2009 Várzea da Palma (MG)
2010 Glaucilândia (MG) 2008 Pescador (MG) 2008 Brasília de Minas (MG)
2007 Itabirinha (MG) 2009 Pescador (MG) 2009 Brasília de Minas (MG)
2008 Itanhomi (MG) 2008 Pintópolis (MG) 2009 Conceição da Barra (MG)
2007 Araçuaí (MG) 2010 Porteirinha (MG) 2010 Braúnas (MG)
2009 Jordânia (MG) 2009 Poté (MG) 2008 Santa Leopoldina (ES)
2010 Jordânia (MG) 2010 Poté (MG) 2010 Sooretama (ES )
2007 José Raydan (MG) 2009 Pres. Kubitschek (MG) 2009 São Franc. de Itabapoana (RJ)
2008 José Raydan (MG) 2010 Pres. Kubitschek (MG) 2010 São Franc. de Itabapoana (RJ )
2007 Lassance (MG) 2008 São Dom. das Dores (MG) 2009 Cajuri (MG)
2008 Minas Novas (MG) 2010 São Dom. das Dores (MG) 2010 Cajuri (MG)
2009 Minas Novas (MG) 2008 São Francisco (MG) 2010 Bom Sucesso de Itararé
(SP)
2010 Miradouro (MG) 2009 São Francisco (MG)
2009 Arinos (MG) 2010 São Francisco (MG)
2007 Nanuque (MG) 2009 São Geraldo do Baixio (MG)
2008 Nanuque (MG) 2010 São Geraldo do Baixio (MG)
2010 Nanuque (MG) 2010 São Gonç. Rio Preto (MG)
Fonte: resultados da pesquisa.
Table 3 – Group 3
Year City (State) Year City (State) Year City (State)
2009 Água Comprida (MG) 2007 Birigui(SP) 2007 Itanhaém(SP)
2007 Araújos (MG)* 2008 Birigui(SP) 2008 Itanhaém(SP)
2007 Belo Horizonte (MG) 2009 Birigui(SP) 2009 Itanhaém(SP)
2008 Belo Horizonte (MG) 2010 Birigui(SP) 2010 Itanhaém(SP)
2009 Belo Horizonte (MG) 2010 Buritizal(SP) 2009 Jaboticabal(SP)
2007 Betim (MG) 2009 Cesário
Lange(SP) 2008 Jandira(SP)
2008 Betim (MG) 2010 Cesário
Lange(SP) 2009 Jandira(SP)
2009 Fortaleza de Minas (MG) 2008 Diadema(SP) 2010 Jandira(SP)
2007 Guaxupé (MG) 2009 Diadema(SP) 2010 Lençóis
Paulista(SP)
2008 Guaxupé (MG) 2010 Diadema(SP) 2007 Lins(SP)
2008 Ipatinga (MG) 2007 Embu(SP) 2009 Lins(SP)
2010 Nova Lima (MG) 2008 Embu(SP) 2010 Lins(SP)
2010 Patos de Minas (MG) 2009 Embu(SP) 2007 Mauá(SP)
2008 Tiradentes (MG) 2010 Embu(SP) 2008 Mauá(SP)
2010 Tiradentes (MG) 2010 Guareí(SP) 2008 Meridiano(SP)
2008 Uberlândia (MG) 2007 Guariba(SP) 2007 Mogi das
Cruzes(SP)
2009 Uberlândia (MG) 2009 Guariba(SP) 2008 Mogi das
Cruzes(SP) 2008 Serra (ES) 2007 Guarulhos(SP) 2007 Mogi Guaçu(SP)
2007 Venda Nova do Imigrante(ES) 2008 Guarulhos(SP) 2008 Mogi Guaçu(SP)
2010 Venda Nova do Imigrante(ES) 2009 Guarulhos(SP) 2009 Mogi Guaçu(SP)
2007 Alfredo Marcondes(SP) 2010 Guarulhos(SP) 2007 Osasco(SP) 2008 Alfredo Marcondes(SP) 2009 Iperó(SP) 2008 Osasco(SP) 2009 Alfredo Marcondes(SP) 2007 Iracemápolis(SP) 2009 Osasco(SP) 2010 Alfredo Marcondes(SP) 2009 Iracemápolis(SP) 2010 Osasco(SP) 2007 Barretos(SP) 2007 Batatais(SP)
2010 Nova Castilho(SP) 2009 Bilac(SP)
*Weakly eficient cities
Fonte: resultado da pesquisa.
Table 4 – Group 4
Year City (State) Year City (State) Year City (State)
2009 Araçaí (MG) 2007 Montes Claros (MG) 2007 Aparecida d’Oeste
(SP)*
2010 Aracitaba (MG) 2008 Montes Claros (MG) 2008 Aparecida d’Oeste
(SP)
2009 Bela Vista de Minas (MG) 2009 Montes Claros (MG) 2009 Aparecida d’Oeste
(SP)
2008 Belo Oriente (MG) 2010 Montes Claros (MG) 2010 Aparecida d’Oeste
(SP)
2010 Campo Florido (MG) 2010 Reduto (MG) 2009 Borborema (SP)
2007 Carmópolis de Minas (MG) 2007 Resplendor (MG) 2007 Itapevi (SP)
2010 Claraval (MG) 2007 Ritápolis (MG) 2009 Itapevi (SP)
2009 Conceição dos Ouros
(MG) 2008 Ritápolis (MG) 2007 Itaquaquecetuba (SP)
2008 Conselheiro Pena
(MG) 2010 Ritápolis (MG) 2008 Itaquaquecetuba (SP)
2009 Conselheiro Pena (MG) 2007 Santa Cruz de Minas (MG) 2009 Itaquaquecetuba (SP)
2008 Corinto (MG) 2009 Santa Cruz de Minas (MG) 2010 Itaquaquecetuba
(SP)
2007 Formiga (MG) 2010 São Sebastião da Bela Vista (MG) 2008 Nova Independência (SP)
2008 Formiga (MG) 2008 Sapucaí-Mirim (MG) 2010 Nova Independência
(SP)
2009 Formiga (MG) 2010 Sapucaí-Mirim (MG) 2008 Paranapanema (SP)
2009 Gonçalves (MG) 2007 Cariacica (ES) 2007 Piedade (SP)
2007 Governador Valadares (MG) 2008 Cariacica (ES) 2008 Piedade (SP)
2007 Ibirité (MG) 2009 Cariacica (ES) 2009 Piedade (SP)*
2008 Ibirité (MG) 2007 Nova Venécia (ES) 2010 Piedade (SP)
2009 Ibirité (MG) 2008 Nova Venécia (ES) 2010 Piquerobi (SP)
2010 Ibirité (MG) 2009 Nova Venécia (ES) 2009 São Francisco (SP)
2008 Mateus Leme (MG) 2007 São Mateus(ES) 2007 Taiaçu (SP)
2007 Matipó (MG) 2007 Viana(ES) 2008 Taiaçu (SP)
2008 Matipó (MG) 2010 Viana(ES) 2010 Taiaçu (SP)
2009 Matipó (MG) 2008 Anhumas (SP)
2010 Matipó (MG) 2008 Uchoa (SP)
* Weakly eficient cities