1 Physical Therapy Department, Hospital Universitário Gaffrée e Guinle, Rio de Janeiro, RJ, Brazil 2 Physical Therapy Department, Instituto Federal de Ciência e Tecnologia (IFRJ), Rio de Janeiro, RJ, Brazil 3 IAE de Tours, Université Francois Rabelais, Tours, France
Received: 07/03/2012 Revised: 10/10/2012 Accepted: 02/07/2013
a r t i c l e
Analysis of the user satisfaction level
in a public physical therapy service
Renato S. Almeida1, Leandro A. C. Nogueira1,2, Stéphane Bourliataux-Lajoine3
ABSTRACT | Background: The concepts of quality management have increasingly been introduced into the health sector. Methods to measure satisfaction and quality are examples of this trend. Objective: This study aimed to identify the level of customer satisfaction in a physical therapy department involved in the public area and to analyze the key variables that impact the users’ perceived quality. Method: A cross-sectional observational study was conducted, and 95 patients from the physical therapy department of the Hospital Universitário Gaffrée e Guinle – Universidade Federal do Estado do Rio de Janeiro (HUGG/UNIRIO) - Rio de Janeiro, Brazil, were evaluated by the SERVQUAL questionnaire. A brief
questionnaire to identify the sociocultural proile of the patients was also performed. Results: Patients from this health
service presented a satisied status with the treatment, and the population inal average value in the questionnaire was 0.057 (a positive value indicates satisfaction). There was an inluence of the educational level on the satisfaction status
(χ²=17,149; p=0.002). A correlation was found between satisfaction and the dimensions of tangibility (rho=0.56, p=0.05)
and empathy (rho=0.46, p=0.01) for the Unsatisied group. Among the Satisied group, the dimension that was correlated with the inal value of the SERVQUAL was responsiveness (rho=0.44, p=0.01). Conclusions: The inal values of the GGUH physical therapy department showed that patients can be satisied even in a public health service. Satisfaction
measures must have a multidimensional approach, and we found that people with more years of study showed lower values of satisfaction.
Keywords: health management; physical therapy; user satisfaction.
HOW TO CITE THIS ARTICLE
Almeida RS, Nogueira LAC, Bourliataux-Lajoine S. Analysis of the user satisfaction level in a public physical therapy service. Braz J Phys Ther. 2013 July-Aug; 17(4):328-335. http://dx.doi.org/10.1590/S1413-35552012005000097
Introduction
In the health care industry, high and rising costs, despite attempts to reduce them, have been observed
to not be justiied by improvements in quality. In
contrast, the service given to many consumers is not compatible with minimal acceptable standards and procedures, and the incidence of preventable medical errors remains very high1. In the last decade, several
programs of quality certiication have been developed
in hospitals throughout Europe. The implementation of these measures has shown a strong correlation with the variables of control management and professional development2.
On the Brazilian front, these dynamics are not new. Over the last 20 years, the process of capitalization and the complex economy that propels this market have been discussed. Most studies discuss the constitution of a complex health-industry, involving professional development, industry, and specialized work forces, and also focus on the production process and consumption of medication3.
In Brazil, with the return to democracy that occurred in the 1980s and the implementation of the Brazilian Health Reform movement, demands have been strengthened for better customer service in health care. The vast majority of the population, approximately 60%, depends on the public health
system. The Brazilian health system (Uniied Health
System – SUS) consists of a complex network of providers and purchasers of services, and a complex mixture of public and private sectors can be found4.
However, some problems are being faced by the system currently, such as the poor quality of services offered in terms of equipment and professional services in some states, the lack of public participation in the formulation and management of health policies, and the lack of mechanisms for the monitoring, control and evaluation of these services5.
diagnostic and therapeutic support services. Other examples of private market relationships are the treatments that require high-cost procedures, which are performed predominantly by contracted private sector providers or public teaching hospitals. In contrast, people with private health plans are known to have better access to preventive services and higher health care use rates than those without such plans. However, these private market users often receive vaccines, high-cost services, and complex procedures, such as hemodialysis and transplants, through the SUS6.
This situation shows the necessity of programs to control internal processes and quality management. There are two ways to manage quality. An “organizational and normative” form and a “customer/
user perception” form. The irst is manifested by
quality certification programs, and the second, based on customer/user perception, is commonly represented by satisfaction surveys2. In the physical
therapy area, there are some speciic and generic
instruments that have already been applied to measure patient satisfaction5,7.
Coming from human sciences, such as marketing, one of the most used instruments for satisfaction measurement in the world is the Servqual questionnaire, which is a generic and adaptable instrument that can be applied to different segments. Currently, this tool has been used and adapted for different business areas, and it has already been validated for healthcare. According to
the authors, consumers’ perceptions are inluenced by ive gaps, based on the users’ perception and
expectations. These gaps are represented by the questions in the instrument, which are divided into five dimensions: tangibility (the appearance of physical facilities and equipment), reliability (the ability to perform the promised service dependably and accurately), responsiveness (the willingness to help users and provide prompt service), assurance (the knowledge and courtesy of employees and their ability to inspire trust), and empathy (the level of caring and individualized attention)8. For the
Brazilian health care area, the usefulness and validity
of the modiied instrument had already been proven,
as found in the studies of Borges et al.9, Hercos and
Berezovsky10, and Curry and Sinclair11.
Therefore, the aims of this study were to identify the customer satisfaction level with a physical therapy unit inside a public healthcare institution and to identify the main sociocultural variables that can be correlated with patient satisfaction. Thus, the hypothesis to be considered was the possible relationship between socio-cultural indicators and
satisfaction rates of the population studied and the importance of differentiating the various dimensions that may lead to perceived quality.
Method
Design
This cross-sectional observational study was performed in 95 patients in a specialized health care service involved in the public sphere. Data were collected in orthopedic, neurology and lymphatic drainage units of the physical therapy department at the Hospital Universitário Gaffrée e Guinle – Universidade Federal do Estado do Rio de Janeiro (HUGG/UNIRIO), Rio de Janeiro, RJ, Brazil, from May 2010 to July 2010. The patients were asked to complete the survey at two different moments: when
they arrived at the clinic for the irst time and after ive
visits to the physical therapy unit. We also collected socio-cultural data such as age, gender, scholarity and personal income. Patients from the physical therapy unit participated in this study without discrimination of age, gender and socio-cultural condition. The exclusion criteria were illiteracy or cognitive disorders. This study was approved by the ethics committee of the Hospital Universitário Gaffrée e Guinle under number 53/2010, and all patients gave written consent agreeing to the intent of this study.
Procedures
During the irst and ifth meetings, the patients
completed the Servqual questionnaire adapted to the health area, which consists of 2 sections of 23 closed questions each. It is arranged into a section devoted to the expectations with the service and another to the perceived quality. The statements were adequate
to it into the unit reality, so we used the adapted
Servqual10,12,13 with the name “Physical therapy
Department” at the beginning of the statements. This instrument was chosen because it had already been applied in an ophthalmologic service in the public sphere, and some similarities can be found between this service and HUGG/UNIRIO. The psychometric values of the original and the health care-adapted instrument have already been described8-13. The
minus expectations) and divided by the number of the statements of the dimension. We used the formula9:
= =
∑
1 –nj i ji
Pi Ei ESC
nj
where Pi is the perceived quality evaluated in the statement i; Ei is the expectations with the service that is evaluated in the statement i; and nj is the number of statements that belong to the jthdimension.
The scores (in percentages) that the users allocated according to the degree of relevance of each
dimension was multiplied by the inal score of the
dimensions. At the end, the values of all dimensions were summed for each patient, and the mean of all patients was determined. Negative values show dissatisfaction, and positive values show satisfaction; therefore, patients who had negative scores on the
inal average of the questionnaire were classiied as unsatisied, and those who showed positive scores were classiied as satisied.
Statistical analysis
The data were analyzed using SPSS 17.0 and
Microsoft Ofice Excel 2007. The descriptive statistic
analyzed the sample characteristics, and the averages
of the Satisied and Unsatisied groups were also
analyzed. The chi-square test (χ²) was performed to
conirm the hypotheses. The mean percentage of both
groups was calculated for the different dimensions
of the questionnaire and for the inal score of the sample. The Spearman coeficient (rho) was used
for the analysis of possible correlations between
the sociocultural data and satisfaction level. The correlations were also analyzed for the two groups,
Satisied and Unsatisied patients. A forward linear
multiple regression analysis was performed, with
each of the signiicant variables from the correlation
entered as an independent variable and the total satisfaction value as the dependent variable.
Results
The vast majority of patients evaluated in the physical therapy ambulatory department of HUGG/ UNIRIO were from the orthopedic sector. Of the total population, 83 subjects belonged to the orthopedic area, 5 to neurology, and 7 to the lymphatic drainage sector. The average age of the patients was 65 years old (SD 9.6), and 62 were females (65%).
This study demonstrated that the variable sectors of treatment and gender showed no significant differences between both groups (Satisfied and
Unsatisied). The dominant level of education among
the population of the study was 10 to 11 years of study (25 individuals), but the number of patients who had only 9 years of study was very close (24 individuals). The sociodemographic data are given in Table 1.
A separate analysis of the education level between
those who were satisied and unsatisied showed that
this variable differed between the groups. The number of people allocated into the category “9 years of
study” was higher in the Satisied group; in contrast, more people in the Unsatisied group were allocated
into the category “10 to 11 years of study”. Thus,
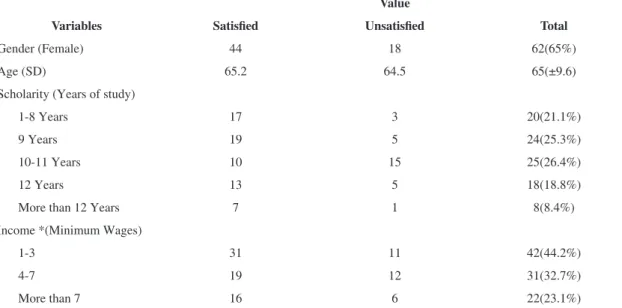
Table 1. Sociodemographic data.
Variables
Value
Satisfied Unsatisfied Total
Gender (Female) 44 18 62(65%)
Age (SD) 65.2 64.5 65(±9.6)
Scholarity (Years of study)
1-8 Years 17 3 20(21.1%)
9 Years 19 5 24(25.3%)
10-11 Years 10 15 25(26.4%)
12 Years 13 5 18(18.8%)
More than 12 Years 7 1 8(8.4%)
Income *(Minimum Wages)
1-3 31 11 42(44.2%)
4-7 19 12 31(32.7%)
More than 7 16 6 22(23.1%)
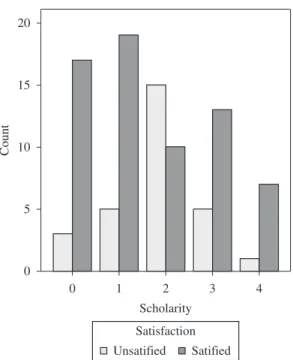
education was signiicantly associated (χ²=17,149; p=0.002) with the satisfaction of the patients. Figure 1 shows the relationship between the scholarity and satisfaction for the entire sample. This variable also showed a negative correlation (rho=–0.23, p=0.02) with satisfaction. Thus, people with more years of study likely showed lower rates of satisfaction.
The majority of the population had reported that their income ranged from 1 to 3 minimum wages
(U$336,00). These indings demonstrate that the proile of the consumers of public health care service
is mostly composed of the low-income population.
This study found no signiicant difference between the income means of the satisied and unsatisied
groups. However, a positive correlation was observed for the entire sample (rho=0.48, p=0.001) between the variables income and education. Thus, a higher income likely indicated that the individual had more years of study.
The analysis of the Servqual questionnaire data showed that 55.3% of the patients believed that all dimensions had the same level of importance. The total average satisfaction value of the physical therapy service at the Hospital Universitário Gaffrée e Guinle was 0.057. In addition, 29 patients showed a negative
disconirmation of expectations (dissatisfaction), 16 patients showed just a conirmation of expectations
(satisfaction), and 50 consumers showed a positive
disconirmation of expectations (satisfaction). This
result demonstrates a tendency of the service to overshoot the expectations of the patients. Table 2 shows the total mean of the satisfaction rates and the average of each dimension of the Servqual
questionnaire for the unsatisied (negative values) and satisied (positive values) patients.
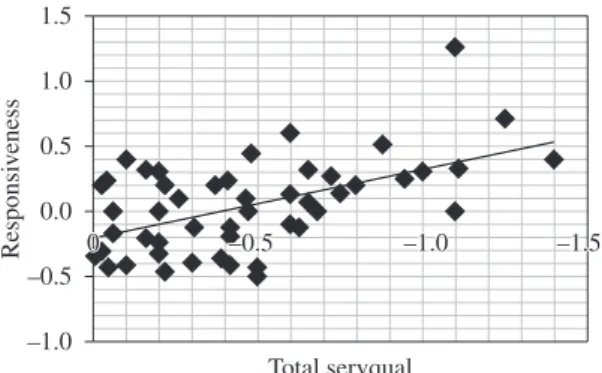
The correlation analysis showed that for the
satisied group, only the responsiveness dimension was positively correlated with the inal questionnaire
score (rho=0.44, p=0.01), as shown in Figure 2. Thus, individuals who observed positive signs in this dimension showed a tendency towards satisfaction with the service. For the group of
unsatisied patients, the empathy (rho=0.46, p=0.01)
and tangibility (rho=0.56, p=0.05) dimensions
signiicantly contributed to the negative scores at the
end of the questionnaire. This correlation is shown in Figure 3.
The multiple linear regression analysis revealed that all of the questionnaire´s dimensions partially determined the satisfaction values. However, the dimensions of tangibility and responsiveness were the strongest predictors of satisfaction. Each positive decimal score in the tangibility dimension was associated with a 1.02% (95% CI; 0.35% to
Figure 1. Distribution of educational level for the entire sample (scholarity) and the level of satisfaction with the service. Legend: 0-1 to 8 years of study; 1-9 years of study; 2-10 to 11 years of study, 3-12 years of study, 4- more than 12 years of study.
Table 2. Mean and standard deviation value for each dimension of the SERVQUAL questionnaire for Satisied and Unsatisied patients.
Dimensions Unsatisfied (N=29) Satisfied (N=66) Total Sat* (N=95)
TANG* –0.17(±0.30) 0.09(±0.37) –0.16(±0.35)
REL* –0.05(±0.15) 0.04(±0.31) 0.02(±0.24)
RESP* –0.07(±0.19) 0.05(±0.35) 0.01(±0.32)
ASS* –0.15(±0.30) 0.11(±0.31) 0.04(±0.26)
EMP* –0.16(±0.37) 0.12(±0.36) –0.02(±0.35)
Total* –0.63(±0.53) 0.46(±0.35) 0.057(±0.62)
*SERVQUAL Dimensions: TANG- tangibility; REL- reliability; RESP- responsiveness; ASS- assurance; EMP- empathy; Total Sat - Total
1.69%) presence of satisfaction (p<0.01). In the
same direction, each positive decimal score in the responsiveness dimension was associated with a 1.08% (95%CI, 0.46 to 1.7%) presence of satisfaction
(p<0.01).
Discussion
There are many differences in the protocols of customer care in specialized health services. Until now, there has been a lack of reliable studies that
deine variables to measure quality and satisfaction
in health care9,10. This study focused its approach on
the analysis of patient satisfaction in an university hospital’s physical therapy department. This segment was selected because there are few studies using this study design in this area and the relevance of studying quality inside the public sphere should be highlighted.
Quality is a key point for the development and efficiency of health care services. Although the literature has already shown the role of this variable, there is little description about the real determinants of a high quality health service11,14-17. Satisfaction
measures are usually based on consumer perceptions and can serve as one type of measure in a health care
quality program18-20. A study by Shaw et al.2 in many
European hospitals that have some type of quality
certiication program concluded that the criteria for
the better analysis of the hospitals in question were management capacity, patient safety, organization, clinical practice and job security. Notably, patient satisfaction has a multifactorial character, and another issue that must be highlighted is the importance of the team in the degree of user involvement with the service21. Thus, our study is aligned with the literature
data because similar dimensions were studied but with a greater focus on only the physical therapy department.
Our data showed the results of patients assessed in different sectors of the physical therapy clinic, but the demand from the orthopedics clinic was higher. For this reason, the vast majority of questionnaires were applied to patients in this area. Among the various areas of physical therapy, the literature has reported that the vast majority of the demand for outpatient attendance in this health area is concentrated in orthopedics7.
We found no significant differences in the satisfaction scores among the patient treatment areas, although the literature had previously demonstrated that there was a possible association between these variables. Thus, acute patients (with disease that is recent) tend to show higher rates of satisfaction than chronic patients and reported an even greater importance to the structural aspects. Patients who
have neurological disorders place greater conidence
in the relationship with the therapists, thus showing greater importance to the interpersonal relationship8,9.
A hypothesis regarding this difference on the indings
may involve the number of patients from different areas of physical therapy in our study.
The only the dimension focused on the therapist approach (responsiveness) was correlated with
satisfaction in the Satisied group. For Unsatisied
patients, dimensions focused on the structure (tangibility) and oriented towards the therapist (empathy) were correlated with satisfaction. For the entire sample, the model inserted into the forward linear multiple regression analysis showed that the satisfaction construct had a multifactorial approach, as previously described in the literature8,11,19,20. Tangibility, the dimension that
relects the health environment and structure, and
responsiveness (the willingness to help users and provide prompt service) were the strongest predictors of satisfaction. Therefore, our data suggest that it is important to improve the structure and processes
Figure 2. Correlation between responsiveness and the SERVQUAL inal score for Satisied patients (rho=0.44).
Figure 3. Correlation between tangibility and the Servqual inal
(patient – therapist relationship) to obtain user satisfaction in physical therapy health services.
Which factors actually predict satisfaction in all
health ields remains unclear. This dificulty occurs because there are many different proiles of health
services and users but the multidimensional approach is cited by most studies19,20,22. According to Rashid
and Jusoff17, only the technical quality parameter is
not a useful tool in assessing levels of satisfaction. Patient satisfaction is largely associated with items
that relect a high-quality interaction with the therapist
and environmental factors, for example22. These data
are consistent with the present study, which showed consistency in the relationship between satisfaction and several factors23.
Hekkert et al.24 found that only a minor part of the
satisfaction score is attributed to the service structure.
All patient characteristics have some signiicant inluence on patient satisfaction. Age, health status
and education appeared to be the most important determinants of patient satisfaction. Gender, mother language, hospital type, hospital size, population density and response rate seemed to be less important determinants. However, there is no agreement yet in the literature about what is most relevant for satisfaction in health care. In the physical therapy area, many different satisfaction measurement instruments have already been described around the world, but some disagreement can be found among them25. Fenton et al.26 conducted a prospective cohort
study of health care system users (N=51 946) to evaluate health care utilization patterns, satisfaction and outcomes, but at the end, they could not state what drives patient satisfaction26.
This present study found no signiicant difference
in satisfaction with respect to gender. Patient age, which is usually described in the literature as having
an impact on satisfaction, showed no signiicant
difference in our work27,28. This result may have
occurred because the studied population consisted predominantly of elderly people, with few young patients in our sample.
The negative correlation between education and satisfaction that was found indicates that patients with more years of study have lower levels of satisfaction. The hypothesis that can be postulated for this type of user behavior is the cultural background that can be acquired by people with more scholarity. Another variable that is usually linked to schooling is income, as was demonstrated in this study. However, the income criterion alone was not correlated with the level of satisfaction. Therefore, we can conclude that a higher or lower income does not directly impact satisfaction5,29.
The satisfaction levels achieved by the patients in the physical therapy department of the Hospital Universitário Gaffrée e Guinle showed that even a health service involved in the public area can provide consistent levels of satisfaction or even exceed the expectations of consumers. The results showed that the parameters commonly used in private health care can also be encouraged in public services13. Currently,
many studies have been analyzing this topic in our public health system (SUS), and most of the results tend to show the presence of satisfaction with the treatments5,7,9,10,19.
Possible false positive data may occur in the study if there was a strong relationship between the patients and their therapists or if the patients were unable to
ind in the survey the factor(s) that they judge as
the most important for a quality service30,31. This
same problem has been faced in other health service studies. Baker et al.21 showed that when users have
high involvement levels with a service, they tend to assign positive values to the perceived quality. This
type of bias is dificult to eliminate from the physical
therapy studies because of the nature of most services in this area. Another limitation that can be observed is that a transcultural adaptation of the instrument used for the physical therapy area was not used, although the internal and external validity of this generic questionnaire had already been proven for other similar health care areas9-11.
Conclusion
The concepts of quality and satisfaction should be encouraged in public services because this area, in recent decades, has been undergoing an administrative overhaul and the concepts of effectiveness and efficiency are being gradually inserted into the structure of the administrative management of these services.
The findings showed that the education level had some impact on the average values of patient satisfaction, with people with more years of study showing lower values of satisfaction. It should be highlighted that the SERVQUAL is a useful tool for satisfaction measurement in health areas and that the
inal values of the physical therapy department from
Gaffrée and Guinle University Hospital showed that
patients can be satisied even in a public health service.
The demonstration that a multifactorial analysis using the Servqual questionnaire for perceived quality
identiication was relevant to better understand the
empathy. However, for the satisied group, the most
relevant dimension was responsiveness.
For the entire sample, the dimensions that most predicted satisfaction were tangibility (environment and structure) and responsiveness (the willingness to help users and provide prompt service). These data suggested that improving the structure and processes (patient – therapist relationship) is important to reach user satisfaction in physical therapy health services. A possible bias in the physical therapy area should be considered in all survey scores because a strong relationship between the patient and therapist is often present in this type of health service.
References
1. Porter ME. On competition. Harvard Business Review Book; 2006.
2. Shaw C, Groene O, Mora N, Sunol R. Accreditation and ISO certiication: do they explain differences in quality management in European hospitals? Int J Qual Health Care. 2010;22(6):445-45. http://dx.doi.org/10.1093/ intqhc/mzq054
3. Gadelha CAG. The health industrial complex and the need of a dynamic approach on health economics. Cienc Saúde Coletiva. 2003;8(2):521-535. http://dx.doi.org/10.1590/ S1413-81232003000200015
4. Travassos C, Viacava F, Fernandes C, Almeida CL. Social and geographical inequalities in health services utilization in Brazil. Cienc Saúde Coletiva. 2000;5(1):133-149. http:// dx.doi.org/10.1590/S1413-81232000000100012 5. Moreira CF, Borba JAM, Mendonça, KMP. An instrument
to assess patient satisfaction with physical therapy in the public health system. Fisioter Pesqui. 2007;14(3):37-43. 6. Paim J, Travassos C, Almeida C, Bahia L, Macinko J. The
Brazilian health system: history, advances, and challenges. Lancet. 2011;377: 1778-97. http://dx.doi.org/10.1016/ S0140-6736(11)60054-8
7. Machado NP, Nogueira LP. Evaluation of physical therapy service user satisfaction. Rev Bras Fisioter. 2008;12 (5):401-8. http://dx.doi.org/10.1590/ S1413-35552008000500010
8. Ladhari RA. Review of twenty years of SERVQUAL research. Int J Qual Ser Sci. 2009;1(2):172-198. 9. Borges JB, Carvalho SM, Silva MA. Quality of service
provided to heart surgery patients of the Uniied Health System-SUS. Rev Bras Cir Cardiovasc. 2010;25(2):172-82. http://dx.doi.org/10.1590/S0102-76382010000200008 10. Hercos SBV, Berezovsky A. Ophthalmological service
quality offered to outpatients of the Public Healthcare System. Arq Bras Oftalmol. 2006;69(2):213-9.
11. Curry A, Sinclair E. Assessing the quality of physiotherapy services using Servqual. Int J Health Care Qual Assur. 2002;15(2):197-205. http://dx.doi. org/10.1108/09526860210437412
12. Parasuraman A, Zeithaml VA, Berry LL. SERVQUAL: A multiple-item scale for measuring consumer perceptions of service quality. J Retailing. 1988;64(1):12-40. 13. Parasuraman A, Zeithaml VA, Berry LL. Reinement
and reassessment of the SERVQUAL scale. J Retailing.1991;67(4):420-50.
14. Santibáñez P, Chow VS, French J, Puterman ML, Tyldesley S. Reducing patient wait times and improving resource utilization at British Columbia Cancer Agency’s ambulatory care unit through simulation. Health Care Manag Sci. 2009;12:392-407. http://dx.doi.org/10.1007/ s10729-009-9103-1
15. Leatherman S, Ferris TG, Berwick D, Omaswa F, Crisp N. The role of quality improvement in strengthening health systems in developing countries. Int J Qual Health Care. 2010;22(4):237-243. http://dx.doi.org/10.1093/ intqhc/mzq028
16. Grönroos C. Marketing - Services and Management. Rio de Janeiro: Elsevier; 2003.
17. Rashid WE, Jusoff K. Service quality in health care setting. Int J Health Care Qual Assur. 2009;22(5):471-482. http:// dx.doi.org/10.1108/09526860910975580
18. Oliver RLA. Conceptual model of service quality and service satisfaction: compatible goals, different concepts. Adv Serv Mark Man. 1993;2:65-85.
19. Diógenes TPM, Mendonça KMP, Guerra RO. Dimensions of satisfaction of older adult Brazilian outpatients with physical therapy. Rev Bras Fisioter. 2009;13(4):301-7. http://dx.doi.org/10.1590/S1413-35552009005000038 20. Hills R, Kitchen S. Satisfaction with outpatient
physiotherapy: a survey comparing the views of patients with acute and chronic musculoskeletal conditions. Physiother Theory Pract. 2007;23(1):21-36. http://dx.doi. org/10.1080/09593980601147876
21. Baker TL, Cronin JJ, Hopkins CD. The impact of involvement on key service relationships. J. Serv. Mark. 2009;23(2):115-124. http://dx.doi. org/10.1108/08876040910946378
22. Beattie PF, Pinto MB, Nelson MK, Nelson R. Patient satisfaction with outpatient physical therapy: instrument validation. Phys Ther. 2002;82(6):557-65.
23. Moreira CF, Borba JAM, Mendonça KMP. Instrumento para aferir a satisfação do paciente com a assistência isioterapêutica na rede pública de saúde. Fisioter Pesqui. 2007;14(3):37-43.
24. Hekkert KD, Cihangir S, Kleefstra SM, Berg B, Kool RB. Patient satisfaction revisited: A multilevel approach. Soc Sci Med. 2009;69: 68-75. http://dx.doi.org/10.1016/j. socscimed.2009.04.016
25. Beattie P, Turner C, Dowda M, Michener L, Nelson R. The MedRisk Instrument for Measuring Patient Satisfaction With Physical Therapy Care: A Psychometric Analysis. J Orthop Sports Phys Ther. 2005;35(1):24-32.
26. Fenton JJ, Jerant AF, Bertakis KD, Franks P. The Cost of Satisfaction. Arch Intern Med. 2012;172(5):405-411. http://dx.doi.org/10.1001/archinternmed.2011.1662 27. Jaipaul CK, Rosenthal GE. Are older patients more
J Gen Intern Med. 2003;18:23-30. http://dx.doi. org/10.1046/j.1525-1497.2003.20114.x
28. Rahmqvist M, Bara A. Patient characteristics and quality dimensions related to patient satisfaction. Int J Qual Health Care. 2010;22(2):86-92. http://dx.doi.org/10.1093/ intqhc/mzq009
29. Suda EY, Uemura MD, Velasco E. Avaliação da satisfação dos pacientes atendidos em uma clínica-escola de Fisioterapia de Santo André, SP. Fisioter Pesqui. 2009;16(2):126-31. http://dx.doi.org/10.1590/ S1809-29502009000200006
30. Vinagre MH, Neves J. The inluence of service quality and patients’ emotions on satisfaction. Int J Health Care Qual Assur. 2008;21(1):87-103. http://dx.doi. org/10.1108/09526860810841183
31. Hibbard JH, Greene J, Daniel D. What is quality anyway? Performance reports that clearly communicate to consumers the meaning of quality of care. Med Care Res Rev. 2010;67(3):275-293. http://dx.doi. org/10.1177/1077558709356300
Correspondence
Renato Santos de Almeida