Management from the NOVA – School of Business and Economics.
PKNOA’s Internationalization Strategy
Afonso Marcos Moreira dos Reis Monteiro
Student Number: 18281 / 2933
A Project carried out on the Masters in Management Program, under the supervision of: Prof. Carlos Santos
PKNOA’s Internationalization Strategy
Founded in 2015, PKNOA is building a Big Data Platform to help companies deal with and extract value from high volumes of diverse data, through a new technological paradigm. I was asked to develop the internationalization section of the Portuguese startup’s initial strategic plan, mainly regarding countries and industries. A phased and more focused entry strategy, taking inputs from the Uppsala Model, regarding both countries and industries, will maximize our market recognition and optimize the use of our resources. From my analysis, the Utilities sector in the United States seems to be the target market with the most potential.
Table of Contents
Introduction ……….. 4
What is Big Data? ……….……….. 4
PKNOA and DataSonar ….……….. 6
The initial Strategic Plan ………..……… 7
Following Uppsala with a focused approach ………... 9
Countries Analysis ………... 10
Industries Analysis ………... 13
Big Data in Utilities ………..………... 20
Results Discussion ………... 22
Final Recommendation ………...………. 24
Introduction
At the time of this writing - second half of 2016 – the company is finalizing the development of a Big Data software platform, called DataSonar, which is planned to be officially launched at the beginning of 2017. The ultimate goal of the company is to establish itself as a reference in the Big Data industry by introducing a new technological paradigm.
I was one of the company’s first employees [http://www.datasonar.io/datasonar/#company-team], and since the beginning I have supported different types of business activities, like investors’ relationships management, clients’ relationships management, brand concept development, marketing activities, and, finally, the development of the initial strategic plan, which will be the basis for this thesis. In that document, we established the course of action for the company’s first years, and I was required to develop its internationalization section, focusing on countries and industries. During my analysis I will consider some of the main theories that address internationalization, such as the Uppsala model, the Born Globals theory, and the PESTEL analysis, all of which appearing to provide valuable inputs to guide the company, as well as to help in the selection of the best target markets.
I will start by providing an explanation of what Big Data is, which will be necessary to better comprehend the methodology employed later on, followed by a presentation of the company and an overview of what it does. Although PKNOA is building a technological product, this thesis is part of the Masters in Management and, as such, was developed from a business perspective. Only the necessary technological concepts will be presented.
This document was handed to the company’s Executive Committee for consideration.
What is Big Data?
Due to technological developments and the increasingly important role technology plays in our every-day lives, we are, on one hand, producing more data every day, and on the other, collecting more data. This is happening mainly because companies are realizing there are many sources of relevant information for their businesses that they hadn’t been considering, and by collecting it they can improve their knowledge, results and efficiency. Audio tapes from call centers, clickstream analysis to study what customers do in companies’ websites, sentiment analysis to understand consumers’ opinions on social media, video files, and sensors in machines are just a fraction of the current possible sources of data.
The problem is that all this data occupies space, and if there’s a lot of data, it takes much longer to process and find the parts that we need, or even to know what those parts are. Additionally, consumers have increasingly higher demands, which in many cases requires real-time action to be taken. Besides that, data is not all the same - everything is from a different type and in different formats. This is where Big Data and its 3 main V’s enter the scene: Volume, Velocity and Variety. Appendix 1 presents a set of examples of how Big Data is present in our world. Some of those are (IBM Big Data and Analytics Hub, 2013):
Ø Most companies in the United States have at least 100 terabytes (100 000 gigabytes) of data stored;
Ø Approximately 2.5 trillion gigabytes of data are created each day;
Ø The New York Stock Exchange captures 1 terabyte of trade information during each trading session;
Ø 30 billion pieces of content are shared on Facebook every month;
Ø More than 4 billion hours of video are watched on YouTube each month.
PKNOA and DataSonar
It’s also important to understand what DataSonar – PKNOA’s platform – is and to have an overview of its capabilities, as it will influence the range of possible paths the company can take, such as the industries and problems it has the ability to target – I invite you to visit our website www.datasonar.io. The purpose is to show that DataSonar is a transversal product, with the ability to be applied across sectors and use cases. Given that the last section of this project will evaluate the most attractive industries, the present section will hopefully allow the reader to understand why there is no reason to previously exclude any specific one.
A few years ago, the founders were faced with some problems when they wanted to integrate data from an ultrasound with data from a patient’s real life. At the time, they realized the available software tools had some limitations in terms of their capacity to work with such vast amounts of data. While working on that issue they soon realized the potential of what they were creating and the wide applicability it could have. So, after pivoting from the initial problem, they developed a new way to organize and model data, with the intention of increasing performance when dealing with high volumes of data that require fast results, regardless of its format or source. This technology was then patented and incorporated in a Big Data and Machine Learning platform. This concept - Machine Learning - consists of the ability of a software to, as the name suggests, learn from a dataset to apply that knowledge to future data that it encounters. It serves to detect complex relationships, as well as to automate analysis, due to this learning capacity. SAS (2016), one of the leading software vendors worldwide, defines this concept as “a method of data analysis that automates analytical model building. Using algorithms that iteratively learn from data, machine learning allows computer to find hidden insights without being explicitly programmed where to look”.
would perform every task in the data analysis process. This is in opposition of creating a tool focused on a particular task and integrating it with other software. The potential value of such a complete product was naturally also a reason for this decision. Those steps in a Big Data analytics lifecycle range from data acquisition to visualization, and are illustrated in more detail in Appendix 2.
The explanation provided above aims to clarify two important points for the internationalization strategy analysis:
1) being data-format-agnostic, DataSonar’s applicability is not limited by the format of the data and can thus work with any type;
2) addressing the entire data analysis process, the platform is not dependent of complementary tools and is thus able to address any big data issue.
The initial Strategic Plan
valuable inputs. Many studies were done to contest the relevance of this 1977 model in today’s world, but some of its ideas are still relevant for PKNOA’s case.
As stated by the authors in the International Business & Economics Research Journal, according to Uppsala firms should become international in a slow and incremental process that takes several years, due to the lack of knowledge about foreign markets. In the same paper, they claim that, on the other hand, the born globals concept entails a rapid and multidirectional pace of expansion, by penetrating multiple markets simultaneously. PKNOA should follow a balance between both views: not as fast as born globals, but not as slow Uppsala. Since, from the beginning, internationalization has been the company’s target, the company should go through Uppsala’s 4 steps, but in a faster pace. This is because, in today’s global world, acquiring knowledge about new markets has become easier and faster, due to the availability of information and the access to market experts, partners and facilitators. However, as it is explained in the next section, following Uppsala’s 4 steps in a focused approach will be essential to optimize the use of the company’s resources and maximize market recognition.
PKNOA builds software, which is easily transferred across long distances with minimum costs, transportation and warehousing issues do not arise. As such, this final step is not essential, so the final decision should be based more on technical questions than managerial ones.
Following Uppsala with a
focused
approach
As a 1-year old startup in stealth mode, we have a limited amount of financial resources that prevent us from building a large enough team to target several countries and industries. In the beginning, addressing more than one at the same time would require a much bigger amount of financing, which naturally implies a higher degree of dilution to investors. It would also represent a significant change in company size, structure and dynamics that could be more harmful than beneficial. While for now our structure is very horizontal, with less than 20 employees, such a change would result in a much more vertical hierarchy that would greatly modify the company’s decision-making processes. Embracing this alteration would take an adaptation period and imply a high degree of risk. The company should evolve gradually and begin by establishing a reputation on a small number of use cases in a particular country, after which it will be able to leverage that recognition to move forward to other areas with lower marketing efforts.
For these reasons, the next phases of this project will include the selection of the best countries for PKNOA to focus on, as well the most appropriate industries and use cases.
Countries Analysis
The PESTLE analysis stands for Political, Economical, Sociological, Technological, Legal and Environmental factors and is thought to be created by Harvard professor Francis Aguilar in 1967 (MindTools, 2016). This macro-economic framework allows companies to have an overview of the critical aspects of a market when engaging in strategic planning. Only by understanding the state of a market in each of these areas may a company evaluate its viability. Naturally, different industries and companies attribute different levels of importance to each criterion.
To apply this framework in PKNOA’s country selection, I used data from the World Economic Forum’s Global Competitiveness Report 2015-2016 (World Economic Forum, 2015). The “International Organization for Public-Private Cooperation”, as they describe themselves in their website, it was established in 1971 and is headquartered in Geneva, Switzerland. “It is independent, impartial and not tied to any special interests” (World Economic Forum, 2016) and promotes entrepreneurship in the public interest worldwide. This foundation is best known for its annual meeting where around 2 500 business and international leaders discuss, for five days, the most pressing global problems. Its trustworthiness and reliability are assured.
Innovation and Sophistication (Business Sophistication, R&D Innovation). These measures seemed to match with PESTLE’s, as shown in Figure 1, and were, thus, a great way to assess countries’ attractiveness.
Figure 1: Match between World Economic Forum and PESTLE criteria
Ø Analyzing the Global Competitiveness Report 2015-2016 data
The method applied in this WEF report was to score each country in each of the 12 presented criteria, as well as the overall score for each of the 3 main categories. Then each criterion was awarded a weight, with the final purpose of constructing the Global Competitiveness Index (GCI) – refer to Appendix 4 for an overview of the Global Competitiveness Index 2015-2016.
When selecting the first countries to target, Johansen and Vahlne introduced an interesting topic within the Uppsala model – psychic distance. This includes factors that can disturb the flow of information, such as language, culture or political systems. They defend that companies should start by countries with the lowest psychic distance. Taking this into consideration, besides the factors considered in the report, I decided to add two more criteria – English Proficiency and Geographic Proximity - whose scores needed to be obtained from a different source.
Ø English Proficiency
Data was obtained from the English Proficiency Index, from the Education First (2016) website. In this index, the self-proclaimed “world’s largest ranking of countries by English skills”, the majority of countries in the world are given a score corresponding to their average English level. Data was extracted regarding the 140 countries considered in the WEF ranking.
Ø Geographic Proximity
The website www.distancefromto.net contained the distances between Portugal and each of the 140 countries in the WEF ranking. A weight was also attributed to booth these criteria according to my view of their importance.
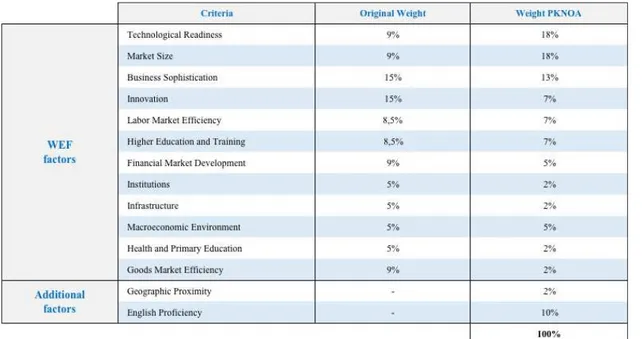
Ø Building PKNOA ranking
Figure 2: Weight of each criterion in the PKNOA Ranking
To obtain the new PKNOA Ranking, each country’s score in each criteria was multiplied by the weight for PKNOA. From these changes, I ended up with the PKNOA Ranking, whose top 5 countries were United States, United Kingdom, Germany, Switzerland and the Netherlands, in this order - refer to Appendix 5 for the full list. Thus, these represent my recommendations regarding the most attractive countries to target.
Industries Analysis
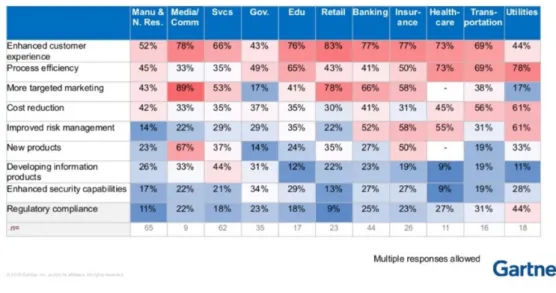
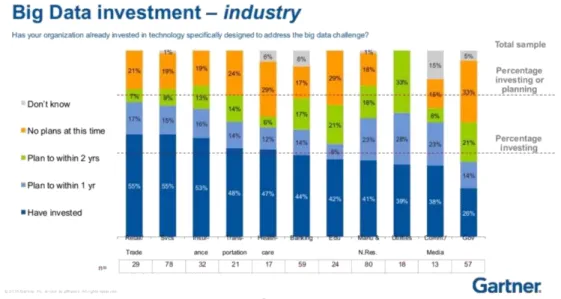
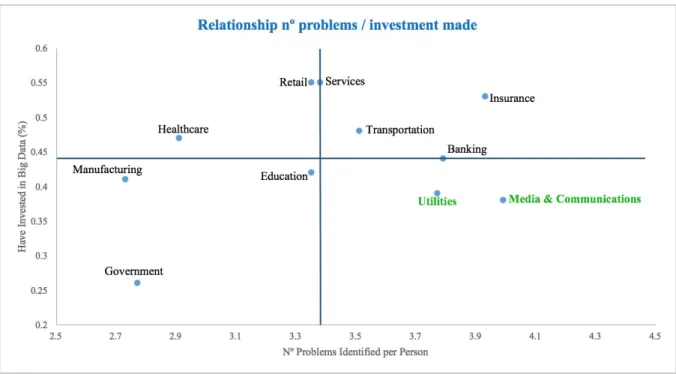
than 90 countries. In June 2015, they surveyed 437 of their Gartner Research Circle Members, which included “global organizations across all industries, both Gartner clients and nonclients” (Gartner, 2015). Those industries were Manufacturing and Natural Resources, Media and Communication, Services, Government, Education, Retail, Banking, Insurance, Healthcare, Transportation and Utilities. From the results, they built several figures and presented many conclusions. Two of those figures (Figure 3 and Figure 4 below) seemed particularly relevant for the purposes of this thesis. Figure 3 the big data problems that respondents identified in each industry and, thus, hints on the needs for big data solutions. Figure 4 shows the state of big data investment in each industry, as well as the intention to invest in the future.
Figure 4: Big Data investment –industry. Reprinted from www.slideshare.net, by Lisa Kart from Gartner, 2015, Retrieved from http://www.slideshare.net/denisreimer/big-data-industry-insights-2015
In the Heatmap of Big Data Business Problems by Industry, 326 people identified one or more Big Data problems in their industry, between Enhanced Customer Experience, Process Efficiency, More Targeted Marketing, Cost Reduction, Improved Risk Management, New Products, Developing Information Products, Enhanced Security Capabilities and Regulatory Compliance. The Big Data investment – Industry graph, on the other hand, shows the percentage of respondents per industry whose company has either already invested in big data, plan to in 1 or 2 years, did not have any plans at the time or did not know.
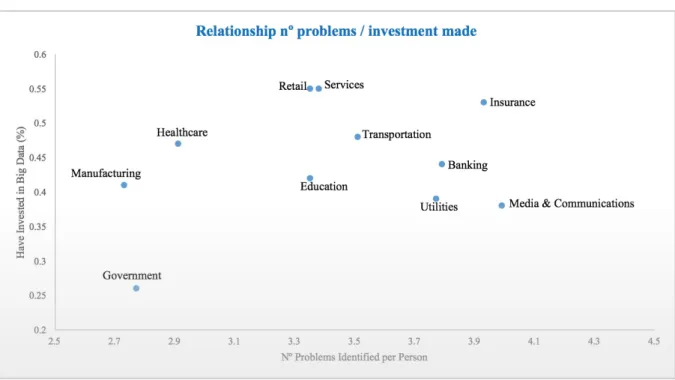
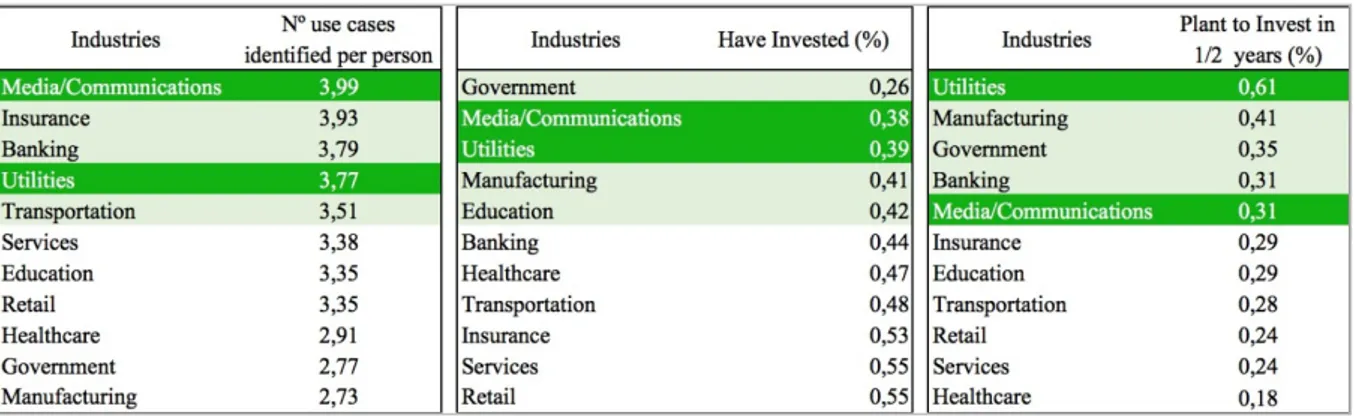
Media and Communication (3.99), Services (3.38), Government (2.77), Education (3.35), Retail (3.35), Banking (3.79), Insurance (3.93), Healthcare (2.91), Transportation (3.51) and Utilities (3.77). The second step consisted of plotting an (X,Y) scatter plot with this information in one axis and the portion of each industry’s respondents that have already invested in big data in the other, which was obtained from the Big Data investment – industry graph. Those percentages of respondents that have already invested were directly extracted and are: Manufacturing and Natural Resources (41%), Media and Communication (38%), Services (55%), Government (26%), Education (42%), Retail (55%), Banking (44%), Insurance (53%), Healthcare (47%), Transportation (48%) and Utilities (39%). The resulting scatter plot was the following in Figure 5:
Figure 5: Relation between the number of problems identified per person, and the percentage of respondents
claiming they have already invested in Big Data.
expectation, since it is used to represent the behavior of a set of data to determine if there is a certain pattern. In this case, however, the R2 value of the line was less than 0.1, meaning the data points do not follow any significant pattern and, thus, the trendline was irrelevant – please refer to Appendix 7 for the presentation of the graph with the trendline and the R2.
Given this constraint, my next approach was to divide the graph area into 4 quadrants, built with two lines corresponding to the median of each axis (3.38 and 44%). In this case, I was interested in the industries in the lower right quadrant – it included the industries that were both on the top half of the number of problems and on the lower half of the percentage that had already invested in big data. We can see below in Figure 6 that Utilities and Media & Communications are the only industries inside that quadrant.
Figure 6: Relation between the nº of problems identified per person, and the percentage of respondents
claiming they have already invested in Big Data, divided in quadrants.
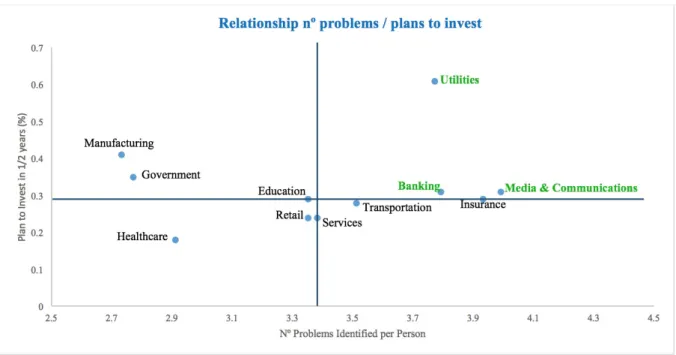
plotted a graph with the same x-axis as the first one - Nº Problems Identified per Person – and this new variable (the correlation between “have invested” and “plan to invest in 1 or 2 years” is -0.48, so they are not significantly correlated). For the same reasons as above – low R2 of the trendline – I also divided this graph in 4 quadrants – please refer to Appendix 8 for the calculations and graphs, with the trendline and the R2.
In this case, the relevant quadrant was the top right one, which included the industries with more big data problems and more plans to invest in big data. We can see below in Figure 7 that it confirms the attractiveness of the Utilities and Media & Communications industries, while also including Banking.
Figure 7: Relation between the nº of problems identified per person, and the percentage of respondents
that plan to invest in big data in the following 1 and 2 years, divided in quadrants.
If we look at the data in another format, we can confirm the potential of these 2 industries. Below, in Figure 8, are 3 tables, one for each of the criteria in the graphs, ordered from best to worst. We can see that Utilities and Media & Communications are the only ones that appear in the top 5 of each table.
Figure 8: The top 5 industries in each of the 3 criteria, and what they have in common.
Big Data in Utilities
Investopedia (2016) defines Utilities as the sector containing “companies such as electric, gas and water firms, and integrated providers”. R&D Mag reveals that analyst firm GTM Research predicts global utility company expenditure on data analytics will grow from $700 million in 2012 to $3.8 billion in 2020 (R&D Mag, 2015).
The two main areas where Big Data seems to be gaining critical importance in the industry are operational efficiency and understanding customer’s behaviors, while some authors also highlight the identification and prevention of theft and fraud – (Hadoop Summit, 2014 & IBM, 2014). R&D Mag says that “as smart grids and meters become more common across the industry, the amount of data available to be gathered and analyzed will skyrocket – reaching hundreds of terabytes every year”. Big data proves to be highly useful because of its ability to turn information from smart meter and smart grid projects into meaningful operational insights regarding the most efficient ways to managing their infrastructure and enabling the delivery of better and more personalized services to customers. The Fortune 1000 provider of data warehousing Teradata (2016) highlights the implementation of the smart grid, the tracking of usage patterns in real-time for predictable delivery, and optimal pricing, as the main use cases.
These devices are part of a wider technology revolution - smart grids. The grids we’ve had so far were built in the 19th century for simpler energy needs, and consisted of a network of transmission lines that delivered electricity from the power plant to homes or businesses – a one-way interaction. With the increase in the usage of technological devices in the past decade or so, electricity needs have significantly changed, and this limitation makes it difficult for the grid to respond to the rising and ever-changing energy demands. That is where the “smart” is added to the grids, to allow a two-way dialogue between utilities and its customers, where besides electricity, information is also exchanged through new technological equipment. The goal is to improve operations and maintenance, reduce costs, integrate renewable energy systems, and improve planning. SmartGrid.gov (2016) claims it “will consist of millions of pieces and parts – controls, computers, power lines, and new technologies and equipment” - refer to Appendix 10 for an example of a smart grid.
One of the main advantages of these technologies is automation. Analog meters and traditional grids with sensors used to be read manually, which meant that certain issues could go undetected for long periods of time. A common timing for a smart meter reading is 15 minutes, compared to monthly manual readings, resulting in a significant increase in the amount of data collected.
Digging deeper into the benefits of Big Data for business, CapGemini (2010), a technology consulting company, highlights the following:
Ø Demand Response – enabling customers to contribute to energy load reduction during times of peak demand;
Ø Revenue Management – ensuring all meters are accounted for and billed correctly;
Ø Compliance – providing consistent, complete and accurate reports on operational KPIs due to regulatory requirements;
Ø Asset Maintenance and Management – identifying potential problems in grid and power supply equipment to extend the life of expensive assets and avoid unplanned interruptions;
Ø Customer Care and Management – developing tailored pricing plans and provide incentives for customers to use energy efficiently;
Ø Forecasting and Load Management – minimizing expensive spot market purchases of power, and effectively managing their operations through data on consumption, weather, and supply constraints.
There is an abundance of data across the energy network, whether at the point of energy generation - wind, solar, coal, natural gas, hydro - or energy consumption - residential appliances and commercial equipment (Dell EMC, 2015).
Results Discussion
Our capacity to deal with big amounts of data in real-time, from different sources and formats, has the potential to help utility companies achieve the above-mentioned benefits. With our Machine Learning component, they will also be able to perform predictive analytics using an immense amount of data, ensuring its accuracy and reliability. Since utility companies receive their data from a wide range of devices, scattered across a vast geographic area, PKNOA can start building its market reputation by focusing on integrating smart devices data with the remaining data sources they have at their disposal, to offer the most reliable, timely and efficient analysis possible. Because of our complete architecture, we also provide a simpler solution that can facilitate the entire data gathering and analysis operations.
1) PKNOA already has an established relationship with the Portuguese utilities company EDP, currently operating in 14 countries. Our company was incubated by EDP Starter, the entrepreneurship ecosystem of EDP, which was also our partner at Web Summit 2016. Moreover, we are currently negotiating several projects to help them analyze data from sensors in the production grid. Besides operating in the most attractive sector, EDP also operates on the top 1 country of PKNOA Ranking – the United States. In 2007, EDP Renováveis acquired Horizon Wind Energy LLC and has since then duplicated the production of wind energy. Headquartered in Houston, Texas, EDPR is one of the biggest energy producers worldwide, with the United States being its biggest market (EDPR, 2016). This makes EDP a great entry point for the US market, and the ideal company for PKNOA to follow the strategy proposed in this report.
2) Data from smart devices brings us to a broader topic, equally important as and very related with Big Data, which is the Internet of Things. IoT Agenda’s (2016) website defines the Internet of Things as “a system of interrelated computing devices, mechanical and digital machines, objects, animals or people that are provided with unique identifiers and the ability to transfer data over a network”. Utilities are at the intersection of the “Internet of Things” and Customer Behavioral Analytics, claims Dell ECM, with the opportunity to couple robust customer energy and water usage data with data from intelligent devices and the smart grid to create entirely new value propositions. Smart homes, wearables, smart cities, industrial internet, connected cars, connected health, smart retail, smart supply chain and smart farming (IoT Analytics, 2015) are the most popular IoT applications according to IoT Analytics, and show how acquiring expertise and market recognition in this field can ease PKNOA’s entrance into many other sectors.
data. If PKNOA focuses on the utilities sector, it will inevitably gain a great deal of knowledge about telecommunications - note that Media & Communications was the second most promising industry in the industry analysis. Thus, this could represent the second focus area for the company – Telecommunications. Cloudera (2015) says that the number of connected devices is expected to reach 50 billion by 2020, with Communications Service Providers playing a key role in managing the connectivity requirements. Due to their proximity to data generation, CSPs “can play a dominant role across the value chain from collecting the streaming data, to processing, storing, analyzing and serving intelligence”. They go on to say that “with petabytes of data streaming in multiple formats in real-time from sensors across multiple geographies” they are “in the forefront driving the evolution of key IoT concepts including connected homes, connected cars, e-health and smart cities”: So, after establishing itself in the utilities sector, PKNOA can target telecommunications companies by leveraging the expertise it will gain.
Final Recommendation
Reference List
British Gas. 2016. “What are Smart meters?”.
www.britishgas.co.uk/smarter-living/control-energy/smart-meters/what-are-smart-meters.html (accessed December 6, 2016)
Capgemini. 2010. “Smart Analytics for the Utility Sector”.
www.slideshare.net/hbosker/smart-analytics-for-the-utility-sector (accessed November 9, 2016)
Cloudera. 2015. “Big Data Use Cases for Telcos”.
https://www.cloudera.com/content/dam/cloudera/Resources/PDF/solution-briefs/Industry-Brief-Big-Data-Use-Cases-for-Telcos.pdf (accessed December 1, 2016)
Civi, Emin, Elif S. Persinger, and Suzanne W. Vostina. 2007.“The Born Globals Entrepreneur In Emerging
Economies”. International Business & Economics Research Journal. October 19 www.cluteinstitute.com/ojs/index.php/IBER/article/view/3355/3402
Dell EMC. 2015. “Big Data in the Utilities Industry”.
https://infocus.emc.com/william_schmarzo/big-data-utilities-industry/ (accessed December 13, 2016)
EDPR. 2016. “Os Nossos Mercados: EUA”. www.edpr.com/pt-pt/negocio/os-nossos-mercados/eua/ (accessed December 22, 2016)
Education First. 2016. “English Proficiency Index”. www.ef.edu.pt/epi/ (accessed September 16, 2016)
Gartner. 2016. “About Gartner”. www.gartner.com/technology/about.jsp (accessed November 11, 2016)
Gartner. 2015. “Newsroom: Gartner Survey Shows More Than 75 Percent of Companies Are Investing or
Planning to Invest in Big Data in the Next Two Year”. www.gartner.com/newsroom/id/3130817 (accessed November 11, 2016)
Hadoop Summit. 2014. “Smart Meter Data Analytic Using Hadoop”.
www.slideshare.net/Hadoop_Summit/smart-meter-data-analytic-using-hadoop (accessed November 8, 2016)
IBM Big Data and Analytics Hub. 2013. “Infographics & Animations: The Four V’s of Big Data”.
www.ibmbigdatahub.com/infographic/four-vs-big-data (accessed October 2, 2016)
IBM. 2014. “Transforming Energy and Utilities through Big Data & Analytics”.
www.slideshare.net/AndersQuitzauIbm/big-data-analyticsin-energy-utilities (accessed November 8, 2016)
IDC. 2016. “Worldwide Big Data and Business Analytics Revenues Forecast to Reach $187 Billion in 2019,
According to IDC”. www.idc.com/getdoc.jsp?containerId=prUS41306516 (accessed November 25, 2016)
InformationWeek. 2016. “Big Data, Analytics Sales Will Reach $187 Billion By 2019”.
www.informationweek.com/big-data/big-data-analytics/big-data-analytics-sales-will-reach-$187-billion-by-2019/d/d-id/1325631 (accessed October 11, 2016)
Investopedia. 2016. “Utilities Sector”. www.investopedia.com/terms/u/utilities_sector.asp (accessed November
19, 2016)
IoT Agenda. 2016. “Internet of Things (IoT)”.
http://internetofthingsagenda.techtarget.com/definition/Internet-of-Things-IoT (accessed December 15, 2016)
IoT Analytics. 2015. “The 10 most popular Internet of Things applications right now”.
https://iot-analytics.com/10-internet-of-things-applications/ (accessed December 15, 2016)
MindTools. 2016. “PEST Analysis”. www.mindtools.com/pages/article/newTMC_09.htm (accessed October
14, 2016)
R&D Mag. 2015. “Big Data: The Future of Energy and Utilities”.
www.rdmag.com/article/2015/10/big-data-future-energy-and-utilities (accessed December 6, 2016)
SAS. 2016. “Machine Learning: What it tis and why it matters”
www.sas.com/en_us/insights/analytics/machine-learning.html (accessed October 2, 2016)
SmartGrid.gov. 2016. “What is the Smart Grid”. www.smartgrid.gov/the_smart_grid/smart_grid.html
(accessed November 20, 2016)
Teradata. 2016. “Utilities”. www.bigdata.teradata.com/US/Big-Ideas/Industries/Utilities/ (accessed November
19, 2016)
uSwitch. 2016. “Smart meters explained”. www.uswitch.com/gas-electricity/guides/smart-meters-explained/
(accessed November 19, 2016)
World Economic Forum. 2015. “The Global Competitiveness Report 2015-2016”.
www3.weforum.org/docs/gcr/2015-2016/Global_Competitiveness_Report_2015-2016.pdf (accessed September 4, 2016)
World Economic Forum. 2016. “Our Mission: The World Economic Forum”.