Genetic effects for maize traits in acid and non-acid soils
Juan C. Pérez Velásquez
1, Cláudio Lopes de Souza Jr.
2, Luis A. Narro
3, Shivaji Pandey
4and Carlos De León
41
International Center for Tropical Agriculture, Cali, Colombia.
2
Departamento de Genética, Escola Superior de Agricultura “Luiz de Queiroz”,
Universidade de São Paulo, Piracicaba, SP, Brazil.
3
Centro Internacional de Mejoramiento de Maiz y Trigo, Cali, Colombia.
4Centro Internacional de Mejoramiento de Maiz y Trigo, D.F., México.
Abstract
Breeding programs for acid-soil tolerance are desirable as a relatively inexpensive and permanent way for increasing maize (Zea mays L.) yield on these soils. Our objective was to compare the genetic effects controlling the expression of maize traits in acid and non-acid soils. Seven related and one unrelated inbred lines, with different levels of toler-ance to acid soil, and their F1, F2, BC1, and BC2generations were evaluated in four acid and two non-acid soils.
Esti-mates of additive, dominance, and epistatic effects were computed for grain yield, plant height, days to mid-silk, and prolificacy, using the generation means analysis procedure. For all traits the major part of the variation was ac-counted for by additive and dominance effects, with dominance effects being more important than additive and epistatic effects for both acid and non-acid soils. Epistatic effects were significant for some crosses only, being more pronounced for plant height than for the other traits. Furthermore, epistatic effects were randomly distributed among the crosses and were not related to the grain yield of the single-crosses (F1’s) and to the genetic relationships of the
inbreds in either type of soil. The results suggest that similar pooled gene effects control the expression of the traits assessed in both acid and non-acid soils.
Key words:acid soils, additive, dominant, epistatic effects, generation analysis.
Received: June 8, 2007; Accepted: August 21, 2007.
Introduction
Soil acidity is a major yield-limiting factor for many crops and covers extensive areas in tropical, subtropical and temperate zones, with acid soils occupying about 3.95 billion hectares (about 30%) of the world’s ice-free land area (Von Uexkull and Mutert, 1995). The lower yield of crops grown in acid soils is because of combinations of low pH, toxicity of Al, Mn, and Fe, and deficiencies of N, P, Ca, and Mg. However, Al toxicity is the main problem because it inhibits maize root growth, reducing the water and nutri-ent uptake and interferes in differnutri-ent physiological process of crop development (Royet al., 1988). About 20 million hectares of maize are currently grown under acid soils in the world (Von Uexkull and Mutert, 1995), and different strategies have been suggested to improve the productivity of these soils including lime application and the
develop-ment of tolerant cultivars (Bahia Filhoet al., 1997; Pandey and Gardner, 1992; Pandeyet al., 2007).
Genetic variation for tolerance to soil acidity has been reported in several studies using different germplasm, dif-ferent traits and difdif-ferent genetic analyses. Galvão and Silva (1978) reported that dominance variance was more important than additive variance for shoot and root dry weight in Al-stressed nutrient solution. Duque-Vargas et al.(1994), Borreroet al.(1995) and Narroet al.(2000) re-ported that dominance variance was either similar to or of greater importance than additive variance for yield under acid soils. On the other hand, reported results from diallel crosses studies carried out in acid soils have shown that for grain yield the general combining ability (additive effects) accounted for the major part of the total genetic variance, although specific combining ability (non-additive effects) were also significant, indicating that additive effects were more important than dominance and epistatic effects (Mag-navacaet al., 1987a; Naspolini Filhoet al., 1981; Lopeset al., 1987; Eleutérioet al., 1988; Pandeyet al., 1994; Sa-lazaret al., 1997). Generation means analysis has also been
Send correspondence to Cláudio Lopes de Souza Jr. Departa-mento de Genética, Escola Superior de Agricultura “Luiz de Quei-roz”, Universidade de São Paulo, Caixa Postal 83, 13.400-970 Piracicaba, SP, Brazil. E-mail: [email protected].
used to estimate genetic effects from crosses between maize inbreds with different levels of tolerance to acid soil. Magnavacaet al.(1987b) reported that for relative seminal root length, additive effects accounted for the largest part of the variation, although dominance effects were significant in all instances and epistatic effects were significant in some crosses, but the magnitudes of the latter were lower than either additive or dominance effects. Ceballoset al.
(1998) reported that for grain yield the additive-dominance model accounted for 91.1% of the variation in non-acid soils and 70.0% of the variation in acid soils, and that epistatic effects were more important in acid than in non-acid soils. Pandeyet al.(2007) reported that the inheritance studies for grain yield in acid soils indicate that both addi-tive and dominance effects are more important than epis-tatic effects.
Recurrent selection has been effective to improve maize grain yield in acid soils. Limaet al.(1992) reported that two cycles of mass selection for increasing radicle length in Al-stressed nutrient solution resulted in grain yield improvement in acid soils by 0.59 t ha-1cycle-1(7.6% cy-cle-1). Granadoset al.(1993) reported yield improvement of 2.0% cycle-1after 14 cycles of modified ear-to-row selection and 7.0% cycle-1after two cycles of full-sib selection in acid soils. Ceballoset al.(1995) reported an average improve-ment of 4.9% cycle-1for grain yield in acid soils after two cy-cles of full-sib selection in five tropical maize populations.
The inheritance of several important traits in maize evaluated under non-acid soils has been well documented (Hallaueret al., 1988; Hallauer and Miranda Filho, 1988). Despite the large area of acid soils in South America and Africa, the information on the inheritance of maize agro-nomic traits in acid soils is quite limited. Thus, this research was conducted to estimate additive, dominance, and epis-tatic effects for several traits in maize in acid and in non-acid soil environments and to compare the inheritance of these traits in both environments.
Materials and Methods
Eight S8maize inbred lines, selected from a group of
100 lines evaluated in Colombia during 1995 in acid-soils at Villavicencio (55% Al saturation, 10 mg kg-1P), and Santan-der de Quilichao (45% Al saturation, 10 mg kg-1P) and in non-acid soils at Palmira ,Colombia, were used in this study. The traits used for selection were grain yield (t ha-1) and a score for tolerance to acid soils, 1 being highly tolerant and 5 highly sensitive. Seven inbred lines were derived from the same full-sib family from population SA4 and one inbred line from population SA5. Populations SA4 and SA5 are in different heterotic groups, adapted to tropical environments and have been improved using full-sib or S1family recurrent
selection (Pandey et al., 1995). Based on the mean grain yield in acid soil the inbreds were assigned into three groups: G1 which includes tolerant inbreds L1, L5 and L7; G2 in-cludes sensitive inbreds L2, L3, L4 and L8; and G3, inin-cludes
the moderately tolerant inbred L6. Inbreds of G1 and G2 consisted of sister lines because they were derived from the same full-sib family from SA4 population and L6 (G3) was derived from the SA5 population. In 1996 and 1997 growing seasons, the F1, F2, BC1, and BC2generations were
devel-oped for all crosses between these lines. The F1’s were
devel-oped using a diallel mating scheme and at least 15 ears were saved to represent each F1. The F2was developed by selfing
the F1; BC1and BC2refer to backcrosses of the F1to P1and to
P2, respectively. At least 20 ears were saved for each of the
F2, BC1and BC2generations. Thus, the experiment included
120 entries,i.e., eight inbred lines, 28 F1’s, 28 F2’s, and 56
BC’s.
The 120 entries were evaluated in 1997, 1998 and 1999 growing seasons in four acid and two non-acid soil environments. Acid soil environments in Colombia were at Villavicencio in 1997 and 1998, at Santander de Quilichao in 1997 and at Sete Lagoas in Brazil in 1999. Non-acid soil environments were at Palmira, Colombia, in 1997 and 1998 (Table 1). The design used was the randomized complete block design with three replications per environment. Gen-erations were allocated to different blocks and randomized independently. Plots were 2.5 m long and spaced 0.75 m be-tween plots. Depending on the genetic uniformity of each generation, the plots had different number of rows. For the P1, P2, F1, BC1and BC2generation the plots were two rows,
whereas for the F2generations four-row plots were used.
The plots were overplanted and thinned to 20 plants plot-1 for the P1, P2, F1, BC1and BC2generations and to 40 plants
plot-1for the F2generation.
Data were recorded for grain yield (t ha-1), plant height (cm plant-1), stand (plants plot-1), grain moisture (g kg-1), number of ears per plot and number of days to mid-silk. Plant height was recorded in five competitive plants per plot, from the soil surface to the tip of the highest tassel branch, and the plot means were used for analysis. Prolificacy was computed per plot by the ratio number of ears per plot/stand. Days to mid-silk was recorded as the number of days from sowing to 50% of plants plot-1with silk extrusion. Grain yield of each plot was adjusted for av-erage stand by covariance analyses and for 150 g kg-1of grain moisture.
Analyses of variances were performed for each envi-ronment and combined across envienvi-ronments for acid and for non-acid soils for each trait. In the combined analyses, environments and genotype by environment interaction were considered as random effects and genotypes as fixed effects. Genotypes sums of squares were orthogonally par-titioned into parental lines, generations F1, F2, BC1, BC2
Means of each generation across acid soil and across non-acid soil environments were independently subjected to generation mean analysis (Mather and Jinks, 1982). Fol-lowing Gamble’s (1962a) notation, the model used was:
gk=m+ (α)a+ (β)d+ (α2
)aa+ (αβ)ad+ (β2
)dd, wheregkis the mean across environments of thekth generation,mis the mean of two contrasting homozygotes (inbred parents),
ais the pooled additive effect,dis the pooled dominance effect,aais the pooled additive x additive effect,adis the pooled additive x dominance effect, andddis the pooled dominance x dominance effect;αandβare the coefficients of the genetic effects relating each generation to its mean.
Estimates of additive, dominance and epistatic effects were computed for each cross by weighted least square re-gression analysis (Mather and Jinks, 1982) using the equa-tion b = (X’ D-1X)-1(X’ D-1y), where b is the vector of genetic effects (m,a, d, aa, ad,anddd),Xis the incidence matrix of the genetic effects coefficients (α,β,α2
,αβ, and
β2),yis the column vector of the generation means andD-1 is a weighted diagonal matrix, where the diagonal elements were the reciprocals of the variances of each generation mean (Wi), computed for each generation (P’s, F1’s, F2’s,
and BC’s) as the generation by environment interaction mean squares (MSIi) divided by the number of locations (L)
and replications (R);i.e.: Wi= (MSIi/LR)-1.
Estimates of additive, dominance and epistatic effects were computed by analyzing the sequential sums of squares calculated from the addition of each genetic effect in the model. The relative importance of the genetic effect esti-mates was determined using the ratio of the sequential sum of squares and total sum of squares, after sequentially enter-ing the different effects into the model. A Chi-square (χ2
) test was used to examine the adequacy of a reduced model with only additive (a) and dominance (d) effects. Whenever the chi-square test was significant, the epistatic effectsaa,
ad, andddwere incorporated sequentially into the model (Allen and Cady, 1982). Standard errors of the estimates of the genetic effects were obtained from the diagonal ele-ments ofW= [(X’ D-1X)-1]1/2matrix.
Results and Discussion
Means and analyses of variance
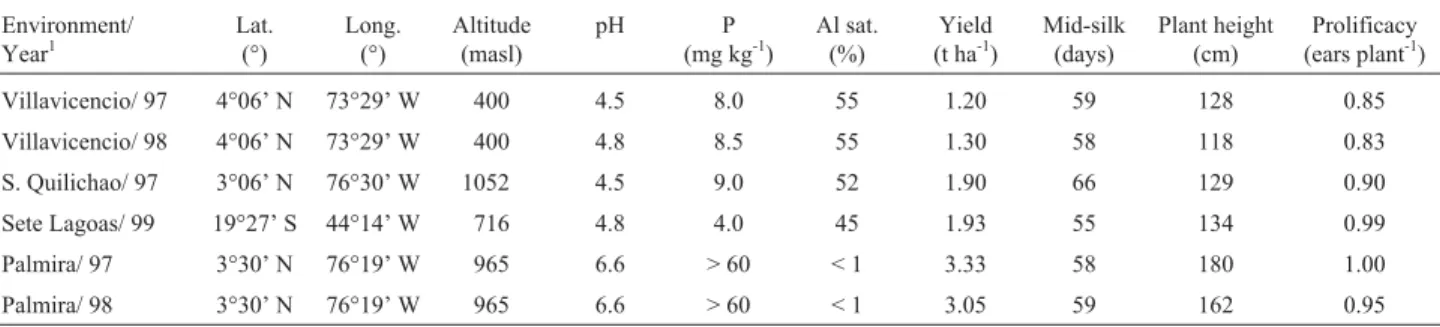
Average grain yield in the non-acid soil was highly significantly (p = 0.01) greater than the average of the acid soil environments (3.19 t ha-1vs.1.58 t ha-1). Average grain yield of the tolerant set (G1) of parental inbreds (1.10 t ha-1) presented highly significant differences from the sensitive set (G2) of parental inbreds (0.67 t ha-1) in acid soils, indi-cating that the selection within a full-sib family for toler-ance to acid soil environments was effective. In non-acid soils, parental inbreds mean yields of G1 (1.30 t ha-1) and G2 (1.00 t ha-1) did not differ significantly. Plant height (171 cm plant-1 vs.127 cm plant-1) and prolificacy (0.98 ears plant-1 vs. 0.89 ears plant-1) were also significantly (p = 0.05) greater in non-acid than in acid soils. For days to mid-silk there was no difference between the two soil types (59vs.60 days) (Table 1).
For all generations, the mean grain yield decreased significantly in acid relative to the non-acid soil environ-ments. Grain yield means in non-acid soil and acid soil en-vironments were 1.14 t ha-1and 0.86 t ha-1for the parents; 4.18 t ha-1 and 1.97 t ha-1 for the F1’s; 3.02 t ha-1 and
1.52 t ha-1for the F2’s; and 3.07 t ha-1and 1.52 t ha-1for the
average of BC’s, respectively (Table 2). The detrimental effects of soil acidity on maize grain yield have been re-ported by Granados et al. (1993), Duque-Vargas et al.
(1994), Borreroet al.(1995), Ceballoset al.(1998). The combined analyses of variance across environ-ments (data not shown) showed significant differences among environments for all traits evaluated in acid and non-acid soils. In acid soils, highly significant differences were detected for parental inbreds, F1’s, F2’s, BC’s, and
among generations for grain yield, days to mid-silk and plant height, whereas for prolificacy inbreds and among generations were not significant. For grain yield all genera-tions and among generagenera-tions interacted significantly with environments, whereas for days to mid-silk only the F2’s
generation were not significant and for plant height and prolificacy only among generations were significant. In
Table 1- Environmental characteristics and overall means for maize grain yield, mid-silk, plant height and prolificacy, evaluated in four acid soil and at two non-acid soils environments in Brazil and Colombia.
Environment/ Year1
Lat. (°)
Long. (°)
Altitude (masl)
pH P
(mg kg-1)
Al sat. (%)
Yield (t ha-1)
Mid-silk (days)
Plant height (cm)
Prolificacy (ears plant-1)
Villavicencio/ 97 4°06’ N 73°29’ W 400 4.5 8.0 55 1.20 59 128 0.85
Villavicencio/ 98 4°06’ N 73°29’ W 400 4.8 8.5 55 1.30 58 118 0.83
S. Quilichao/ 97 3°06’ N 76°30’ W 1052 4.5 9.0 52 1.90 66 129 0.90
Sete Lagoas/ 99 19°27’ S 44°14’ W 716 4.8 4.0 45 1.93 55 134 0.99
Palmira/ 97 3°30’ N 76°19’ W 965 6.6 > 60 < 1 3.33 58 180 1.00
Palmira/ 98 3°30’ N 76°19’ W 965 6.6 > 60 < 1 3.05 59 162 0.95
1
non-acid soils all generations and among generations were highly significant, except parental inbreds, for grain yield, mid-silk, and prolificacy; also for prolificacy only the F2’s
and BC’s were significant. The partitioned generation by environment interactions was not significant for parental inbreds for all traits, except prolificacy; for the F1’s
signifi-cance was detected only for grain yield and prolificacy; for the F2’s no significance was detected for all traits; for the
BC’s interaction was significant for grain yield and mid-silk; and for among generations all traits interacted significant with environments, except plant height.
Genetic effects
The genetic analysis across acid soil and non-acid soil environments showed that for most of the crosses a large proportion of the total sum of squares (R2) for grain yield
was accounted for by additive and dominance effects. In acid soils theR2values averaged 93.2% and ranged from 49.5% to 99.9%, while in non-acid soils theR2values aver-aged 96.0% and ranged from 78.7% to 99.9%. Theχ2
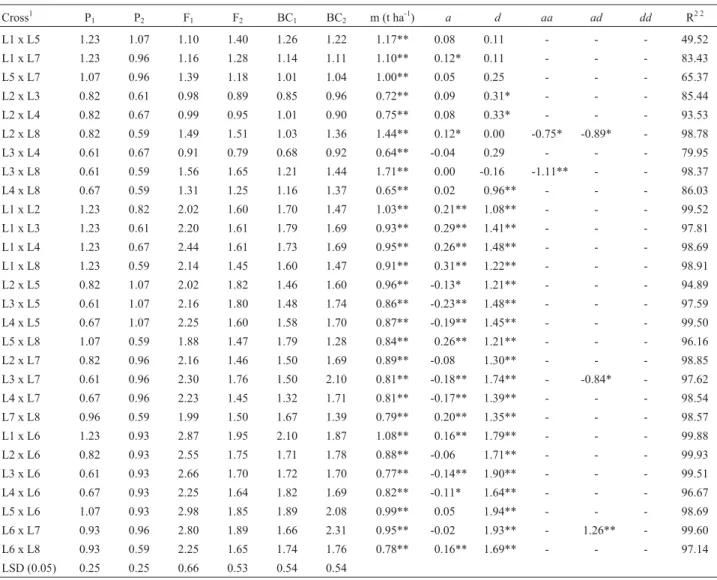
val-ues for the three-parameter model (m, a, d) were non-significant for 24 (85.7%) and for 22 (78.6%) out of the 28 crosses in acid and non-acid soils, respectively. Therefore, the three-parameter model explained a major portion of to-tal genetic variation for grain yield in acid and non-acid soils. In acid soils, two crosses involving related inbreds within the G1 group and one cross within the G2 group did not show any significant genetic effects except the mean parameter (Tables 2 and 3).
In acid soils pooled additive genetic effects for grain yield were significant for 17 out of the 28 crosses (60.7%). The magnitude in absolute values of the additive effects
Table 2- Means of six maize generations using eight inbreds with different levels of tolerance to acid soils, and estimates of mean (m), additive (a), domi-nance (d) and epistatic (aa,ad,dd) effects, for grain yield evaluated in four acid soils environments in Brazil and Colombia.
Cross1 P1 P2 F1 F2 BC1 BC2 m (t ha -1
) a d aa ad dd R2 2
L1 x L5 1.23 1.07 1.10 1.40 1.26 1.22 1.17** 0.08 0.11 - - - 49.52
L1 x L7 1.23 0.96 1.16 1.28 1.14 1.11 1.10** 0.12* 0.11 - - - 83.43
L5 x L7 1.07 0.96 1.39 1.18 1.01 1.04 1.00** 0.05 0.25 - - - 65.37
L2 x L3 0.82 0.61 0.98 0.89 0.85 0.96 0.72** 0.09 0.31* - - - 85.44 L2 x L4 0.82 0.67 0.99 0.95 1.01 0.90 0.75** 0.08 0.33* - - - 93.53
L2 x L8 0.82 0.59 1.49 1.51 1.03 1.36 1.44** 0.12* 0.00 -0.75* -0.89* - 98.78
L3 x L4 0.61 0.67 0.91 0.79 0.68 0.92 0.64** -0.04 0.29 - - - 79.95
L3 x L8 0.61 0.59 1.56 1.65 1.21 1.44 1.71** 0.00 -0.16 -1.11** - - 98.37
L4 x L8 0.67 0.59 1.31 1.25 1.16 1.37 0.65** 0.02 0.96** - - - 86.03
L1 x L2 1.23 0.82 2.02 1.60 1.70 1.47 1.03** 0.21** 1.08** - - - 99.52
L1 x L3 1.23 0.61 2.20 1.61 1.79 1.69 0.93** 0.29** 1.41** - - - 97.81
L1 x L4 1.23 0.67 2.44 1.61 1.73 1.69 0.95** 0.26** 1.48** - - - 98.69
L1 x L8 1.23 0.59 2.14 1.45 1.60 1.47 0.91** 0.31** 1.22** - - - 98.91
L2 x L5 0.82 1.07 2.02 1.82 1.46 1.60 0.96** -0.13* 1.21** - - - 94.89 L3 x L5 0.61 1.07 2.16 1.80 1.48 1.74 0.86** -0.23** 1.48** - - - 97.59
L4 x L5 0.67 1.07 2.25 1.60 1.58 1.70 0.87** -0.19** 1.45** - - - 99.50
L5 x L8 1.07 0.59 1.88 1.47 1.79 1.28 0.84** 0.26** 1.21** - - - 96.16
L2 x L7 0.82 0.96 2.16 1.46 1.50 1.69 0.89** -0.08 1.30** - - - 98.85
L3 x L7 0.61 0.96 2.30 1.76 1.50 2.10 0.81** -0.18** 1.74** - -0.84* - 97.62
L4 x L7 0.67 0.96 2.23 1.45 1.32 1.71 0.81** -0.17** 1.39** - - - 98.54
L7 x L8 0.96 0.59 1.99 1.50 1.67 1.39 0.79** 0.20** 1.35** - - - 98.57
L1 x L6 1.23 0.93 2.87 1.95 2.10 1.87 1.08** 0.16** 1.79** - - - 99.88
L2 x L6 0.82 0.93 2.55 1.75 1.71 1.78 0.88** -0.06 1.71** - - - 99.93
L3 x L6 0.61 0.93 2.66 1.70 1.72 1.70 0.77** -0.14** 1.90** - - - 99.51 L4 x L6 0.67 0.93 2.25 1.64 1.82 1.69 0.82** -0.11* 1.64** - - - 96.67
L5 x L6 1.07 0.93 2.98 1.85 1.89 2.08 0.99** 0.05 1.94** - - - 98.69
L6 x L7 0.93 0.96 2.80 1.89 1.66 2.31 0.95** -0.02 1.93** - 1.26** - 99.60
L6 x L8 0.93 0.59 2.25 1.65 1.74 1.76 0.78** 0.16** 1.69** - - - 97.14
LSD (0.05) 0.25 0.25 0.66 0.53 0.54 0.54
*, **Significant at p = 0.05 and at p = 0.01, respectively.
1L1, L5 and L7 belong to G1 (tolerant), and L2, L3, L4 and L8 belong to G2 (sensitive), both groups derived from SA4 population. L6 was derived from
SA5 population.
2
were larger for crosses among tolerant (G1) x sensitive (G2) related lines from the same full-sib family (0.21 t ha-1), than for crosses of unrelated SA5 x SA4 lines (0.10 t ha-1), and, also, larger than G1 x G1 related crosses (0.08 t ha-1) and than G2 x G2 related crosses (0.06 t ha-1). In non-acid soil, estimates of additive effects were signifi-cant only for six out of 28 crosses (21.4%); thus, the pooled additive effects were more important in acid than in non-acid soils to explain the genetic variation among genera-tions. However, the mean additive effects for acid soils did not differ significantly from that of non-acid soil (1.34 t ha-1
vs.1.39 t ha-1), suggesting that the estimates of the pooled additive effects were not affected by soil acidity. Also, the relatedness or the tolerance/sensitivity of the parental inbreds to acid soils had no effect on the estimates of the ad-ditive effects under non-acid soils (Tables 2 and 3).
The pooled dominance effects for grain yield were significant for 22 (78.6%) and for 28 (100%) crosses in acid and non-acid soils, respectively. The magnitude of these ef-fects was greater than the mean parameter, except for eight crosses in acid soil and six crosses in non-acid soil. Also, these effects were positive for most of the crosses, except for two crosses in acid and one cross in non-acid soil. For acid soil the significant dominance effects averaged 1.11 t ha-1and ranged from 0.31 t ha-1to 1.94 t ha-1, whereas for non-acid soil the dominance effects averaged 3.06 t ha-1and ranged from -0.99 t ha-1to 6.95 t ha-1. Thus, contrary to the additive effects, the magnitudes of the dominance effects were significantly affected by soil acidity. Also, the pooled dominance effects were dependent on the genetic related-ness and on the level of sensitivity to soil acidity of the pa-rental inbreds. Crosses including unrelated (G1 x G3 and
Table 3- Means of six maize generations using eight inbreds with different levels of tolerance to acid soils, and estimates of mean (m), additive (a), domi-nance (d) and epistatic (aa,ad,dd) effects, for grain yield evaluated in two non-acid soils environments in Colombia.
Cross1 P1 P2 F1 F2 BC1 BC2 m (t ha -1
) a d aa ad dd R2 2
L1 x L5 1.26 1.14 1.93 1.97 2.09 2.17 1.26** 0.05 1.20** - - - 78.72
L1 x L7 1.26 1.50 2.15 2.31 2.20 2.30 1.44** -0.12 1.25** - - - 80.96
L5 x L7 1.14 1.50 2.02 2.00 1.84 2.10 1.36** -0.19 -0.99** - - - 88.84
L2 x L3 1.29 0.85 2.35 2.00 1.99 1.65 1.09** 0.23* 1.46** - - - 96.56 L2 x L4 1.29 0.78 2.28 2.02 2.37 1.73 1.08** 0.28* 1.60** - - - 91.58
L2 x L8 1.29 1.10 3.07 2.14 2.11 2.76 1.21** 0.04 2.04** - - - 91.83
L3 x L4 0.85 0.78 2.16 1.53 1.20 1.87 0.82** -0.02 1.39** - - - 89.51
L3 x L8 0.85 1.10 3.30 2.82 2.33 2.89 2.39** -0.16 0.97** -1.41* - - 98.82
L4 x L8 0.78 1.10 3.11 2.42 2.08 2.60 0.98** -0.19 2.49** - - - 96.41
L1 x L2 1.26 1.29 4.87 3.41 3.33 3.34 1.31** -0.01 3.87** - - - 99.10
L1 x L3 1.26 0.85 4.19 3.41 3.21 3.34 2.71** 0.18 1.60* -1.64** - - 99.10
L1 x L4 1.26 0.78 4.48 3.00 2.97 3.39 1.06** 0.19 3.79** - - - 97.28
L1 x L8 1.26 1.10 4.00 2.66 2.59 3.12 1.20** 0.03 2.98** - - - 97.33
L2 x L5 1.29 1.14 5.06 3.42 3.47 3.29 1.24** 0.08 4.09** - - - 99.37 L3 x L5 0.85 1.14 4.27 3.29 3.35 3.54 2.49** -0.15 2.01* -1.46* - - 98.19
L4 x L5 0.78 1.14 5.02 3.40 3.10 3.50 1.00** -0.20 4.39** - - - 98.92
L5 x L8 1.14 1.10 4.40 3.16 2.98 3.40 1.17** -0.01 3.66** - - - 97.53
L2 x L7 1.29 1.50 4.35 3.20 3.26 3.60 1.45** -0.13 3.38** - - - 96.79
L3 x L7 0.85 1.50 4.56 3.65 3.19 4.51 1.18** -0.33** 6.95** - -1.98* -3.56* 99.08
L4 x L7 0.78 1.50 5.08 3.36 3.41 3.76 1.18** -0.36** 4.29** - - - 98.73
L7 x L8 1.50 1.10 4.47 3.45 3.87 3.38 2.60** 0.22* 2.08** -1.27* - - 97.98
L1 x L6 1.26 1.17 5.33 3.90 4.07 3.71 2.59** 0.07 2.89* -1.35* - - 99.27
L2 x L6 1.29 1.17 5.62 3.61 3.82 3.40 1.25** 0.08 4.57** - - - 99.48 L3 x L6 0.85 1.17 5.53 3.71 3.56 3.67 1.06** -0.16 4.88** - - - 99.04
L4 x L6 0.78 1.17 5.83 3.60 3.68 3.39 0.99** -0.16 5.01** - - - 99.40
L5 x L6 1.14 1.17 6.07 3.88 3.88 3.20 1.17** 0.04 4.49** - - - 98.67
L6 x L7 1.17 1.50 6.19 3.98 3.59 4.56 1.37** -0.22* 5.10** - - - 98.50
L6 x L8 1.17 1.10 5.43 3.35 3.26 3.30 1.14** 0.03 4.32* - - - 99.95
LSD (0.05) 0.50 0.50 1.22 0.81 1.09 1.09
*, **Significant at p = 0.05 and at p = 0.01, respectively.
1L1, L5 and L7 belong to G1 (tolerant), and L2, L3, L4 and L8 belong to G2 (sensitive), both groups derived from SA4 population. L6 was derived from
SA5 population.
2
G2 x G3) lines had the largest estimates (1.80 t ha-1 vs.
4.47 t ha-1), followed by tolerant (G1) x sensitive (G2) re-lated crosses (1.34 t ha-1vs.3.60 t ha-1), by sensitive (G1) x sensitive (G1) related crosses (0.29 t ha-1vs.1.66 t ha-1) and by tolerant (G2) x tolerant (G2) related crosses (0.16 t ha-1
vs.1.15 t ha-1) (Tables 2 and 3). As expected, crosses be-tween unrelated inbreds presented larger dominance effects (Hallauer and Miranda Filho, 1988). The results from crosses between related lines suggested that selection within the full-sib family for tolerance to soil acidity in-creased the genetic diversity of the lines, because G1 x G2 crosses presented significantly larger dominance effects than G1 x G1 and than G2 x G2 crosses for both types of soils. These results suggest that unidirectional positive dominance plays an important role in the inheritance of grain yield in both acid and non-acid soils. The importance of dominance genetic effects for the inheritance of grain yield in maize in non-acid soils has been reported (Gamble , 1962a; Darrah and Hallauer, 1972; Cockerham and Zeng, 1996), but for acid soils the available information is lim-ited. Ceballoset al.(1998) reported that, for grain yield, the dominance effects accounted for 63.0% and 81.0% of the total sum of squares in acid and non-acid soils, respec-tively, and that the estimates of dominance effects were af-fected by soil acidity;i.e., dominance effect estimates in acid soil were significant lower than those in non-acid soils.
Epistatic effects for grain yield were detected in four out of 28 crosses (14.3%) in acid soils, withaaeffects in two crosses,adeffects in three crosses, and bothaaandad
were detected simultaneously in only one cross. In non-acid soils, six crosses (21.4%) presented significant epistatic ef-fects, withaaeffects in five crosses andadandddeffects in one cross. There was no connection between the related-ness of the inbreds and epistatic effects. The number of crosses with epistatic effects was slightly greater in non-acid than in non-acid soils, and the magnitudes of these effects were also larger in non-acid than in acid soils (Tables 2 and 3). Narroet al.(2000) conducted a diallel analysis in acid soils and reported that both additive effects (general com-bining ability) and non-additive effects (specific comcom-bining ability) were equally important for grain yield. Ceballoset al.(1998) reported that epistatic effects for grain yield were important in acid soils but not for non-acid soils. Our re-sults did not agree with those reported by Ceballoset al.
(1998) because epistatic effects were detected in both types of soils for only four crosses in acid soil and six crosses in non-acid soil, suggesting that soil acidity could not affect the detection of epistatic effects. These results also did not agree with those of Wolf and Hallauer (1997) who reported that epistasis in maize seems to be more important in either poorer or better environments. Jinkset al.(1973) also re-ported that the frequency and magnitude of epistasis in to-bacco (Nicotiana tabacum L.) were greater in both ex-tremes of a range of environments. Epistatic effects for grain yield of maize in non-acid soils have been reported to
be lower than for its components, such as ear length, ear di-ameter, and kernel-row number (Gamble, 1962a; Gamble 1962b; Darrah and Hallauer, 1972; Wolf and Hallauer, 1997), but these information are lacking for acid soils.
For plant height, the number of crosses in acid soils with significant additive effects (53.6%) was greater than those with significant epistatic effects (50%) followed by those with significant dominance effects (42.9%), whereas in non-acid soils, dominance effects were significant for 71.5%, epistatic effects for 53.6% and additive effects for 50.0% of the crosses (Table 4). Both additive and domi-nance effects were not affected by the genetic relatedness of the inbreds but they were significantly reduced by soil acidity; the additive effects were less affected (5.5 cm plant-1vs.7.5 cm plant-1) than dominance effects (20.0 cm plant-1vs.48.7 cm plant-1) by soil acidity. All estimates of epistatic effects were negative in both soils, withaaeffects being more important than the other types of digenic epistasis in acid soil whileaaandddwere more important thanadeffects in non-acid soil. Similar results for plant height in non-acid soils;i.e., dominance effects more im-portant than additive and epistatic effects, withaaanddd
effects more important than ad effects were reported by Gamble (1962b), Darrah and Hallauer (1972), and Moreno-Gonzalez and Dudley (1981). However, Narroet al. (2000) reported that non-additive effects (dominance and epistasis) were as important as additive effects for plant height in acid soils.
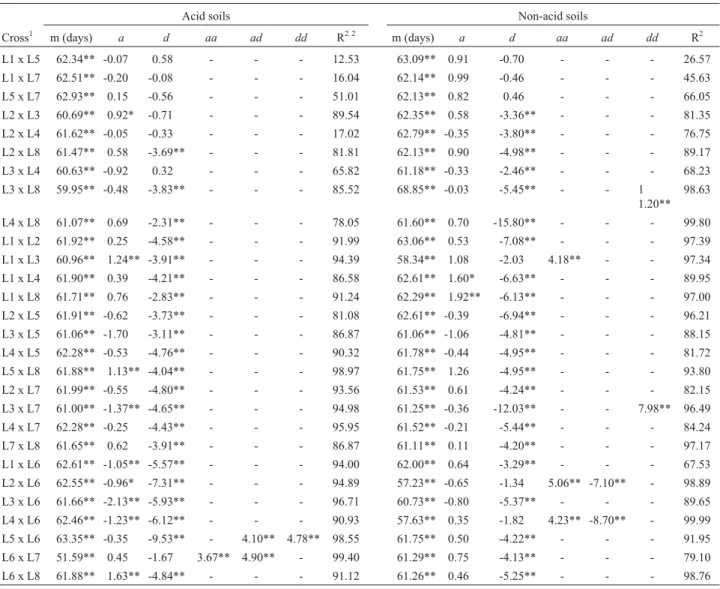
For mid-silk in acid soil the pooled additive effects were significant for 11 crosses (39.3%), pooled dominance effects for 21 crosses (75.0%) and pooled epistatic effects for two crosses (9.5%), while in non-acid soil 2 (7.14%), 22 (78.57%) and 7 crosses (25%) presented significant addi-tive, dominant, and epistatic pooled effects, respectively. In absolute values the additive effects averaged 0.8 d and 0.7 d and the dominance effects averaged 3.6 d and 4.7 d in acid and in non-acid soils, respectively. Most of the dominance effects were negative, and most of epistatic effects were positive in both soils (Table 5). Darrah and Hallauer (1972) reported that dominance was the major effect in the inheri-tance of this trait, followed by additive and epistatic effects. Wolf and Hallauer (1997) also detected significant epistatic effects for mid-silk.
effects
in
maize
95
Acid soils Non-acid soils
Cross1 m (cm) a d aa ad dd R2 2 m (cm) a d aa ad dd R2
L1 x L5 117.21** -6.39* -0.93 - - - 48.79 182.95** -14.92** -28.75** -39.93** - - 96.08
L1 x L7 110.29** -6.06* 10.05** - - - 75.98 142.19** -7.79** 20.11** - - - 78.95
L5 x L7 119.65** -0.13 7.52 - - - 37.53 155.25** 2.36 22.65** - - - 71.65
L2 x L3 102.91** -0.76 8.99 - - - 81.38 134.68** 3.95 19.98** - - - 87.30
L2 x L4 108.09** -3.33 -0.05 - - - 40.54 141.40** 4.36 16.23** - - - 62.06
L2 x L8 95.50** 5.28* 58.80** - - -36.80** 93.96 130.85** 9.15* 72.76** - -46.70** -38.61** 95.04
L3 x L4 107.86** -3.51 3.87 - - - 54.94 135.89** -7.21 22.02** - - - 89.50
L3 x L8 122.11** 6.90 3.24 -26.27** -35.40** - 98.60 126.21** -1.02 55.34** - - - 94.89
L4 x L8 99.15** 10.85** 78.98** - -36.70** -55.63** 97.70 130.45** 8.75* 114.60** - -39.30** -70.05** 99.24
L1 x L2 125.88** 0.64 2.49 -20.14* - - 92.97 179.75** -3.90 4.45 -44.53** - - 98.95
L1 x L3 124.71** -0.26 5.80 -20.26* - - 91.50 168.72** 2.76 9.32 -40.00** - - 98.94
L1 x L4 112.07** -1.84 22.75** - - - 81.84 183.57** -3.10 -1.82 -49.33** - - 99.19
L1 x L8 99.39** 8.42** 28.78** - - - 96.55 125.45** 3.77 91.92** - - -42.37** 95.81
L2 x L5 146.85** -6.79* -16.69 -35.02** - - 95.33 187.29** -5.86 -7.15 -39.40** - - 98.85
L3 x L5 129.62** -8.12** 5.00 -19.58* - - 94.64 180.56** -11.54** 0.82 -38.06** - - 94.95
L4 x L5 142.46** -4.50 0.97 -27.35** - - 99.75 146.20** -5.44 55.35** - - - 95.48
L5 x L8 125.79** 13.94** 12.21 -20.54** - - 94.41 137.62** 11.30** 58.38** - - - 94.63
L2 x L7 110.41** -5.00 25.57** - - - 93.02 143.75** -4.32 88.18** - - -48.63** 93.86
L3 x L7 111.56** -7.63** 32.92** - - - 91.52 137.50** -10.00** 133.71** - -36.80** -93.71** 99.96
L4 x L7 114.86** -3.54 30.86** - - - 94.58 145.18** -5.40 49.99** - - - 95.57
L7 x L8 105.36** 13.97** 29.95** - - - 92.81 159.77** 9.24** 19.53 -26.20** - - 94.81
L1 x L6 140.53** -6.76* 4.78 -28.72** - - 96.25 142.95** -14.98** 101.15** - - -38.80** 98.73
L2 x L6 133.86** -6.27* 15.76 -23.15** - - 94.84 153.28** -9.97** 58.11** - - - 93.23
L3 x L6 111.82** -5.42* 36.55** - - - 93.70 146.15** -16.63** 59.76** - - - 95.91
L4 x L6 143.55** -4.10 5.88 -30.12** - - 98.45 151.39** -8.34* 57.83** - - - 94.38
L5 x L6 120.63** 1.09 32.58** - - - 91.35 159.60** -2.67 49.53** - - - 91.42
L6 x L7 115.70** 0.84 75.73** - - -39.73* 97.51 188.01** 2.54 24.20 -34.60** - - 97.31
L6 x L8 142.80** 12.25** 1.96 -38.72** - - 96.30 139.20** 17.76** 118.26** - - -51.66** 99.39
*, ** Significant at p = 0.05 and at p=0.01, respectively.
1L1, L5 and L7 belong to G1 (tolerant), and L2, L3, L4 and L8 belong to G2 (sensitive), both groups derived from SA4 population. L6 was derived from SA5 population.
2
(1997) did not detect significant epistatic effects for prolificacy in an F2population in non-acid soil.
The overall results of this research showed that the dominance effects play a more important role than additive effects and that the latter were more important than epistatic effects in both acid and non-acid soils. Similar re-sults have been reported by Pandeyet al.(2007). Epistatic effects were detected for all traits in both acid and non-acid soil environments. Epistatic effects have been considered as a result of unique combinations of genes in specific crosses, which may contribute to increased heterosis in elite single-crosses (Lamkeyet al., 1995; Darrah and Hallauer, 1972). For example, Darrah and Hallauer (1972) reported a higher frequency of epistatic effects for yield in crosses be-tween second-cycle inbreds than in crosses bebe-tween first-cycle inbreds and attributed this to the effects of selec-tion. However, our results showed no relationship between
high-yielding single-crosses (F1generation) and epistasis
because only one of the five high-yielding single-crosses presented significant epistatic effect (ad) in acid soils and in non-acid soil none of them presented significant epistatic effects. Thus, epistatic effects were randomly distributed among the crosses.
Our results suggest that the inheritance of grain yield, plant height, mid-silk and prolificacy did not differ in acid and non-acid soils. Obviously, there are detrimental effects of the acid soils, mainly for grain yield, which cause the es-timates of the genetic effects to be lower in acid than in non-acid soils. Thus, the accumulated knowledge on the in-heritance of quantitative traits in non-acid fertile soils, sum-marized by Hallaueret al.(1988) and Hallauer and Miranda Filho (1988), can benefit maize breeding programs for acid soils environments.
Table 5- Estimates of mean (m), additive (a), dominance (d) and digenic epistatic (aa,ad,dd) effects for maize mid-silk, evaluated in four acid soil and in two non-acid soils environments in Brazil and Colombia.
Acid soils Non-acid soils
Cross1 m (days) a d aa ad dd R2 2 m (days) a d aa ad dd R2
L1 x L5 62.34** -0.07 0.58 - - - 12.53 63.09** 0.91 -0.70 - - - 26.57 L1 x L7 62.51** -0.20 -0.08 - - - 16.04 62.14** 0.99 -0.46 - - - 45.63
L5 x L7 62.93** 0.15 -0.56 - - - 51.01 62.13** 0.82 0.46 - - - 66.05 L2 x L3 60.69** 0.92* -0.71 - - - 89.54 62.35** 0.58 -3.36** - - - 81.35
L2 x L4 61.62** -0.05 -0.33 - - - 17.02 62.79** -0.35 -3.80** - - - 76.75
L2 x L8 61.47** 0.58 -3.69** - - - 81.81 62.13** 0.90 -4.98** - - - 89.17 L3 x L4 60.63** -0.92 0.32 - - - 65.82 61.18** -0.33 -2.46** - - - 68.23
L3 x L8 59.95** -0.48 -3.83** - - - 85.52 68.85** -0.03 -5.45** - - 1 1.20**
98.63
L4 x L8 61.07** 0.69 -2.31** - - - 78.05 61.60** 0.70 -15.80** - - - 99.80 L1 x L2 61.92** 0.25 -4.58** - - - 91.99 63.06** 0.53 -7.08** - - - 97.39
L1 x L3 60.96** 1.24** -3.91** - - - 94.39 58.34** 1.08 -2.03 4.18** - - 97.34
L1 x L4 61.90** 0.39 -4.21** - - - 86.58 62.61** 1.60* -6.63** - - - 89.95 L1 x L8 61.71** 0.76 -2.83** - - - 91.24 62.29** 1.92** -6.13** - - - 97.00
L2 x L5 61.91** -0.62 -3.73** - - - 81.08 62.61** -0.39 -6.94** - - - 96.21 L3 x L5 61.06** -1.70 -3.11** - - - 86.87 61.06** -1.06 -4.81** - - - 88.15
L4 x L5 62.28** -0.53 -4.76** - - - 90.32 61.78** -0.44 -4.95** - - - 81.72
L5 x L8 61.88** 1.13** -4.04** - - - 98.97 61.75** 1.26 -4.95** - - - 93.80 L2 x L7 61.99** -0.55 -4.80** - - - 93.56 61.53** 0.61 -4.24** - - - 82.15
L3 x L7 61.00** -1.37** -4.65** - - - 94.98 61.25** -0.36 -12.03** - - 7.98** 96.49 L4 x L7 62.28** -0.25 -4.43** - - - 95.95 61.52** -0.21 -5.44** - - - 84.24
L7 x L8 61.65** 0.62 -3.91** - - - 86.87 61.11** 0.11 -4.20** - - - 97.17
L1 x L6 62.61** -1.05** -5.57** - - - 94.00 62.00** 0.64 -3.29** - - - 67.53 L2 x L6 62.55** -0.96* -7.31** - - - 94.89 57.23** -0.65 -1.34 5.06** -7.10** - 98.89
L3 x L6 61.66** -2.13** -5.93** - - - 96.71 60.73** -0.80 -5.37** - - - 89.65 L4 x L6 62.46** -1.23** -6.12** - - - 90.93 57.63** 0.35 -1.82 4.23** -8.70** - 99.99
L5 x L6 63.35** -0.35 -9.53** - 4.10** 4.78** 98.55 61.75** 0.50 -4.22** - - - 91.95
L6 x L7 51.59** 0.45 -1.67 3.67** 4.90** - 99.40 61.29** 0.75 -4.13** - - - 79.10 L6 x L8 61.88** 1.63** -4.84** - - - 91.12 61.26** 0.46 -5.25** - - - 98.76
*, **Significant at p = 0.05 and at p = 0.01, respectively.
1L1, L5 and L7 belong to G1 (tolerant), and L2, L3, L4 and L8 belong to G2 (sensitive), both groups derived from SA4 population. L6 was derived from
Acknowledgments
The authors are grateful to Dr. A.R. Hallauer and to Dr. R. Vencovsky for their constructive suggestions. Pro-ject # 223-K8064 CIMMYT 5/94 “Adaptation of maize to aluminum toxic soils”. Part of a thesis presented by J. C. Pérez Velásquez to the University of São Paulo, ESALQ/ USP, in partial fulfillment of the requirements for a doc-toral degree in Agronomy.
References
Allen DM and Cady FB (1982) Analyzing Experimental Data by Regression. Lifetime Learning Publications, Belmont, 403 pp.
Bahia Filho AFC, Magnavaca R, Schaffert RE and Alves VMC (1997) Identification, utilization, and economic impact of maize germplasm tolerant to low levels of phosphorus and toxic levels of exchangeable aluminum in Brazilian soils. In: Moniz AC (ed) Plant Soil Interactions at Low pH: Sustain-able Agriculture and Forestry Production. Sociedade Brasi-leira de Ciência do Solo, Campinas, pp 59-70.
Borrero JC, Pandey S, Ceballos H, Magnavaca R and Bahia Filho AFC (1995) Genetic variances for tolerance to soil acidity in a tropical maize population. Maydica 40:283-288.
Ceballos H, Pandey S, Knapp ER and Duque-Vargas J (1995) Progress from selection for tolerance to soil acidity in five tropical maize populations. In: Date RA (ed) Plant-Soil In-teractions at Low pH: Principles and Management. Klüwer Academic Publishers, Dordrecht, pp.419-424.
Ceballos H, Pandey S, Narro L and Pérez JC (1998) Additive, dominant, and epistatic effects for maize grain yield in acid and non-acid soils.Theor Appl Genet 96:662-668. Cockerham CC and Zeng ZB (1996) Design III with marker loci.
Genetics 143:1437-1456.
Darrah LL and Hallauer AR (1972) Genetic effects estimated from generation means in four diallel sets of maize inbreds. Crop Sci 12:615-616.
Duque-Vargas J, Pandey S, Granados G, Ceballos H and Knapp ER (1994) Inheritance of tolerance to soil acidity in tropical maize. Crop Sci 34:50-54.
Eleutério A, Gama EEG and Morais AR (1988) Capacidade de combinação e heterose em híbridos intervarietais de milho adaptados às condições de Cerrado. Pesq Agropec Bras 23:247-253.
Galvão JD and Silva JC (1978) Herança da tolerância ao alumínio na variedade de milho Piranão. Rev Ceres 25:71-78. Gamble EE (1962a) Gene effects in corn I. Separation and relative
importance of gene effects for yield. Can J Plant Sci 42:339-348.
Gamble EE (1962b) Gene effects in corn II. Relative importance of gene effects for plant height and certain component attrib-utes of yield. Can J Plant Sci 42:339-348.
Granados G, Pandey S and Ceballos H (1993) Response to selec-tion for tolerance to acid soils in a tropical maize populaselec-tion. Crop Sci 33:936-940.
Hallauer AR and Miranda Filho JB (1988) Quantitative Genetics in Maize Breeding. Iowa State Univ. Press, Ames, 468 pp.
Hallauer AR, Russell WA and Lamkey KR (1988) Corn breeding. In: Sprague GF and Dudley JW (eds) Corn and Corn Im-provement. Am Soc Agron, Madison, pp. 463-564. Jinks JL, Perkins JM and Pooni HS (1973) The incidence of
epistasis in normal and extreme environments. Heredity 31:263-269.
Lamkey KR, Schnicker BS and Melchinger AE (1995) Epistasis in an elite maize hybrid and choice of generation for inbred line development. Crop Sci 35:1272-1281.
Lima M, Furlani PR and Miranda Filho JB (1992) Divergent se-lection for aluminum tolerance in a maize population. Maydica 37:123-132.
Lopes MA, Magnavaca R, Bahia Filho AFC and Gama EEG (1987) Avaliação de populações de milho e seus cruza-mentos para tolerância a toxidez de alumínio em solução nutritiva. Pesq Agropec Bras 22:257-263.
Magnavaca R, Gardner CO and Clark RB (1987a) Comparisons of maize populations for aluminum tolerance in nutrient so-lution. In: Gabelman HW and Loughman BC (eds) Genetic Aspects of Plant Mineral Nutrition. Martinus Nijhoff Pub-lishers, Dordrecht, pp 189-199.
Magnavaca R, Gardner CO and Clark RB (1987b) Inheritance of aluminum tolerance in maize. In: Gabelman HW and Loughman BC (eds) Genetic Aspects of Plant Mineral Nu-trition. Martinus Nijhoff Publishers, Dordrecht, pp 201-212. Mather K and Jinks L (1982) Biometrical Genetics. Chapman and
Hall, New York, 396 pp.
Moreno-Gonzalez J and Dudley JW (1981) Epistasis in related and unrelated maize hybrids determined by three methods. Crop Sci 21:644-651.
Narro L, Pérez JC, Pandey S, Crossa J, Salazar F, Arias M and Franco J (2000) Diallel and triallel analysis in an acid soil tolerant maize population. Maydica 45:301-308.
Naspolini Filho V, Bahia Filho AFC, Vianna RT, Gama EEG, Vasconcelos CA and Magnavaca R (1981) Comportamento de linhagens e híbridos simples de milho em solos sob vegetação de Cerrado. Ciên Cult 33:722-727.
Pandey S and Gardner CO (1992) Recurrent selection for popula-tion, variety and hybrid improvement in tropical maize.Adv Agron 48:1-87.
Pandey S, Ceballos H, Magnavaca R, Bahia Filho AFC, Duque-Vargas J and Vinasco LE (1994) Genetics of tolerance to soil acidity in tropical maize.Crop Sci 34:1511-1514. Pandey S, Ceballos H and Granados G (1995) Registration of four
tropical maize populations with acid-soil tolerance. Crop Sci 35:1230-1231.
Pandey S, Narro L, Friesen DK and Waddington SR (2007) Breeding maize for tolerance to soil acidity. Plant Breed Rev 28:59-100.
Roy AK, Sharma A and Taludker G (1988) Some aspects of alu-minum toxicity in plants.The Bot Review 54:145-147. Salazar F, Pandey S, Narro L, Pérez JC, Ceballos H, Parentoni S
and Bahia Filho AFC (1997) Diallel analysis of acid soil tol-erant and intoltol-erant tropical maize populations. Crop Sci 37:1457-1462.
Von Uexkull HR and Mutert E (1995) Global extent, development and economic impact of acid soils. In: Date RA (ed) Plant-Soil interaction at Low pH: Principles and Manage-ment. Klüwer Academic Publishers, Dordrecht, pp 5-19. Wolf DP and Hallauer AR (1997) Triple testcross analysis to
de-tect epistasis in maize. Crop Sci 37:763-770.