UNIVERSIDADE FEDERAL DE UBERLÂNDIA
DENISE DIAS DE OLIVEIRA
EVALUATION OF FLIGHT SIMULATORS QUALIFICATION REQUIREMENTS FOR FULL STALL TRAINING TASKS IMPACTS ON SAFETY AND INDUSTRY
DENISE DIAS DE OLIVEIRA
EVALUATION OF FLIGHT SIMULATORS QUALIFICATION REQUIREMENTS FOR FULL STALL TRAINING TASKS IMPACTS ON SAFETY AND INDUSTRY
Undergraduate thesis submitted to the Course of Aeronautical Engineering of Universidade Federal de Uberlândia in partial fulfillment of the requirements for the Bachelor Degree in Aeronautical Engineering
Advisor: Prof. Dr. Leonardo Sanches Co-Advisor: Eng. Marcelo Toledo Basile
DENISE DIAS DE OLIVEIRA
EVALUATION OF FLIGHT SIMULATORS QUALIFICATION REQUIREMENTS FOR FULL STALL TRAINING TASKS IMPACTS ON SAFETY AND INDUSTRY
Undergraduate thesis submitted to the Course of Aeronautical Engineering of Universidade Federal de Uberlândia in partial fulfillment of the requirements for the Bachelor Degree in Aeronautical Engineering. Approved by:
________________________________ Prof. Dr. Leonardo Sanches
Advisor – Faculdade de Engenharia Mecânica (FEMEC), Universidade Federal de Uberlândia (UFU)
_________________________________ Prof. MSc. Giuliano Gardolinski Venson
Faculdade de Engenharia Mecânica (FEMEC), Universidade Federal de Uberlândia (UFU)
_________________________________ Prof. MSc. Bruno Luiz Pereira
Faculdade de Engenharia Mecânica (FEMEC), Universidade Federal de Uberlândia (UFU)
ACKNOWLEDGEMENTS
I would like to dedicate my acknowledgments to my mentors that made invaluable contributions to this project. Thanks to Prof. Dr. Leonardo Sanches, for accepting to be my supervisor on this work. Thanks to my internship supervisor at Embraer Eng. Gustavo Borges de Oliveira, who suggested the theme of this project and taught me a lot about simulators. My special thanks to Eng. Marcelo Basile, for sharing his knowledge, for all his advices and for reviewing and editing this undergraduate thesis.
I would also like to acknowledge the twenty flight test pilots who participated of the interview for their contributions to the results and conclusion of this work. My special thanks to test pilot Cel. Geraldo Curcio Neto, for his help in formulating the interview questions, and to Brig. Gilson Russo, for sharing his knowledge and experience.
“Safety first is safety always”
ABSTRACT
This project, carried out in partnership with Embraer S.A., aims to address the issue of new training requirements for stall characteristics recognition in FSTD: Flight Simulation Training Device. Historically, pilot training in simulators was limited to the approach to stall and to recover from the stall warning first indication, which means the airplane was in the linear region of the lift coefficient curve. Following the occurrence of serious accidents around the world, where the crew was unable to properly identify and recover the aircraft from stall, the US Congress and Senate instituted the Public Law 111-216 - Aug. 1, 2010. This law was established as a proposal to amend the current requirement (14 CFR Part 60) and its means of compliance (Advisory Circulars), specifically AC 120-109, and to enforce full stall training in simulators, which goes beyond of the loss of lift, indirectly encouraging the challenge of modeling the non-linear behavior of the wing. The new requirement change proposal has raised a number of questions and doubts about the fidelity of the simulator and the possibility of "negative training", provoking huge debate among manufacturers, regulatory authorities, training providers and third parties. At the end of this paper, it is expected to provide an assessment of the pros and cons of this new training requirement impacts on flight safety and product development, and to account for the consequences for aircraft manufacturers.
RESUMO
Este projeto, realizado em parceria com a Embraer S.A., tem como objetivo abordar a problemática dos novos requisitos para treinamento para reconhecimento de características de estol em simuladores. Historicamente, o treinamento dos pilotos em simuladores era limitado apenas à aproximação do estol, na região linear da curva de coeficiente de sustentação. Após a ocorrência de graves acidentes pelo mundo, em que a tripulação não soube identificar e recuperar a aeronave de um estol, o Congresso e Senado americano instituiu o Airline Safety and Federal Aviation Administration Extension Act of 2010, também conhecido como Public Law 111-216, em agosto de 2010. Tal ato se configurou como uma proposta para alteração do requisito vigente (14 CFR Part 60) e seus meios de cumprimento (Advisory Circulars), especificamente a AC 120-109 e impor o full stall training em simuladores, que vai além da perda de sustentação, indiretamente encorajando o desafio de modelagem da região não-linear da curva de sustentação da asa. A nova proposta de alteração de requisito provocou uma série de questionamentos e dúvidas quanto à capacidade e fidelidade dos simulares e quanto à possibilidade de “treinamento negativo”, provocando enorme debate entre os fabricantes, autoridades reguladoras, órgãos de treinamento e terceiros. O que se espera, ao final deste trabalho, é avaliar os impactos positivos e negativos deste novo requisito de treinamento na segurança de voo e no desenvolvimento do produto e explicitar quais serão as consequências para os fabricantes de aeronaves.
TABLE OF CONTENTS
1 INTRODUCTION ... 1
2 THEORY OF STALL ... 3
2.1 Definition of Stall ... 3
2.2 Factors Affecting Stall Speed ... 6
2.2.1 Load Factor (n) ... 6
2.2.2 Aircraft Weight (W) ... 8
2.2.3 Air Density (𝜌) ... 8
2.2.4 Maximum Lift Coefficient (𝐶𝐿 𝑚𝑎𝑥) ... 8
2.2.5 Thrust (T) and CG position ... 10
2.2.6 Mach Number (M) ... 11
2.2.7 Reynolds Number (Re) ... 12
2.3 Stall Phases ... 13
2.3.1 Approach to Stall ... 14
2.3.2 Stall Warning ... 14
2.3.3 Stall Definition ... 15
2.3.4 Post Stall ... 16
2.4 Stall Flight Test Techniques ... 18
2.4.1 Performance: stall speeds ... 18
2.4.2 Flight qualities: stall characteristics ... 20
2.4.3 Stall warning tests ... 21
2.4.4 Natural stall tests ... 22
2.4.5 Stall FTT Risks ... 23
2.5 Section Summary ... 24
3 FLIGHT SIMULATION TRAINING DEVICE (FSTD) ... 25
3.1 FSTD Fidelity ... 25
3.2 Preliminary Modeling ... 27
3.3 Refined Modeling ... 29
3.4 High AOA modeling ... 30
3.5 Flight Test Data Matching ... 32
3.6 FSTD Validation ... 34
3.7 Section Summary ... 36
4.1 Continental Connection Flight 3407 ... 40
4.1.1 History of the flight ... 41
4.1.2 Crew’s Reaction to Stall ... 42
4.1.3 Investigation Conclusion ... 42
4.2 Turkish Airlines Flight 1951 ... 43
4.2.1 History of the Flight ... 43
4.2.2 Crew’s Reaction to Stall ... 45
4.2.3 Investigation Conclusion ... 45
4.3 Air France 447 Rio-Paris ... 46
4.3.1 History of the flight ... 46
4.3.2 Crew’s Reaction to Stall ... 47
4.3.3 Investigation conclusion ... 48
4.4 Section Summary ... 48
5 NEW FAA RULEMAKING FOR STALL TRAINING ... 50
5.1 Working Groups ... 50
5.1.1 5.1.1. Industry Stall and Stick Pusher Working Group ... 51
5.1.2 ICATEE (International Committee on Aviation Training in Extended Envelopes) ... 51
5.1.3 SPAW ARC (Stick Pusher and Adverse Weather Event Training Aviation Rulemaking Committee) ... 52
5.1.4 LOCART (Loss of Control Avoidance and Recovery Training) Working Group 53 5.2 AC 120-109 ... 53
5.3 Crewmember and Aircraft Dispatcher Training Final Rule ... 54
5.4 NPRM Part 60 for Stall Training ... 54
5.5 Public Comments ... 56
5.5.1 Ten degrees beyond the AOA Model ... 57
5.5.2 Conventional and DFBW Aircraft Differences on this Subject ... 57
5.5.3 Safety Considerations of Full Stall Flight Test ... 58
5.5.4 Third party source of data ... 59
5.6 AC 120-109 A ... 59
5.7 14 CFR Part 60 Final Rule ... 60
5.8 AC120-109 CHG 1 ... 61
5.9 EASA Opinion ... 61
5.10 Section Summary ... 61
6.1 Negative Training and Transfer Concepts ... 63
6.2 Inappropriate Stall Recovery Techniques ... 64
6.3 Training outside the Operational Flight Envelope (OFE) ... 65
6.4 Section Summary ... 66
7 INTERVIEW WITH FLIGHT TEST PILOTS ... 68
7.1 Risks of Generating Flight Test Data... 68
7.2 Practicability of full-stall FTTs ... 69
7.3 Quality of Flight Test Data ... 71
7.4 Fidelity of Qualitative Evaluation ... 72
7.5 Negative or Valid Training ... 74
7.6 Comments ... 75
7.6.1 Agreeing with FAA ... 75
7.6.2 Disagreeing with FAA ... 76
7.7 Section Summary ... 76
8 CONCLUSION ... 78
9 FUTURE PERSPECTIVES ... 80
REFERENCES ... 82
APPENDIX A: 14 CFR Part 25 ... 87
A.1. § 25.103 Stall speed. ... 87
A.2 § 25.201 Stall demonstration. ... 88
A.3. § 25.203 Stall characteristics. ... 89
A.4. § 25.207 Stall warning. ... 90
APPENDIX B: 14 CFR Part 60 ... 91
B.1. NPRM High AOA Modeling ... 91
B.2. Final Rule High AOA Modeling ... 92
APPENDIX C: 14 CFR Part 121 ... 93
LIST OF FIGURES
Figure 2-1 Aerodynamic forces. ... 3
Figure 2-2 Cl x alpha curve. ... 5
Figure 2-3 Airflow representation. ... 5
Figure 2-4 Forces during roll maneuver. ... 7
Figure 2-2-5. High altitude stall speeds: coffin corner. ... 8
Figure 2-6 Effect of flaps in lift curve. ... 9
Figure 2-7 Effect of flaps in lift curve. ... 9
Figure 2-8 Forces that produce pitch moments on aircraft. ... 10
Figure 2-9 Compressibility effect on airfoil lift curve slope ... 12
Figure 2-10 Effects of Reynolds Number on lift curve. ... 13
Figure 2-11 Summary of Part 25 Stall Flight Test Techniques. ... 24
Figure 3-1 Typical flight simulation model. ... 27
Figure 3-2 Aircraft body axis and moments ... 28
Figure 3-3 Euler Angles ... 29
Figure 3-4 Aircraft model development process. ... 30
Figure 3-5 Roll forced oscilation rig, NASA LaRC 14x22 ft Tunnel ... 31
Figure 3-6 Rotary balance rig, NASA LaRC 20 Ft Vertical Spin Tunnel ... 31
Figure 3-7 Aircraft and simulator time-history plots ... 33
Figure 3-8 Matching with flight data process. ... 34
Figure 3-9 Level of FSTD fidelity regions. ... 35
Figure 4-1 Lessons learned with accident: common x flight 3407 process. ... 39
Figure 4-2 Flight path of light 3407 DHC-8-400 aircraft. ... 40
Figure 4-3 Continental Connection Bombardier DHC-8-400 aircraft. ... 41
Figure 4-4 TA flight 1951 Boeing 737-800 aircraft after crashed. ... 45
Figure 5-1 Timeline of events involving stall issue. ... 62
Figure 7-1 Pilots opinions on full stall flight test risk. ... 69
Figure 7-2 Pilots opinions on full stall flight test practicability. ... 70
Figure 7-3 Pilots opinions on repeatability of full stall flight test data. ... 72
Figure 7-4 Pilots opinions on qualitative evaluated model fidelity... 73
SYMBOLS AND ACRONYMS
𝛼 Angle of Attack
𝛼𝑎𝑟𝑡𝑓 Maximum angle of attack allowed by the aircraft control law
𝛼𝐶𝐿 𝑚𝑎𝑥 Angle of maximum lift coefficient
𝛽 Angle of Sideslip
𝐶𝐿 Lift Coefficient
𝐶𝐿𝑚𝑎𝑥 Maximum point of the Lift Coefficient curve
𝐶𝐷 Drag Coefficient
𝐶𝑙 Rolling moment coefficient
𝐶𝑚 Pitching moment coefficient
𝐶𝑚𝛼 Change in pitching moment coefficient with angle of attack (𝑑𝐶𝑚/𝑑𝛼)
𝐶𝑛 Yawing moment coefficient
𝐶𝑌 Side force coefficient
𝐷 Drag
𝐹𝑟 Resultant Force
𝐿𝑇 Total Lift of the aircraft
𝐿𝑊 Wing Lift
𝐿𝐻𝑇 Horizontal Tail Lift
𝑀 Mach Number
𝑛 Load Factor
𝜌 Air Density
𝑞 Dynamic pressure
𝑅𝑒 Reynolds Number
𝑆 Wing Area
𝑉𝑆 Stall Speed
𝑉𝑠1𝑔 Stall speed for load factor equal to 1g
𝑉𝑆𝑅 Reference Stall Speed
𝑉𝑆𝑊 Stall Warning Onset Speed
𝑊 Aircraft Weight
𝜙 Bank (roll) Angle
𝜃 Pitch Angle
𝛿 Control surface deflection AC FAA Advisory Circular
AIAA American Institute of Aeronautics and Astronautics ANAC Agência Nacional de Aviação Civil
AOA Angle of Attack
AP Auto-Pilot
ARC Aviation Rulemaking Committee AURTA Airplane Upset Recovery Training Aid CA Aerodynamic Center
CENIPA Centro de Investigação e Prevenção de Acidentes Aeronáuticos CFD Computational Fluid Dynamics
CFR Code of Federal Regulations CG Center of Gravity
CL Center of Lift
CVR Cabin Voice Recorder DAL Design Assurance Level DFBW Digital Fly-By-Wire ETPS Empire Test Pilot School
FAA Federal Aviation Administration FAR Federal Aviation Regulations FCS Flight Control System
FCU Flight Control Unit FDR Flight Data Recorder FFS Full Flight Simulator
FSTD Flight Simulation Training Device FTD Flight Training Device
FTE Flight Test Envelope FTI Flight Test Instrumentation FTT Flight Test Technique GMT Greenwich Mean Time HOA High angle of Attack HT Horizontal Tail
ICATEE International Committee on Aviation Training in Extended Envelopes
IP Issue Paper
LOC-I Loss of Control In-flight
LOCART Loss of Control Avoidance and Recovery Training Working Group MBFT Model Based Flight Test
NFE Normal Flight Envelope
NPRM Notice of Proposed Rulemaking
NSP GB National Simulator Program Guidance Bulletin NSPM National Simulation Program Manager
NTSB National Transportation Safety Board OEM Original Equipment Manufacturer OFE Operational Flight Envelope PF Pilot Flying
PNF Pilot Not Flying
QPS Qualification Performance Standards QTG Qualification Test Guide
RAeS Royal Aeronautical Society SME Subject Matter Expert SOC Statement of Compliance
SPAW Stick Pusher and Adverse Weather Event Training SNPRM Supplemental Notice of Proposed Rulemaking ToT Transfer of Training
1 INTRODUCTION
Historically, stall training for air carriers has been limited to approach to stall training where recovery is initiated at the first indication of the stall (typically at the activation of the stall warning system or stick shaker). However, some recent accidents such as Air France flight 447 Rio de Janeiro – Paris, Colgan Air Flight 3407 Newark – Buffalo and Turkish airlines Flight 1951 Istanbul – Amsterdam have raised concern about flight crew ability to proper monitor the airplane angle of attack, identify the first indications of what would be an aerodynamic stall and to properly recover from stall. Motivated by public commotion and with the aim to prevent new catastrophes, the American Congress instituted the Airline Safety and Federal Aviation Administration Extension Act of 2010, also known as Public Law 111-216 – Aug. 1, 2010. This act was depicted as a proposal to amend the current requirement (14 CFR Part 60 and the operational flagship Part 121) and their respective Advisory Circulars, more specifically the AC 120-109, to amend the guidelines for full stall training in simulators.
limits of a normal controlled operational flight. A new approach was required by FAA to train pilots how to recover from conditions that were never supposed to be reached in the flagship flight.
The technical background to support this debate is provided in Section 2, which explains the aerodynamic of stall and which shows the non-linearity aspects and covers the difficulties involved on a representation of a non-linear phenomenon in mathematical model. Moreover, The FSTD theory is detailed on Section 3: how the simulator models are done, how fidelity is defined and measured and the criteria for an FSTD evaluation. The three accidents prior mentioned are depicted in Section 4, focusing on flight crew actions during approach-to-stall and the stall event itself. The sequence of events that happened after Public Law 11-126 publication, involving the work of experts to provide the Part 121 and Part 60 Amendments, the concerns regarding the negative transfer of training and the public repercussion of the new FAA requirements. Section 6 is related to the human factors standpoint involving negative training concerns of the full-stall issue. Finally, in Section 7, results and comments of flight test pilots interviewed regarding the FTSD full stall training and recovery are presented.
2 THEORY OF STALL
This section explains the aerodynamic background of stall covering non-linearity aspects and the difficulties involved on mathematical model representation. Moreover, it explains stall phases and the factors that affects stall margins, which sometimes may not be completely understood by pilots. The section ends with an explanation of 14 CFR Part 25 certification requirements for stall flight-testing.
2.1 Definition of Stall
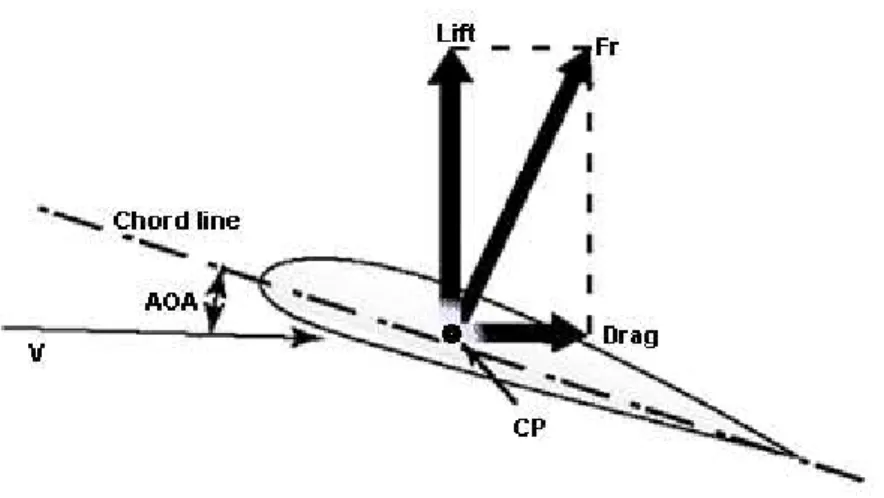
Angle of Attack (AOA), also named as , is the angle between the wing chord and relative wind, where the chord is a straight line from the leading edge to the trailing edge, as drawn in Figure 2-1 below. At low angles of attack, the airflow over the top of the wing flows smoothly and it is deflected down after the airfoil or wing passes. This change in momentum yields an aerodynamic resultant force (𝐹𝑟) in opposite direction. See image below.
Figure 2-1 Aerodynamic forces.
Source:
https://www.quora.com/What-do-pilots-do-if-they-are-on-the-final-approach-and-then-they-stall-Do-they-pull-up-or-put-the-nose-down. Access on: 20/12/2017.
change. So engineers consider the Aerodynamic Center (CA), which is the point where the aerodynamic moment remains constant, in aerodynamic analysis. The resultant aerodynamic force (Fr) is divided in two components, Lift (perpendicular to the relative wind) and Drag (parallel to the relative wind) which can be calculated as follows:
𝐿 = 0.5 𝜌 𝑉2𝑆 𝐶𝐿 (1) 𝐷 = 0.5 𝜌 𝑉2𝑆 𝐶𝐷 (2) where ρ is the air density, V is the airspeed, S is the wing surface and 𝐶𝐿 and
𝐶𝐷 are, respectively, the dimensionless lift and drag coefficients, which depends on airfoil characteristics. The pitching moment is calculated as follows:
𝑀 = 0.5 𝜌 𝑉2 𝑆 𝑐 𝐶
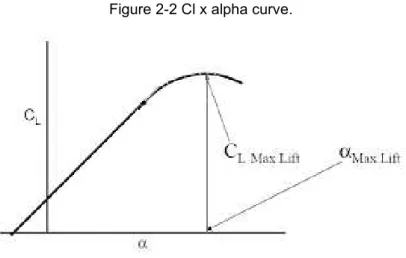
Figure 2-2 Cl x alpha curve.
Adapted from: USNTPS, Flight Test Manual – no.103.
Figure 2-3 Airflow representation.
Source: http://clipper440.blogspot.com.br/2015_05_01_archive.html. Access on: 03/30/2017.
An impending stall occurs when the airplane is approaching, but does not exceed the maximum lift coefficient. Full stall or developed stall occurs when the maximum lift coefficient is exceeded (FAA-H-8083-3B, 2016, p. 4-5), above the point of flow separation, where dynamic pressure is strongly reduced. Apart from loss of lift, more undesired aspects due to detached flow effects can be observed near 𝐶𝐿𝑚𝑎𝑥, as described below:
2. Large increases in induced drag may cause high sink rates, compromising flight path maintenance and control.
3. Uncommanded aircraft motions cannot be arrested by use of the piloting commands, sudden wing drop due to asymmetrical stall in the wings, and departures, which may involve pitch over followed by a deep stall or spin.
4. Undesirable flying qualities, which include intolerable buffet level, shaking of the controls, wing rock, aileron reversal, and degraded stability.
5. Reduction of elevator and horizontal stabilizer control effectiveness, which may lead to full nose up pitch control limits, may be reached before any of the above conditions occurs (USNTPS, 1992, p. 3.1).
According to equation (1) and Figure 2-2, as airspeed decreases AOA must increase to maintain the necessary lift to sustain the aircraft. The minimum speed that corresponds to AOA for maximum lift is defined as stall speed (𝑉𝑆) and it is obtained from 2ndNewton’s Law of forces balance for steady level flight:
𝐿 = 𝑊 =12 𝜌 𝑉2 𝑆 𝐶
𝐿 (4)
𝑉𝑆 = √2𝑊/𝜌 𝐶𝐿 𝑚𝑎𝑥 𝑆 (5) In this equation, S is the aircraft referenced wing.
2.2 Factors Affecting Stall Speed
Factors affecting the stall speed can be found regarding eq. (5) variables (CAVCAR, Turkey). In summary: load factor, aircraft weight, air density and maximum lift coefficient. Other factors not directly explicit in eq. (5) are also included in subsections below.
2.2.1 Load Factor (n)
For non-steady, turning, ascending and descending flight, Lift is not equal to Weight, and we define load factor, for conventional transport aircrafts, as:
𝐿 = 𝑛 𝑊 =12 𝜌 𝑉2 𝑆 𝐶
𝐿 (7)
𝑉𝑆 = √2𝑛𝑊/𝜌 𝐶𝐿 𝑚𝑎𝑥 𝑆 (8) Therefore the stall speed is proportional to steady level flight stall speed, or 1-g stall (𝑉𝑆1𝑔) speed:
𝑉𝑆 = √𝑛 𝑉𝑆1𝑔 (9) So, as the load factor is increased, the stall speed is also increased and stall margin becomes tighter. Giving an example of a turning flight: merely banking the aircraft into a turn reduces the amount of lift opposing gravity and supporting the aircraft’s weight. Consequently, the aircraft loses altitude unless additional lift is created (FAA-H-8083-25B, 2016, p. 5-23). This is done by increasing the AOA until the vertical component of lift L.cos is equal to the weight, as shown in Figure 2-4. Since the vertical component of lift decreases as the bank angle increases, the AOA must be progressively increased to produce sufficient vertical lift to support the aircraft weight. For this case, load factor is calculated as:
𝑛 = 𝐿/(𝐿 𝑐𝑜𝑠𝜙) = 1/𝑐𝑜𝑠𝜙 (10) Following equation (7), when wing abruptly loses lift, the crew will feel a pronounced g-brake, which may be an abrupt decrease in load factor. The g-brake can be smooth or abrupt depending on the wing design characteristics
Adapted from: USNTPS, Flight Test Manual – no.108.
2.2.2 Aircraft Weight (W)
Following equation (8) as aircraft weight increases stall speed increases. Normally, Vs is calculated for aircraft takeoff weight and landing weight before each flight, as part of operational procedures. During flight, as weight varies the stall speed can vary as expressed below (HURT, 1965, p.35).
𝑉𝑆1 𝑉𝑆2= √
𝑊1
𝑊2 (11)
2.2.3 Air Density (𝜌)
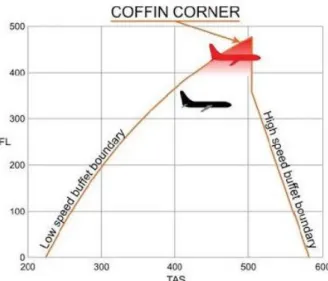
Following equation (8) as air density decreases stall speed increases. It means that pilots should fly at higher speeds at higher altitudes to ensure safe margins from stall. However, depending on the altitude it may be not possible to ensure safe stall margins because the stall speed converges to critical Mach number as altitude is increased. The convergence point is named coffin corner, showed in image 2-6.
Figure 2-2-5. High altitude stall speeds: coffin corner.
Source: https://en.paperblog.com/mountain-wave-and-the-coffin-corner-554785/. Access on: 06/19/1028.
2.2.4 Maximum Lift Coefficient (𝐶𝐿 𝑚𝑎𝑥)
devices such as flaps and slats the 𝐶𝐿 𝛼 curve may be changed as shown in Figures 2-6 and 2-7 below:
Figure 2-6 Effect of flaps in lift curve.
Source: KIMBERLY, Flight Testing of Fixed Wing Aircraft.
Figure 2-7 Effect of flaps in lift curve.
2.2.5 Thrust (T) and CG position
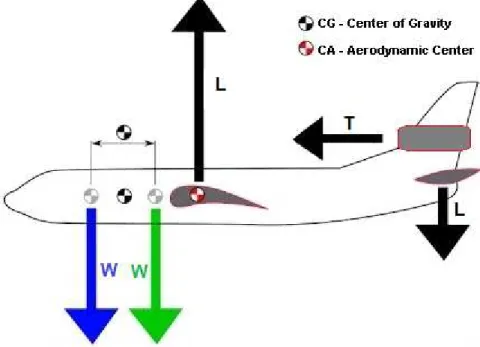
The four factors affecting stall speeds listed above are related to the wing. It is important to state that the wing is not the only lifting surface of conventional transport aircrafts. There is also the horizontal tail (HT), which produces the amount of lift to balance the airplanes pitching moment throughout the flight. If Center of Gravity (CG) is in front of the Aerodynamic Center (CA) the aircraft will have a pitch down tendency and horizontal tail must generate a lift down force to counter the pitching down moment. The most forward CG is, the higher lifting down force (-) the HT must produce (see Figure 2-8).
The opposite is also valid: if CG is behind CA, the aircraft will have a pitch up tendency and horizontal tail must generate a lift up force to counter the pitching up moment from the wing. The most aft CG is, the higher lifting up force (+) the HT must produce. It is an interesting design characteristic that improves performance (fuel consumption) during cruise flight. As the stability is reduced when CG goes aftwards CA, the pitch moment from the tail to counteract the wing pitch moment reduces, so the amount of trim, and so the trim drag.
Figure 2-8 Forces that produce pitch moments on aircraft.
Whereas the total lift of the aircraft is 𝐿𝑇 = 𝐿𝑊+ 𝐿𝐻𝑇 a forward CG results in a reduced total lift and a necessary increase in stall speed to sustain the aircraft weight. In other hand, aft CG results in increased lift and a decrease in stall speed. It explains why modern transport category aircraft, including some executive jets, may have their stability relaxed (low or neutral static margin) during cruise phase to reduce the trim drag, by demanding about low lift-down force in the HT (very small deflection) to keep the aircraft trimmed.
The thrust effect is quietly the same depending on the location of the engines. If they are placed below the CG, an increase in thrust will lead to an increasing pitch up moment, so the HT lift force must increase to counter this effect, increasing the total amount of lift and decreasing the stall speed. The opposite is when engines are placed above the CG, represented in Figure 2.8, where an increase in thrust will generate a pitch down moment and a decrease in HT lift force (or increase in HT lift down force) and the consequence will be less total lift and higher Vs to sustain the aircraft.
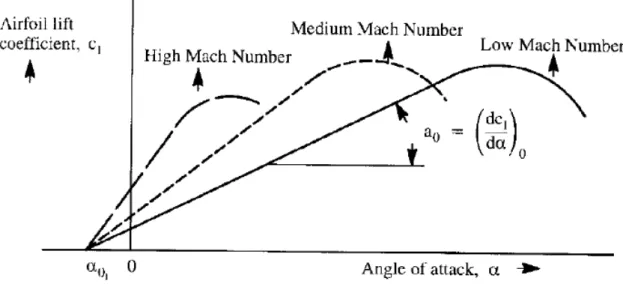
2.2.6 Mach Number (M)
The aerodynamic characteristics of an airfoil, represented by the evolution of the 𝐶𝑙 = 𝑓(𝛼) curve, are different between the lower altitudes (low Mach, subsonic airflow, incompressible air) and the high altitudes (higher Mach, airflow close to transonic, influence of the compressibility of the air). At a high Mach, the compressibility of the air is notably manifested by the appearance of buffet at a high angle of attack, whose amplitude can then increase until it becomes dissuasive (deterrent buffet). In these cases, the flight tests are then interrupted before reaching 𝐶𝐿𝑚𝑎𝑥.
Nevertheless there is a degradation of maximum usable 𝐶𝐿 due to Mach effect as far the certification requirements 14 CFR 25.251(c) may limit it; it states:
“There may be no buffeting condition, in normal flight, including configuration changes during cruise, severe enough to interfere with the
Therefore, the high Mach stall speed is considered as “buffet limit speed”, which is higher than low Mach stall speed. The Mach effect on 𝐶𝐿𝛼 curve is illustrated in Figure 2-9 below. The 𝛼𝐶𝐿 𝑚𝑎𝑥 achieved of high Mach number curve is the lowest and the
𝐶𝐿𝑚𝑎𝑥 is also the lowest, comparing to the other curves.
Figure 2-9 Compressibility effect on airfoil lift curve slope
Source: ROSKAN, Aerodynamics and Performance.
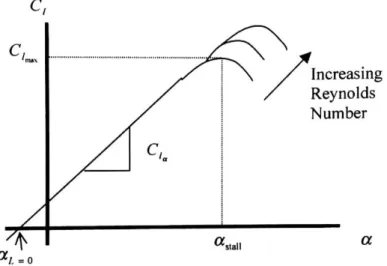
2.2.7 Reynolds Number (Re)
The dimensionless Reynolds number (Re) is a similarity parameter that correlates the inertia forces to viscous forces. For aircraft aerodynamics, it is defined as:
Figure 2-10 Effects of Reynolds Number on lift curve.
Source: YECHOUT, Introduction to Aircraft Flight Mechanics.
2.3 Stall Phases
The stall may be academically divided into phases as per ETPS (Empire Test Pilot School) Flight Manual: approach to stall, stall warning, stall definition and post-stall, they are exemplified respectively from left to right in figure 2-11 below.
2.3.1 Approach to Stall
In this phase, AOA is increasing, still on linear side of the Cl x alpha curve. In a conventional airplane, should not be followed by any undesirable characteristic as far as the speed range is mostly operational. Nevertheless is possible to note progressive increase in the stick force and displacement as alpha increases. In some airplanes, effect of the unbalanced or unsteady flows is possible to notice through “heavy” wing tendency for one of the sides.
2.3.2 Stall Warning
This phase is characterized by the entry of a stall warning. It is a natural or synthetic indication provided when approaching a stall that may include one or more of the following indications:
(1) Aerodynamic buffeting onset, defined by an oscillatory vertical acceleration whose amplitude reaches 0.2 g from peak to peak at the pilot’s seat (some airplanes will buffet more than others);
(2) Reduced roll stability and aileron effectiveness; (3) Visual or aural cues and warnings;
(4) Reduced elevator (pitch) authority;
(5) Inability to maintain altitude or arrest rate of descent; (6) Stick shaker activation.
I. The system should be capable of stall warning for any airplane configuration, airspeed, altitude, normal accelerations, sideslip, bank angle, and power setting. In addition, the system should not be susceptible to atmospheric influence, such as temperature and pressure variations, precipitation, and icing.
II. The warning provided the pilot should be unmistakable and sufficiently in advance of the stall to allow avoidance of the stall without undue pilot effort.
III. The stall warning should be reliable and repeatable.
IV. The system should be easy to maintain and easy to calibrate on the ground.
2.3.3 Stall Definition
The aerodynamic stall is when the maximum lift and critical AOA are reached. The stall definition is a more complex concept, because it has different characteristics from aircraft to aircraft and, even in the same aircraft may have different characteristics as function of slat/flap/gear speed brake. It may be defined naturally or artificially. The natural definition of stall may be desirable, acceptable or unacceptable under certification requirement standpoint. To be naturally desirable or acceptable it should have (FAA, AC 25-7C, p. 127):
Deterrent Buffeting: high cockpit vibration, that pilots are no longer able to proceed with the speed reduction or increase in alpha, compelling them to recover the airplane
Flight controls stop: occasionally it may occur in conventional airplanes where the pitch authority is limited to bring aircraft to the maximum wing lift capability
Wing drop due to uncommanded roll and/or yaw which is still within the requirements limits (beyond limits may not be a safety issue but it turns out the aircraft to be not certifiable)
Pitch down that cannot be arrested (the most desired).
Stick pusher in the conventional flight control system (FCS) design, which is a servo which pushes abruptly the yoke full forward away from seat position in a manner that cannot be counteracted by the pilot;
High AOA Protection function, normally a feature found as part of a DFBW (Digital Fly-By-Wire) Envelope Protection System, which reduces the pitch authority by closing the control loop with alpha, alpha rate, pitch rate in order to achieve a commanded alpha. When the stick or yoke is at aft stops the commanded alpha is the one that guarantees acceptable aircraft handling qualities. This function does not allow the aircraft reach maximum AOA even with stick on the stop pulling up position. In this specific work we will call the maximum AOA allowed by the control law as 𝛼𝑎𝑟𝑡𝑓 (artificial alpha). Adverse situations, such as sensors failures, miscompares or loss of consistent signal processing, may lead to the so called Normal Mode control law to a Direct-To-Surface control law (or simply Direct Law), which owns a simple point gain schedule, but loses the closed loop features as the envelope protection. In this case, pilot should be aware of aircraft operational limitations, as far envelope protection features are not likely to be available. The artificial stall warning becomes active in this flight control law mode once the stall protection mode is no longer available.
2.3.4 Post Stall
This phase may involve angle of attacks greater than maximum lift coefficient (CLmax) AOA. In the post stall the airplane with benign and conventional stall
characteristics pilot shall solely have to conduct the conventional recovery procedures. When the airplane exhibit unacceptable or non-certifiable stall characteristics, it may consist of several more or less distinct types of airplane motions as depicted below:
Departure: characterized by divergent, large-amplitude, uncommanded aircraft motions, such as nose slice or pitch-up. Departure is equivalent to complete loss-of-control, it precipitates entry into a post-stall gyration, spin, or deep stall condition. (SELTZER, R. M., RHODESIDE, G. R., 1988, p.5).
Spin: maneuver during which the airplane descends rapidly toward the earth in a helical movement about a vertical axis (called the spin axis) at an angle of attack between the stall and 90 degrees. It is caused by a combination of two primary factors: exceeding stall AOA and sideslip. These two factors result in a phenomena known as autorotation, which occurs without lateral control input. (USNTPS, 1997, p.3.3).
Deep stall: A flight condition in which the airplane has attained an AOA far higher than the 𝛼𝐶𝐿 𝑚𝑎𝑥angle of maximum lift coefficient. (USNTPS, 1997, p.3.3). Loss of elevator effectiveness, when horizontal tail is in the turbulent wake of the wing, can occur. The moment coefficient with alpha, Cm, is both with positive
gradient and in the positive side of the Cm versus CL curve characterizing
instability and divergence.
Recovery is a post-stall phase maneuver characterized by lowering alpha and return to the controlled flight at the initial trim speed. Thrust must be applied accordingly in this phase, depending on the aircraft type design. For example, airplanes with high by-pass engine ratio: the vertical component of thrust produced in high AOA can lead to a pitch up moment, which may difficult the stall recovery and may result in secondary stalls. In this case, the best way of recovering is to move throttles to idle while pitching the nose down and add thrust only after alpha being below stall warning.
The stall recovery technique that must be applied follow below (FAA-H-8083-3B, 2016, p. 4-7):
1. Disengage auto-pilot and auto-throttle. In order to cover sensors failure like ADS and radio altimeter and avoid inadvertent changes.
2. Apply as much nose-down input as required to obtain nose-down pitch rate, in order to lower alpha as soon as possible. The focus should always be on lowering alpha to restore the sustaining airflow. Apply until stall warnings stop. Apply pitch trim needed.
3. Adjust bank angle, to regain aircraft control to wings level attitude.
4. Adjust thrust, once below stall protection entry or stall warning, in order to regain the trim speed.
6. When airspeed is sufficiently increased to regain the aircraft control, return to the desired flight path.
2.4 Stall Flight Test Techniques
Aircraft manufacturers currently execute stall flight tests to comply with civilian certification requirements: Part 25 for transport aircraft (see appendix A) and Part 23 for normal, utility and commuter category aircraft. This section will focus on Part 25 stall requirements. Most of information of stall flight test techniques are found in Advisory Circular 25-7C, which is the acceptance means of compliance for Part 25 aircraft.
Primarily, stall investigations are conducted for the following reasons:
1. Safety and operational considerations. Verify that no inadvertent stall could happen in all flight phases.
2. Determination of the stall speeds and identification of the stall characteristics (actual flight tests are the only means of determining stall characteristics).
3. Expansion and boundary determination of the operational flight envelope. 4. Determination of trim airspeeds for future tests.
Stall certification flight tests campaign are typically split into two phases: stall speeds and stall characteristics. It is important to highlight that the authorities require the manufacturers to determine stall speeds and demonstrate stall characteristics thoroughly, which includes the recovery procedure capability. It is desirable the recovery procedure technique being as conventional as possible and not demand exceptional piloting skills, strength or alertness. Otherwise, it shall be comprehensively substantiated.
2.4.1 Performance: stall speeds
Determining stall speed in-flight is an important issue because it affects landing and takeoff performance, as the reference approach speed, landing, climb, landing-climb, approach-climb and takeoff speed are defined as multiples of VSR (reference
without reflecting in real lift capability of the airplane. VSR may not be less than the 1-g
stall speed and is expressed as:
𝑉𝑆𝑅 ≥ √𝑛 1 𝑉𝑠 (12)
According to FAR 25 § 25.103 requirements (Appendix A.1), stall maneuvers should be executed to demonstrate 𝐶𝐿𝑚𝑎𝑥 with (CG) at the extreme forward position of the airplane flight envelope (± 7% tolerance of CG travel during flight is accepted), because in such case it is the most degraded performance condition (see section 2.2.5). Afterwards, it must be a CL correction for the most forward CG operational
envelope (14 CFR 25.21, Proof of Compliance). Sufficient testing should be conducted to determine the effect of weight on stall speed.
The general procedures for executing stall speeds maneuvers are depicted in AC 25-7C 29.d.(3)(a):
“The airplane should be trimmed for hands-off flight at a speed 13
percent to 30 percent above the anticipated Vsr, with the engines at idle and
the airplane in the configuration for which the stall speed is being determined.
Then, using only the primary longitudinal control for speed reduction, maintain
a constant deceleration (entry rate) until the airplane is stalled (FAA, 20xx).”
The intention of this maneuver is focuses in obtain maximum CL and VSR data.
Once stall definition is achieved, quick recovery is recommended. Then, the maximum lift coefficient CL the data should be corrected for zero thrust, even though it is
determined with idle thrust during flight test, and at last, a correction must be accomplished for the entry rate of -1 kt/s, which means a steady rate of speed reduction of 1 kt/s.
certification authority is likely to address the compliance finding through special conditions.
2.4.2 Flight qualities: stall characteristics
The definition of stall airspeed by Part 25 requirements is linked to the practical concept of minimum useable airspeed. Useable means controllable in the context of a mission task. The investigation of stall characteristics is one of the phases of flying qualities flight test certification program aiming to demonstrate compliance with 14 CFR 25 § 25.201 (Stall Demonstration), § 25.203 (Stall Characteristics) and § 25.207 (Stall Warning). To assure a safe and expeditious recovery from an unintentional stall, the behavior of the airplane during the stall and recovery must be easily controllable using normally expected pilot reactions. It should not require any unusual piloting technique nor should it require exceptional skill or repeated practice by the test pilot. According to 14 CFR 25 § 25.201 and § 25.203 requirements, stall maneuvers should be executed to demonstrate 𝐶𝐿𝑚𝑎𝑥 with Center of Gravity (CG) at the most aft position, which is the most critical condition for longitudinal stability and the recovery maneuver, considering conventional aircraft type designs. Most of fly-by-wire type designs are required to conduct stall characteristics flight tests in the forward CG as well, as per special conditions. Stall characteristics should be investigated with wings level and in a 30-degree banked turn, with both entry rate up to -1 kt/s and up to -3 kt/s (accelerated stalls), with both power or thrust ON and power or thrust OFF (IDLE lever position) and in all configuration (slat/flap, gear up/down and speed brakes deployed) approved for normal operations. For thrust on stalls, power or thrust should be set to the value required to maintain level flight at a speed of 1.5 VSR at the maximum landing weight with flaps in the approach position, and the landing gear retracted. Also, stall characteristics should also be demonstrated with the maximum allowable asymmetric fuel loading.
The general procedures for executing stall characteristics maneuvers are depicted in AC 25-7C 29.e.(3)(a):
power or thrust setting and configuration. Then, using only the primary
longitudinal control, establish and maintain a deceleration (stall entry rate) as
appropriate, until the airplane is stalled.” (p.135).
The same trim reference (for example, 1.23 Vsr) should be used for both the stall speeds and characteristics testing.
For fly-by-wire aircraft, AC 25-7C 29.e.(2)(c) states that::
“Stall characteristics should be investigated with any systems or devices that may alter the stalling behavior of the airplane in their normal functioning mode. Unless the design of the airplane’s automatic flight control system precludes its ability to operate beyond the stall warning
angle-of-attack, stall characteristics and the adequacy of stall warning should be
evaluated when the airplane is stalled under the control of the automatic flight
control system”. (p. 134).
Depending on the aircraft flight control system, its certification may be addressed through special conditions. In exceptional cases and if properly substantiated by the applicant, the aircraft may be certificated with unacceptable stall characteristics, under certification standpoint, since it has demonstrated by system analysis, as per 14 CFR §25.1309, that the stall condition would be extremely improbable to be achieved, which means a 10-9 per flight hour failure rate and no single
failure would result in the stall condition. Pilot error or mishap is not covered by such a requirement.
2.4.3 Stall warning tests
the prescribed bank angles limits, power or thrust settings, and CG position. Again, for DFBW the administrator, requiring different conditions to be tested, may demand type design supplemental special conditions.
Moreover, § 25.207(f) requires the execution of accelerated stall maneuvers, slowdown turns with at least a 1.5g load factor normal to the flight path and an airspeed deceleration rate greater than 2 knots per second, to ensure that adequate stall warning exists to prevent an inadvertent stall under the most demanding conditions that are likely to occur in normal flight. The procedures for executing accelerated stall warning margin maneuvers are described in AC 25-7C 29.g.(2)(c):
“Trim at 1.3 VSR. Once trimmed, accelerate to a speed that will allow
enough time to set up and complete the maneuver at the specified load factor
and airspeed deceleration rate. Set power or thrust appropriate to the power
or thrust for level flight at 1.3 VSR and do not adjust it during the maneuver. In
a level flight maneuver, 1.5g equates to a bank angle of 48 degrees. To
prevent an excessive deceleration rate (e.g., greater than 3 knots per second),
a descent may be used. Conversely, if the deceleration rate is too low, the
maneuver should be conducted in a climbing turn. After the onset of stall
warning, continue the maneuver without releasing stick force for one second before attempting recovery.”
As recommended, maneuver is continued until one second after the stall warning onset. Normally, it does not reach stall definition.
2.4.4 Natural stall tests
not accounted, and others related to the aircraft integration as whole, which may result in the aerodynamic figures not predicted when compared to designed values or even the wind tunnel figures, both which generated the first aerodynamic databank. It may occur towards good side, i.e., more 𝐶𝐿 or less drag (𝐶𝐷) which is not common, towards the bad side, i.e., well below the designed 𝐶𝐿𝑚𝑎𝑥 values and above expected drag figures, or the most common: just in the threshold, missing some lift counts or exceeding by some drag counts.
Either way, the only method to determine the real wing capability is to execute the straight flight stall without any interference of artificial protection (conventional airplane) or maximum alpha envelope protection feature disabled to check during the approach to stall whether the predicted values are being achieved or not. It is normally conducted with mid CG, and afterwards, forward CG (or corrected to the forward CG position) to obtain as close as to the certification conditions values.
2.4.5 Stall FTT Risks
The risks involved with flight test are quite different from those experienced in airliners flight, which are not supposed to operate exploring the limits of the aircraft and beyond the operational limits. Here, it is listed some hazards that can happen while executing stall maneuvers proceeding:
Loss of control In-Flight (LOC-I), due to unpredicted aerodynamic response or unpredicted High AOA protection behavior.
Dual engine failure, due to high AOA at the engine’s inlet, causing inlet flow distortion. It is more likely to happen in high altitudes, because of combination of low density and high AOA at the inlet.
Flight Control System failure. An unpredicted aerodynamic response can also cause air data probes misleading, which can lead to a failure of FCS.
aircraft with tailchute installed and all the flight is supported by a pacer and telemetry with the engineering design office support.
2.5 Section Summary
This section presented the elements of stall theory, which were important ideas for the discussion in this work:
Stall is a lift loss due to flow detachment of wing surface.
Detached flow characteristics: vortical, turbulent, unstable, unpredictable.
Linear model can no longer be representative.
Stall phases are: approach to stall, stall warning, stall definition and post-stall. Current FTTs are defined and executed up to stall definition and does not cover
post-stall region
Stall maneuvers are risky and can lead to a LOC hazardous.
Stall flight tests data is limited to the maneuvers envelope covered by current
FTTs.
Summary of FTTs executed for Part 25 requirements:
3 FLIGHT SIMULATION TRAINING DEVICE (FSTD)
Flight simulators are nearly always used for training pilots in the commercial aviation industry, making the learning process cheaper, safer and more productive when compared to real flight training. Flight Simulation Training Device (FSTD) is defined by FAA in 14 CFR Part 1, section 1.1 - Definitions and Abbreviations, as “a full flight simulator or a flight training device” whose definitions are:
“A Flight Training Device (FTD) is a replica of aircraft instruments, equipment, panels, and controls in an open flight deck area or an enclosed
aircraft cockpit replica. It includes the equipment and computer programs
necessary to represent aircraft (or set of aircraft) operations in ground and
flight conditions having the full range of capabilities of the systems installed in
the device.
Full Flight Simulator (FFS) means a replica of a specific type; or make,
model, and series aircraft cockpit. It includes the assemblage of equipment
and computer programs necessary to represent aircraft operations in ground
and flight conditions, a visual system providing an out-of-the-cockpit view, a
system that provides cues at least equivalent to those of a
three-degree-of-freedom motion system, and has the full range of capabilities of the systems
installed in the device […]” (FAA,1962).
Despite simulation training facilities, the FSTD as any other device has its limitations and fidelity to real aircraft environment is one of them. The objective of this chapter it to describe the main concepts of FSTD fidelity, its dependence on modeling and how transport aircraft aerodynamic models for simulators are obtained and matched with flight test data. Finally, explain current regulations to validate an FSTD. 3.1 FSTD Fidelity
Fidelity is a term that is very commonly used term and it recalls the ideas of similarity, resemblance. Flight Simulator Training Device fidelity can be defined as a measure of the degree to which a simulation system represents a real-world system. (MEYER et al., 2012, p.1). The real-world system applied in the scope of stall training is the aircraft dynamics and flight environmental condition (altitude, turbulence, etc). According to Young and Lenné (2017, p.6), three aspects of simulator fidelity features:
has the same design as the real aircraft cockpit, with buttons, knobs and panels equally spaced and placed just as the real aircraft cockpit.
Functional fidelity: the degree to which the simulated environment behaves like the real environment. It is related to the aircraft dynamics behavior, the simulator must respond the same way to the same pilot inputs just as in the real aircraft.
Psychological fidelity: the degree to which the simulated environment evokes the same psychological processes, such as perceptions, emotions and self-awareness of the real world.
3.2 Preliminary Modeling
Typical flight simulation model, represented in Figure 3-1, includes the equations of motion (EOMs), which are the foundation of all flight simulators. Starting from the inputs, which includes pilot commands, flight controls and wind inputs, basing on aerodynamic and engine terms, the EOMs represents the state of the simulated aircraft, particularly forces, moments, attitude, altitude, heading and velocities (ALLERTON, D., 2009, p.16). During the first stages of the aircraft design process, it is difficult to obtain reliable aerodynamic information, assessing performance, stability and flight handling qualities throughout the flight envelope of the aircraft (AKRAM, U.; CRISTOFARO, M.; DA RONCH, 2016, p.4). Traditional preliminary design methods are based on low–fidelity, linear, small-perturbations assumptions.
Figure 3-1 Typical flight simulation model.
Adapted from: THOMAS GALLOWAY, 31st Flight and Ground Vehicle Simulation Course.
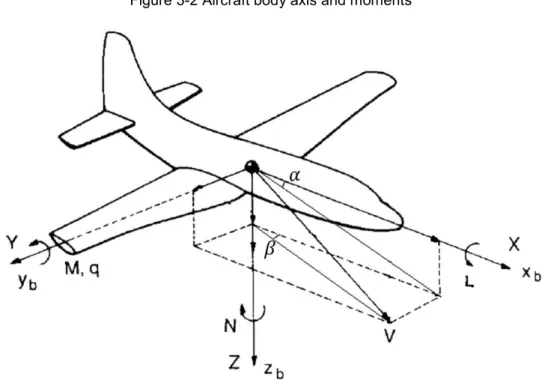
description of the aircraft. The aim is to obtain a database of estimated force coefficients (𝐶𝐿,𝐶𝐷, 𝐶𝑌), moments coefficients (𝐶𝑚, 𝐶𝑙 , 𝐶𝑛) and their derivatives as function of (α, β, 𝛿, M, h, T); where α is the angle of attack (AOA), β is the angle of sideslip (AOS), 𝛿 is the control surface deflection, M is Mach number, h is altitude and T is Thrust (STEVENS and LEWIS, p.75). The aerodynamic coefficients will feed the 6 equations of motion, which are specified in table 3-1.
Figure 3-2 Aircraft body axis and moments
Adapted from: NELSON, Flight stability and automatic control.
Table 3-1. Aircraft forces, moments, and respective axis.
Forces Equation Direction
Drag, D 𝐷 = 𝑞 𝑆 𝐶𝐷 𝑋𝑊 axis
Lift, L 𝐿 = 𝑞 𝑆 𝐶𝐿 𝑍𝑊 axis
Side force, Y 𝑌 = 𝑞 𝑆 𝐶𝑌 𝑌𝑏 axis
Moments Equation Direction
Roll, L 𝐿 = 𝑞 𝑆 𝑏 𝐶𝑙 𝑋𝑏 axis
Pitch, M 𝑀 = 𝑞 𝑆 𝑐 𝐶𝑚 𝑌𝑏 axis
As it is demonstrated in tables, the EOM come from Newton’s 2nd law, sum of
forces and moments in 3 translational and 3 rotational axes, where 𝑞 = 𝜌𝑉2/2 is the dynamic pressure. They may be referred to the aircraft-fixed coordinate system, called body reference frame, with its origin on aircraft’s center of mass. To transform Lift and Drag forces from wind axes to body axes, α and β angles must be accounted. Gravity force is always with respect to an inertial reference frame (earth-fixed) and transformed to body axis by accounting Euler angles: ϕ (roll angle), θ (pitch angle) and ψ (heading angle), represented in Figure 3-3.
Figure 3-3 Euler Angles
Source: Wikipedia. 3.3 Refined Modeling
Preliminary studies derives the first figures for derivatives, moment coefficients and other parameters to estimate aircraft flying qualities and performance. Wind tunnel testing in sub-scaled aircraft model provides realistic data to validate the first simulations and refine the mathematical model by and combining all semi-empirical, analytical, numerical and wind tunnel results. In this phase of aircraft design, conceptual design was finished and aircraft geometry was fixed to build the sub-scaled model. It is applied the Reynolds corrections for real flow and generated an updated aerodynamic databank.
detailed design phase, a prototype is built and flight test data will be provided continue refining model. Flight test assessment improves accuracy of aerodynamic predictions, and it is certainly the most expensive method to obtain the needed parameters (AKRAM, U.; CRISTOFARO, M.; DA RONCH, 2016, p.19). Figure 3-4 timeline briefs the modeling refinement process whilst aircraft development process occurs. The aerodynamic package generated by the aircraft manufacturer has high commercial value and may not be available for public domain. It is generally provided to the simulator manufactures as part of a confidential agreement (ALLERTON, D., 2009, p.17).
Figure 3-4 Aircraft model development process.
3.4 High AOA modeling
3-6), with motions hinges allowing to obtain the rotary steady-state and oscillatory components (FOSTER et al., 2005, p.3). Validating new research methods is also an issue, due to limited post stall flight test data.
Figure 3-5 Roll forced oscilation rig, NASA LaRC 14x22 ft Tunnel
Source: MURCH & FOSTER, Recent NASA Research on Aerodynamic Modeling of Post- Stall and Spin Dynamics of Large Transport Airplanes.
Figure 3-6 Rotary balance rig, NASA LaRC 20 Ft Vertical Spin Tunnel
3.5 Flight Test Data Matching
Once the FSTD model was defined by preliminary studies refined by wind tunnel or flight test data then it must be compared with flight test model, which is obtained by interpolating the data points collected from specific maneuvers in-flight. For advanced simulators, the aerodynamic data accuracy requirements are greater than almost any other application in the aerospace industry, including aircraft certification. While flight test data for aircraft certification should only demonstrate that the aircraft meets some particular characteristics, a simulator model must duplicate exactly the same characteristics (RAeS, 2005, p. A-2).
Therefore, data for simulators should be of the highest quality. Tests should be conducted by qualified personnel in the most stable atmospheric conditions obtainable. Each test run must be started from a fully trimmed, steady state condition with all parameters which can affect the test being known and recorded. Flight test instrumentation should be properly calibrated and all pertinent parameters should be measured. This data is usually provided by the airframe manufacturer because it has the greatest familiarity with its own products and can better identify representative data, which accurately defines the airplane. Although, FAA requirements allows data from third party as described in 14 CFR § 60.13 (b):
“The validation data package may contain flight test data from a source in addition to or independent of the aircraft manufacturer's data in
support of an FSTD qualification, but only if this data is gathered and
developed by that source in accordance with flight test methods, including a
flight test plan, as described in the applicable QPS.” (FAA, 20xx).
Figure 3-7 Aircraft and simulator time-history plots
Source: EMBRAER (For confidential reasons the scale values have been modified).
The matching process, shown in figure 3-8, aims to establish preliminary analytical/numerical/empirical simulator model refined by wind tunnel data into specified tolerances by comparing to flight test data and applying some gains, offsets or bias to adjust the model. It can be done manually or using optimization algorithms, as least squares, linear quadratic regulator (LQR), differential evolution and others.
Figure 3-8 Matching with flight data process.
3.6 FSTD Validation
FSTDs can only be approved for training after the execution validation tests in order to show compliance with 14 CFR Part 60 QPS (Qualification Performance Standards). This test compare simulator performance against the standard, i.e., the airplane flight test or other acceptable data, to check if matching is acceptable. Acceptable means within the tolerances specified by 14 CFR Part 60 requirements for the test to pass or substantiated by rational engineering judgment. When executing validation tests, two different approaches can be considered: objective tests and subjective tests.
response to be compared to flight-test baseline. It might be also possible to conduct each test manually while recording all appropriate parameters.
Subjective evaluation tests are qualitative tests that tries to identify the degree of realism felt by the users’ point of view through a Subject Matter Expert (SME) assessment. A SME is normally a pilot with enough knowledge of the cues necessary to accomplish the required training objectives and experience in piloting the real aircraft which is being tested. Part 60 Table A3A (Functions and Subjective Tests) address pilot functions, including maneuvers and procedures, called flight tasks. While objective tests provide a basis for measuring and evaluating FFS performance, subjective tests provide a basis for determining that the FFS satisfactorily simulates each required task and for verifying correct operation of the FFS controls, instruments, and systems.
The FAA explains the regions and expected confidence levels of the FSTD validation envelope in Attachment 7, section B of Part 60 Appendix A. These regions, shown in Figure 3-9, are defined by the amount and type of validation and analysis used to develop the aerodynamic model. They can be represented as follows:
Figure 3-9 Level of FSTD fidelity regions.
“1. Flight test validated region: This is the region of the flight envelope which has been validated with flight test data, typically by comparing the
performance of the FSTD against the flight test data through tests
incorporated in the QTG and other flight test data utilized to further extend the
3.
Extrapolated
2. Wind
Tunnel
model beyond the minimum requirements. Within this region, there is high
confidence that the simulator responds similarly to the aircraft. Note that this
region is not strictly limited to what has been tested in the QTG; as long as the
aerodynamics mathematical model has been conformed to the flight test
results, that portion of the mathematical model can be considered to be within
the flight test validated region.
2. Wind tunnel and/or analytical region: This is the region of the flight
envelope for which the FSTD has not been compared to flight test data, but
for which there has been wind tunnel testing or the use of other reliable
predictive methods (typically by the aircraft manufacturer) to define the
aerodynamic model. Within this region, there is moderate confidence that
the simulator will respond similarly to the aircraft.
3. Extrapolated: This is the region extrapolated beyond the flight test
validated and wind tunnel/analytical regions. The extrapolation may be a linear
extrapolation, a holding of the last value before the extrapolation began, or
some other set of values. Whether this extrapolated data is provided by the aircraft or simulator manufacturer, it is a “best guess” only. Within this region, there is low confidence that the simulator will respond similarly to the
aircraft”.(FAA-Part 60, 2016, p.232).
New FSTD evaluation requirements for stall recognition and aircraft handling qualities are necessary if training is to be conducted to a full stall. Most aerodynamic modeling on modern FSTDs assumes a certain amount of linearity from objectively validated test points to extrapolate aircraft performance and handling qualities between test points. As an aircraft approaches a stalled flight condition, this linearity can no longer be assumed, and more test points are required to validate the fidelity of the model.
Besides FAA regulations, the International Standards for the Qualification of Airplane Flight Simulators stablishes the requirements for an International Qualification Test Guide. It was agreed following working group meetings and international conferences which provide guidelines for objective and subjective tests.
3.7 Section Summary
Fidelity is the degree to which a simulation system represents a real-world
Aerodynamic modeling of conventional aircraft combines semi empirical,
analytical, CFD, wind tunnel and flight test methods.
Traditional aerodynamic modeling practices for transport aircraft are inadequate
for modeling post-stall motions.
High fidelity confidence requires flight test enough data for validation, which may
not be feasible for high AOA and post stall cases.
A FSTD model based only in wind tunnel data and engineering analysis will be
4 ACCIDENTS THAT MOTIVATED PUBLIC LAW 111-126
United States of America Public Law 111-126 (August, 2010) sec. 208 states that:
“The FAA (Federal Aviation Administration) shall conduct a rulemaking proceeding to require domestic, flag and supplemental air carriers
to provide flight crewmembers with flight training or flight simulator training to
recognize and avoid a stall of an aircraft or, if not avoided, to recover from the
stall” (U.S. Congress, 2010).
When an airplane accident happens, NTSB (National Transportation Safety Board) is the US organization in charge of the investigation (see Figure 4-1), it in some way resembles to CENIPA (Centro de Investigação e Prevenção de Acidentes Aeronáuticos) in Brazil, but with much more broad actuation rather than CENIPA. NTSB, also, exerts a lot of influence in both operational and certification requirements, in the most of cases, issuing recommendations for modifications to sort the probable accident causes out. The other main difference between CENIPA´s role and NTSB´s is the conclusion. CENIPA come with contributing factor for the accident whilst NTSB come with probable cause or the cause itself.
Table 4-1. Aviation organizations and responsibilities.
Responsibility USA Europe Brazil
Regulate all aspects of civil aviation
FAA EASA ANAC
Investigate and prevent airplane accidents
NTSB ENCASIA CENIPA
Figure 4-1 Lessons learned with accident: common x flight 3407 process.
This section analyzes three accidents that had major impact in the public opinion, both because of the number of deaths involved and due to the way they happened. They are: Colgan air flight 3407, Turkish Airlines flight 1951, and Air France flight 447. Although it is known that airplanes accidents are caused by a chain of events, the objective of the following analysis is to focus on the stall aspect, and the pilot’s reaction to stall cues.
4.1 Continental Connection Flight 3407
Continental Connection flight 3407 Newark- Buffalo (see Figure 4-2 map) accident in February 12, 2009, was the biggest motivator for the discussion. The NTSB investigation technical report (2010) evidences crew's unpreparedness in the face of a stall situation and lets several recommendations for the safety of future flights, among them the specific and regular training of pilots in stall approach and recovery.
Figure 4-2 Flight path of light 3407 DHC-8-400 aircraft.
Source: https://www.baumhedlundlaw.com/commuter-plane-crash-near-buffalo-ny-kills-50-people/.
Figure 4-3 Continental Connection Bombardier DHC-8-400 aircraft.
Source: https://en.wikipedia.org/wiki/Colgan_Air_Flight_3407. Access on: 05/21/2018.
4.1.1 History of the flight
On February 12, 2009, a Colgan Air, Inc., Bombardier DHC-8-400 (see Figure 4-3), N200WQ, operating as Continental Connection flight 3407, was on final approach to Buffalo-Niagara International Airport, Buffalo, New York, with the following configuration: landing gear down, flaps at 15º position and both engines’ torque values at minimum thrust. CVR recorded captain and first officer comments recognizing ice conditions. The airspeed was about 145 knots and it was decreasing very quickly. Then the stick shaker warning activated and the autopilot disengaged. At this time the airspeed was about 131 knots. The captain pulled the column aft and, one second later, advanced thrust levers to 70º, increasing engines power to about 75 percent torque. FDR data showed that, while engine power was increasing, the airplane pitched up; rolled to the left, reaching a roll angle of 45° left wing down; and then rolled to the right.