Patrícia Marques Rodrigues
Licenciatura em Bioquímica
Nevirapine in an animal model of
pre-diabetes: study of drug pharmacokinetic
and its effects on fasting glycemia and
insulin resistance
Dissertação para obtenção do Grau de Mestre em
Biotecnologia
Orientador: Sofia de Azeredo Pereira, Professora Auxiliar
Faculdade de Ciências Médicas, UNL
Co-orientador: Sílvia Vilares Conde, Professora Auxiliar
Faculdade de Ciências Médicas, UNL
iii Nevirapine in an animal model of pre-diabetes: study of drug pharmacokinetic and its effects
on fasting glycemia and insulin resistance.
Copyright Patrícia Marques Rodrigues, FCT/UNL
v Financial support was provided by the Portuguese Foundation for Science and Technology (FCT) PTDC/QUI-QUI/113910/2009
vii
The results presented in this thesis originated:
Oral communications in national meetings:
2013 Rodrigues PM, Conde SV, Marinho AT, Antunes AMM, Marques MM, Monteiro EC, Pereira
SA. Nevirapine biotransformation in an animal model of insulin resistance. XLIII Reunião Anual da Sociedade Portuguesa de Farmacologia/ XXXI Reunião de Farmacologia Clínica/ XII Reunião de Toxicologia. Porto.
2013 Rodrigues PM, Conde SV, Pereira SA. Nevirapine biotransformation in an animal model of insulin resistance. Jornadas Intercalares das Dissertações Anuais dos Mestrados. Faculdade de Ciências e Tecnologia – Universidade Nova de Lisboa. Lisboa.
Poster communications in national meetings:
2013 Rodrigues PM, Conde SV, Sacramento JF, Marinho AT, Ribeiro MJ, Antunes
AMM, Marques MM, Monteiro EC, Pereira SA. New insights on personalized medicine – drug response variation in type II diabetes. The Nevirapine Story. Fundação AstraZeneca Innovate Competition – iMed, Lisbon (October).
Award in national meeting:
2013 Rodrigues PM, Conde SV, Sacramento JF, Marinho AT, Ribeiro MJ, Antunes AMM,
Marques MM, Monteiro EC, Pereira SA. Honoroble mention for best poster on the "5.0 iMed Conference", about New insights into personalized medicine – drug response variation in type II diabetes. The nevirapine story.
The participation in other ongoing projects of the research team originated the follow publications in
international scientific journals:
2013 Marinho AT, Rodrigues PM, Caixas U, Antunes AMM, Branco T, Harjivan SG, Marques MM,
ix
Acknowledgment
Em primeiro lugar, gostaria de agradecer à Prof. Doutora Sofia Pereira e à Prof. Doutora Sílvia Conde a oportunidade e confiança que me foi dada ao longo destes meses… sem elas nada disto era possível. À Professora Sofia agradeço pelos valores e ensinamentos que me transmitiu. Agradeço também por me ter ensinado a não desistir e a fazer sempre mais e melhor. À Prof. Sílvia agradeço por “partilhar” comigo o mundo da “diabetes” e da experiência animal.
Gostaria de agradecer também à Prof. Doutora Emília Monteiro, por ter tornado possível a minha integração no laboratório de Farmacologia.
Gostaria de agradecer também à Prof Doutora Matilde Marques e à Prof. Doutora Alexandra Antunes por me fornecerem a “matéria-prima” para a realização deste estudo - nevirapina e seus metabolitos.
Agradeço também à Clara e Raquel por ouvirem os meus desabafos, por terem sempre uma palavra amiga, pelas risadas juntas e claro pela bela hora da pausa.
Quero também agradecer ao restante laboratório. À Aline, pela generosidade que sempre demonstrou desde o primeiro dia que cheguei. Pela paciência para as minhas dúvidas e por estar sempre pronta a ajudar. À Joana Sacramento por todos os ensinamentos que me transmitiu na experiência animal. Sem a ajuda dela provavelmente as experiências não teriam corrido da mesma forma. À Nádia por nunca recusar um pedido, por se prontificar a ajudar e claro pela partilha de informações sobre séries (Game of Thrones e agora Homeland…). À Maria João pela alegria espontânea e contagiante e claro pelos momentos musicais. À Inês pela ajuda que me deu, especialmente na quantificação dos aminotióis. À Joana Batuca pela sua simpatia.
Agradeço aos meus amigos pelos momentos de descontração e por terem sempre palavras de motivação. Agradeço especialmente à Margarida por ouvir sempre um resuminho do meu dia!
E claro, agradeço à minha família. Aos meus pais pela educação e pelos valores transmitidos e por me incentivarem a dar o máximo e o melhor de mim. À minha irmã por facilitar nestes dias a escrita da minha tese e pela paciência. Agradeço especialmente à minha mãe pelos conselhos, por nestes dias ouvir os meus desabafos, acreditar sempre em mim e por me transmitir imensa força para continuar.
xi
Abstract
The increased incidence of type II diabetes has emerged as a major concern in controlled human immunodeficiency virus (HIV) infection. There is a general lack of data to support the best combined antiretroviral therapy (cART) option to treat HIV-patients with pre-diabetes and nevirapine has been described has a glucose-friendly antiretroviral. On the other hand, it is known that diabetes could influence the pharmacokinetics of several drugs. This aspect is particularly relevant for drugs with narrow therapeutic window, which is the case of nevirapine.
To understand if nevirapine is a good choice for pre-diabetic HIV-patients, the effect of insulin resistance in NVP pharmacokinetics as well as the effect of nevirapine on insulin resistance, fasting glycemia and mean arterial pressure was evaluated. Moreover, nevirapine effect on thiols content, an endogenous antioxidant defence system, was also evaluated. To achieve the main goal four groups of female Wistar rat were used: a control group, a control group treated with nevirapine, an insulin resistant group and an insulin resistant group treated with nevirapine.
An influence of a pre-diabetic status on nevirapine pharmacokinetic was found. Nevirapine and its phase I metabolites presented changes in disposition and the metabolite profile pattern was changed. Moreover, nevirapine, in a pre-diabetic perspective, is associated with a beneficial effect on fasting glycemia, while it has no effect on sensitivity to insulin or in arterial pressure. Furthermore, nevirapine is associated with a lower degradation of total glutathione.
Nevirapine might be a good option for HIV-infected patients at higher risk of develop diabetes or in pre-diabetic condition. Moreover, while further studies are necessary to consolidate this issue, nevirapine might be less toxic in pre-diabetes. Although, the decreased bioavailability of nevirapine in pre-diabetes requires special attention, as an adjustment of nevirapine dose might be required in this subpopulation.
Keywords: nevirapine, pre-diabetes, insulin resistance, drug toxicity, antioxidant defense
xiii
Resumo
A incidência de diabetes tipo II na infecção pelo vírus da imunodeficiência humana (VIH) tem vindo a aumentar. A evidência científica que justifique a melhor opção terapêutica para doentes VIH positivos pré-diabéticos é actualmente muito limitada. No entanto, a nevirapina tem-se destacado por apresentar uma influência favorável no metabolismo da glucose. Por outro lado, as alterações na farmacocinética dos medicamentos num contexto de diabetes estão bem documentadas. Este aspecto é de grande importância para um fármaco com uma janela terapêutica estreita, de que é exemplo a nevirapina.
De forma a explorar a indicação da NVP para indivíduos pré-diabéticos VIH positivos, o efeito da insulinorresistência na farmacocinética da nevirapina, assim como o efeito da nevirapina na resistência à insulina, glucose em jejum e pressão arterial foi avaliado. Para atingir este objectivo, recorreu-se a quatro grupos constituídos por ratos Wistar fêmeas: grupo controlo, grupo controlo tratado com nevirapina, grupo insulinorresistente e grupo insulinorresistente tratado com nevirapina.
A influência da pré-diabetes na farmacocinética da nevirapine foi comprovada manifestando-se como uma variação na disposição da nevirapina e seus metabolitos de fase I, assim como um diferente perfil de metabolitos. Para além disso, o tratamento com nevirapina parece estar associado a uma melhoria dos níveis de glucose em jejum e a uma menor degradação do glutatião. Estes novos dados sugerem que a nevirapina possa ser eleita como uma boa opção para doentes VIH positivos com elevado risco para desenvolver diabetes ou pré-diabetes. Por outro lado, e apesar da necessidade de mais estudos para consolidar esta hipótese, a nevirapine poderá ser menos tóxica num contexto de pré-diabetes. Por último é relevante salientar que a diminuição da biodisponibilidade da nevirapina na pré-diabetes requer uma especial atenção, pela possível necessidade de um ajuste de dose nesta sub-população.
Palavras-chave: nevirapine, pré-diabetes, resistência à insulina, toxicidade medicamentosa,
xv
Table of contents
Acknowledgment ...ix
Abstract ...xi
Resumo...xiii
Table of contents ...xv
Index of figure ...xvii
Index of tables ...xix
Abbreviations ...xxi
1. Introduction ... 1
1.1
Human immunodeficiency virus infection and the combined antiretroviral therapy ... 3
1.2
Human immunodeficiency virus infection and the combined antiretroviral therapy and type
II diabetes ... 4
1.3
Type II diabetes ... 6
1.4
Drug cycle and drug bioactivation ... 7
1.4.1
Drug bioactivation and its implication on its toxicity ... 8
1.4.2
Diabetes and drug bioactivation ... 9
1.5
Nevirapine ... 11
1.5.1
The Pharmacokinetic properties of nevirapine and its toxic reactions ... 11
1.6
Rational, aim and work plan ... 13
2. Materials and Methods ...15
2.1
Animals maintenance and study group ... 17
2.1.1
Blood sampling and liver collection... 18
2.2
Pharmacokinetic assessment ... 18
2.2.1
Drugs and reagents... 18
2.2.2
Preparation of calibration solutions ... 18
2.2.3
Sample pre-treatment ... 19
2.2.4
High-performance liquid chromatography (HPLC) analysis ... 19
2.3
Fasting glycemia, insulin sensitivity and mean arterial pressure assessment ... 20
2.3.1
Drugs and reagents... 20
2.3.2
Measurement of insulin sensitivity ... 20
2.3.3
Measurement of blood pressure ... 20
2.4
Antioxidant assessment in rat plasma and liver: the aminothiols. ... 20
2.4.1
Reagents ... 20
xvi
2.4.2.1
Standard preparation ... 21
2.4.2.2
Sample preparation ... 21
2.4.2.3
High-performance liquid chromatography (HPLC) with fluorescence analysis. ... 21
2.4.3
Aminothiol measurement in liver... 22
2.4.3.1 Standard preparation ... 22
2.4.3.2 Sample preparation ... 22
2.4.3.3 High-performance liquid chromatography (HPLC) with fluorescence analysis... 22
2.5
Statistical data analysis... 23
3. Results ...25
3.1
Effect of pre-diabetes on nevirapine disposition and biotransformation ... 27
3.2
Effect of nevirapine on fasting glycemia, insulin resistance and blood pressure in
pre-diabetic rats ... 27
3.3
Effect of nevirapine on thiol system ... 31
4. Discussion...33
5. Conclusion ...43
6. References ...47
xvii
Index of figure
Figure 1.1 - The life cycle of HIV infection and antiretroviral drug class target. In: (Smith et al.,
2013) ... 4
Figure 1.2 - Representation of glucose homeostasis. In: (Kahn, 1994) ... 7
Figure 1.3 - Toxicity related with drug biotransformation. In: (Williams et al., 2012). ... 8
Figure 1.4 - A 3-step mechanistic working model of hepatotoxicity: initiation, progression and tissue repair (or damage). In (Wang et al., 2007). ... 9
Figure 1.5 - NVP biotransformation, disposition and proposed bioactivation pathways. In: (Marinho et al., 2013). ... 12
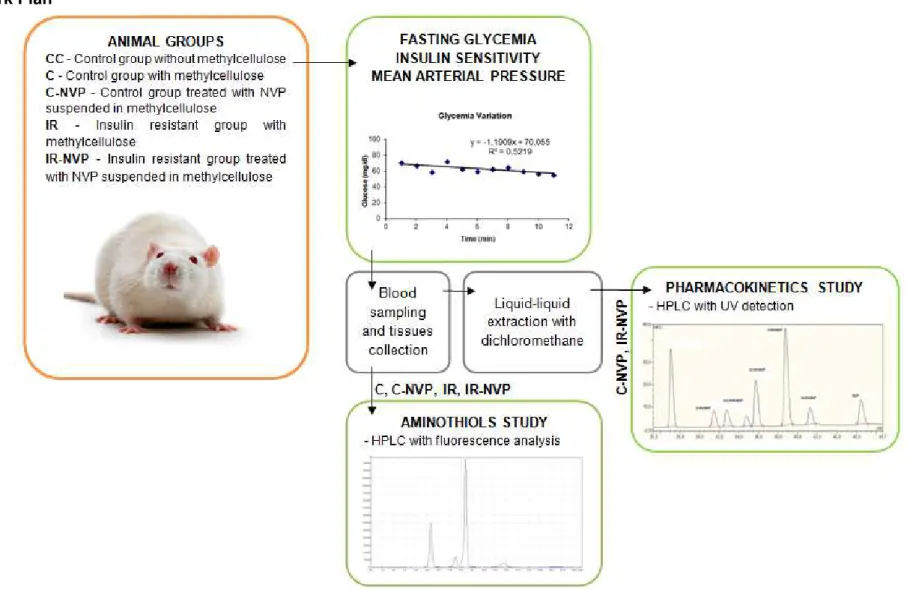
Figure 1.6 - Illustrative summary of work plan………..14
Figure 2.1 - Animal maintenance and study groups. ... 17
Figure 2.2 - Representative chromatogram of a mixture of nevirapine (NVP) and its phase I metabolites under the conditions described previously. The analyte concentrations were 2.5ng/mL. ... 19
Figure 2.3 - Representative chromatogram of aminothiols. ... 22
Figure 3.1 - Nevirapine and its phase I metabolites in plasma (A) and liver (B). ... 28
Figure 3.2 - Nevirapine/12-hydroxy nevirapine (NVP/12-OH NVP) and Nevirapine/ 2-hydroxy nevirapine (NVP/2 OH NVP) ratios in plasma (A) and liver (B). ... 29
Figure 3.3 - Effect of NVP intake in mean arterial pressure (A), basal glycemia (B) and insulin sensitivity (C). ... 30
Figure 3.4 - Plasma concentrations of Total Aminothiol ... 31
Figure 3.5 - Liver concentrations of Total Aminothiol ... 32
xix
Index of tables
xxi
Abbreviations
2-OH NVP 2-hydroxy nevirapine 3-OH NVP 3-hydroxy nevirapine 8-OH NVP 8-hydroxy nevirapine 12-OH NVP 12-hydroxy nevirapine
cART Combined antiretroviral therapy CYP P450 Cytochrome P450 enzymatic system
Cys Cysteine
Cys-Gly Cysteinyl-Glycine
HAART Highly active antiretroviral therapy
HCys Homocysteine
HIV Human Immunodeficiency virus
HPLC High-performance liquid chromatography
HSu High-sucrose
GSH Glutathione
IR Insulin resistance
ITT Insulin Tolerance Test
KITT Constant rate for glucose disappearance in the insulin tolerance test
MAP Mean arterial pressure
MC Methylcellulose
NAC N-acetyl cysteine
NNRTI Non-nucleoside reverse transcriptase inhibitors NRTI Nucleoside reverse transcriptase inhibitors
NVP Nevirapine
PBS Phosphate buffered saline
PD Pharmacodynamic
PI Protease Inhibitor
PK Pharmacokinetic
1
3
1.1
Human immunodeficiency virus infection and the combined
antiretroviral therapy
The numbers of HIV-infection are tremendous: from 2001 to 2011 this figure increased by 5 million people, reaching 34 million of infected individuals, which correspond to 0.8% of adult population worldwide. In this scary scenario, the health promotion regarding this infection and the availability of combined antiretroviral therapy (cART) in middle 90’s have totally revolutionized the prognostic of this infection, which nowadays is considered a chronic condition in properly medicated patients. The good numbers reflect the increased decline in HIV-associated deaths of approximately 600 thousands from 2005 to 2011. Moreover, during the year 2011, the number of persons which had benefit from anti-HIV treatment, increased by 1.6 million people (World Health Organization, 2013). Currently there are more than 20 antiretroviral drugs available, distributed into five major classes which are classified according their mechanisms of action (Figure 1.1).
The choice of cART for a particular patient and the optimal times for its start should be in agreement with several elements, such as clinical manifestations, the number of lymphocytes CD4 (<350 cell/mm3), the value of plasma viral load and the presence of co-morbidities. The first-line cART
is normally composed by two nucleoside reverse transcriptase inhibitors (NRTI) combined with a third drug which should be preferentially a non-nucleoside reverse transcriptase inhibitor (NNRTI), namely efavirenz or nevirapine (Guerreiro et al., 2012).
4 Figure 1.1 - The life cycle of HIV infection and antiretroviral drug class target. In: (Smith et al., 2013) These classes target the following steps in the HIV life cycle: binging and fusion, reverse transcription, integration, transcription, assembly and finally budding. Entry inhibitors interfere with viral entry into the host cell; nucleoside reverse transcriptase inhibitors (NRTI) inhibit the HIV protein reverse transcriptase; non-nucleoside reverse transcriptase inhibitors (NNRTI) also inhibits the reverse transcriptase enzyme but in a non-competitive manner; protease inhibitors (PI) inhibit the protease enzyme and thus the HIV replication; integrase inhibitors (INI) interfere with viral integrase which is responsible for viral DNA interaction in human immune cells; maturation inhibitors disrupt the final step in the processing of the HIV gag protein (De Clercq, 2007; Richards and McCallister, 2008).
1.2
Human immunodeficiency virus infection and the combined
antiretroviral therapy and type II diabetes
Improved methods for detection of HIV, an earlier HIV diagnosis as well as a better management of cART have translated this infection into lesser morbidity and mortality and a consequent longer lifespan. Although, in clinical practice, it has meant an increase in the chronic complications associated with this infection (Deeks and Phillips, 2009).
5 instance, in 130 children aged 10 years, it was observed a 13.2% prevalence of IR associated to cART (Beregszaszi et al., 2005). Also, in a young adult cohort of 755 HIV-infected patients with a mean age among 36-48 years, a prevalence rate of 4.5%, 9.4% and 11.9% of diabetes, impaired fasting glucose and hyperinsulinemia was respectively found (Calza et al., 2011)
.
The mechanism for this is unknown but it is thought to either be due to the infectious/inflammatory process of HIV itself or a form of drug induced toxicity or perhaps through indirect effects. Beyond the conventional risk factors as family history, hypertension, male gender, certain ethnic backgrounds or culture aging (Kilby and Tabereaux, 1998), the individuals infected with HIV have additional factors that contribute to a higher risk. These factors include chronic inflammation caused by the virus, viral factors (viral burden, lower CD4 count and duration of viral infection) (Kilby and Tabereaux, 1998; Capeau et al., 2012), co-pathologies diseases (e.g., chronic hepatitis C infection (HCV)) (Mehta et al., 2003) and factors related with antiretroviral drugs (Lewis et al., 2003; Limone et al., 2003). Despite there is no predominant metabolic effect for each antiretroviral class, the most undesirable metabolic effects have been described for protease inhibitors (PIs) (Murata et al., 2000; Noor et al., 2004; Stanley et al., 2009). The influence of nucleotide reverse transcriptase inhibitors (NRTIs) is controversial and dependent on each particular drug (Mulligan et al., 2000; Justman et al., 2003; Brown et al., 2005; Tien et al., 2007; De Wit et al., 2008). The NNRTI NVP has been described has a drug with a favorable glucose-insulin profile (Eastone and Decker, 1997; De Wit et al., 2008) and was recently indicated has a protective factor for pre-diabetic HIV-infected patients (Srivanich et al., 2010).
The NNRTI-based cART has been usually prescribed as the first-line treatment in resource-limited settings for several years (Sungkanuparph et al., 2006; Katabira and Oelrichs, 2007; Kiertiburanakul et al., 2007; Manosuthi et al., 2007). Moreover, the portuguese guidelines for HIV treatment have recently recommend first-generation NNRTI-containning cART as the preferred option for first-line therapy (Guerreiro et al., 2012).
6
1.3
Type II diabetes
Type II diabetes (TIIDM) (formerly called non-insulin-dependent or adult-onset) results essentially from the interaction of insulin resistance (IR) and insulin secretion deficiency (β-cell dysfunction) (Leahy, 2005). IR is defined as a decrease ability of insulin to be sensed by peripheral tissues (liver, muscle, fat) to stimulate glucose metabolism and/or inhibit hepatic glucose output. This condition will influence the glucose homeostasis (Figure 1.2). Several mechanisms as the serine phosphorylation of
IRS-1 (Pratipanawatr et al., 2001; Zhande et al., 2002), excess glucosamine (Marshall et al., 1991), defective mitochondria (Nyholm et al., 1997; Kelley et al., 2002) or alternate fatty acid effects (Saha and Ruderman, 2003; Schrauwen and Hesselink, 2004) have been proposed to explain this phenomenon. On the other hand, the impaired insulin secretion is characterized by a defect in the glucose-stimulated insulin secretion due dysfunction and/or reduction of a number of pancreatic islet β-cell (Kahn, 2000). The reason for this defect is still unknown; however there are many proposed pathological processes such as, glucose toxicity (Jonas et al., 1999; Weyer et al., 1999), beta-cell exhaustion (Greenwood et al., 1976; Laedtke et al., 2000), impaired pro-insulin biosynthesis (Olson et al., 1998) and lipotoxicity (McGarry and Dobbins, 1999; Robertson et al., 2004).
In addition to TIIDM, the combination of hyperglycemia and hyperinsulinaemia is also associated to other metabolic disorders including dyslipidemia, coronary heart disease and lipodystrophy and metabolic syndrome. Furthermore, chronic hyperglycemia plays even a significant role in many diabetes complications such as macrovascular (e.g. myocardial infarction, stroke) and microvascular damage (e.g. nephropathy, retinopathy, neuropathy) (Engelgau et al., 2004).
7 Figure 1.2 - Representation of glucose homeostasis. In: (Kahn, 1994)
This system depends upon a balance between glucose production (liver) and glucose uptake by peripheral tissues (fat and muscle, and brain). The hormones glucagon and insulin regulated this equilibrium. Insulin is released in order to reduce the glucose level in the blood whereas glucagon promotes hepatic glucose production.
1.4
Drug cycle and drug bioactivation
When administered orally, the drug penetrates the epithelial cells in the gastrointestinal tract and reaches the liver via hepatic portal vein, before entering in systemic circulation - a process called absorption. During the passage for gastrointestinal tract and the liver, a percentage of the drug may be lost due to the presence of enzymes responsible for biotransformation, the presence efflux drug transporters and excretion – this is known as first-pass effect (Le, 2012).
After its absorption, the drug is distributed by the several tissues. The rate and extent of this distribution is directly influenced by interactions of the drug with body components, which depend on both the physiochemical properties of the drug (e.g. lipid solubility, pK or molecular weight) and physiological parameters (e.g. pH, extent of plasma protein binding, blood flow or nature of the tissue) (Gibson and Skett, 2001)
8 In the phase I reactions, the most important player is the enzymatic system cytochrome (CYP) P450, which catalyzes the oxidation of many drugs. These enzymes can be induced or inhibited by many drugs or food components, which can consequently enhances the drug toxicity or reduce it therapeutic effect. In respect to the phase II phase, glucuronidation, sulfation and glutathione conjugation are the most prevalent reactions, which may occur directly on the parent compounds or, as normally happens, on the products of phase I (Xu et al., 2005).
Although, the major intend of biotransformation is to inactivate and detoxify drugs that can harm the body, drugs upon biotransformation can also undergo bioactivation chemically reactive electrophilic or radical products that are potentially toxic by themselves or that produce oxidative stress (Figure 1.3)
(Zhou et al., 2005; Walsh and Miwa, 2011).
The electrophilic intermediates are capable of covalently modifying macromolecules (protein, nucleic acids, lipids), giving rise to the formation of drug-macromolecule adducts, which has long been associated with drug toxicity (Pumford et al., 1997; Poirier et al., 2000).
Figure 1.3 - Toxicity related with drug biotransformation. In: (Williams et al., 2012).
1.4.1 Drug bioactivation and its implication on its toxicity
The liver is a major target organ for many toxic chemicals/drugs since it is the first site of drug metabolism and bioactivation. Moreover, the resulting reactive electrophiles could attack hepatic proteins readily because of their proximity (Abboud and Kaplowitz, 2007). The liver has an extraordinary ability to regenerate in response to cell damage.
9 Upstream events in hepatocytes lead to exposure to electrophilic metabolites, which undergoes covalent binding after preferential depletion of glutathione (GSH). Then, upstream events promote intracellular stress, production of inflammatory mediators and mild injury which activates the innate immune system. Hepatoprotective mediators are secreted to restore cellular and organ structure and function and balance of pro- and anti-inflammatory responses, the interplay of which determines progression to severe injury or no injury (Chanda and Mehendale, 1995; Liu et al., 2004).
Figure 1.4 - A 3-step mechanistic working model of hepatotoxicity: initiation, progression and tissue repair (or damage). In (Wang et al., 2007).
1.4.2 Diabetes and drug bioactivation
The compensatory liver tissue repair is compromised in diabetes (Sawant et al., 2004; Sawant et al., 2006; Wang et al., 2007), as this pathology is associated to a sluggish tissue repair response. The high glucose concentration is implicated in inhibition of the hepatocyte proliferation (Caruana et al., 1986; Chanda and Mehendale, 1995; Rao et al., 1999). Also, the elevated levels of glucose and free fatty acid in plasma characteristic of diabetes are associated with an increasing production of free radicals and a diminishing of body antioxidant defences (Maritim et al., 2003). In addition, glucose is also involved in the production of advanced glycation end-products (AGEs) which inactivate and modify enzymes as well as also promote free radical formation. Moreover, it has been proposed that AGEs might cause functional alterations in hepatocytes, leading to retarded cell proliferation and tissue repair (Cerami et al., 1988; Chanda and Mehendale, 1995). The hyperglycemia impairs the antioxidant system, being glutathione (GSH) ,the most abundant low-molecular-weight thiol, one of the major and important scavengers of endogenous free radicals and drug electrophic toxic metabolites (Dickinson and Forman, 2002).
10 cycle steps (Table 1.1). While the effects of diabetes mellitus on drug PK and PD properties have
been well described in experimental animal models; minimal clinical data exists for humans (Dostalek et al., 2012).
The compromised liver repair on diabetes and initial drug bioactivation-based liver damage potentiate hepatotoxicity of drugs in diabetes context.
Table 1.1 – The effect of TIIDM in drug PK.
PHARMACOKINETIC
PRINCIPLES EFFECT OF TIIDM REFERENCES
Absorption
REDUCED intestinal transit time
(Jung et al., 2003; Wu et al., 2004; Triantafyllou et al., 2007)
REDUCED gastric mucosal blood flow (Zhu, 1993)
NO CONSENSUAL gastric emptying time: - Decreased
- Unchanged - Increased
(Keshavarzian et al., 1987; Nowak et al., 1995; Lyrenas et al., 1997) (Kong et al., 1999) (Frank et al., 1995; Schwartz et al., 1996)
Distribution
REDUCED protein binding capacity (MacKichan, 2006)
INCREASED free fraction of drugs (Ruiz-Cabello and Erill, 1984; MacKichan, 2006)
Biotransformation
INCREASED enzymatic activity (e.g. CYP 2E1) (Dostalek et al., 2011)
DECREASED enzymatic activity (e.g. CYP 3A4)
(Kotlyar and Carson, 1999; Brill et al., 2012); (Dostalek et al., 2011)
11
1.5
Nevirapine
Nevirapine (NVP) was the first NNRTI approved by the U.S. Food and Drug Administration (FDA) in 1996 (FDA, 1996). This first generation NNRTI is known for its efficacy in prevention of mother-to-child HIV-transmission, with the drug being commonly indicated for pregnant women and their mother-to-children (Marseille et al., 1999; Ades et al., 2000; Lallemant et al., 2004; AIDS, 2012). Moreover, NVP is described by having a favorable lipid and metabolic profile rendering it suitable for use in individuals with diabetes, dyslipidemia and other metabolic disorders (Ruiz et al., 2001; Clotet et al., 2003). Furthermore, NVP also stands out for being the most used antiretroviral in countries with limited resources due to its low cost (Ades et al., 2000). These benefits represent the mean why NVP is globally the most prescribed antiretroviral.
Although the clinical benefits presented, NVP is associated with undesirable adverse effects. Among the clinical complications, the most common is skin rash and the most severe is hepatotoxicity. These reactions may lead to drug discontinuation or even be fatal (Cattelan et al., 1999; Taiwo, 2006; De Lazzari et al., 2008; Medrano et al., 2008). Moreover, NVP can induce hepatocellular neoplasias in animal models (Anonymous 2009), and recent epidemiological data suggest an association between chronic NNRTI use and an increased incidence of non-AIDS-defining cancers in HIV-1-infected patients (Powles et al., 2009).
The mechanisms underlying NVP toxicity are still not fully understood; however the current evidence is strongly consistent with a higher risk in women (Ho et al., 1998; Antinori et al., 2001; Bersoff-Matcha et al., 2001) and a subjacent immune mediation (Martin et al., 2005; Taiwo, 2006; Yuan et al., 2011; Dong et al., 2012). To allow for sex differences in immune hyper-reactivity, it is recommended that in cART-naive women NVP should be initiated only in those with a CD4+ cell count < 250 cells/mm3, whereas in men this cut-off is 400 cells/mm3 (Thompson et al., 2010).
The administration of NVP starts with a 200mg dose for the first 14 days and then followed by a 400 mg daily dose. The lower dose in the first weeks is recommended by therapeutic schedule to minimize toxic events.
1.5.1 The Pharmacokinetic properties of nevirapine and its toxic reactions
As a highly lipophilic molecule, NVP is readily absorbed (greater than 90%) after oral administration. NVP is about 60% bound to plasma proteins, crosses the placenta and blood–brain barrier, and is found in breast milk (Mirochnick et al., 2000).
12 The attempts tocorrelate NVP exposure and toxicity outcomes have so far been inconclusive(de Maat et al., 2003; Regazzi et al., 2003; Almond et al., 2004; Kappelhoff et al., 2005; Hall and MacGregor, 2007),which suggests that NVP biotransformation to reactive metabolites, rather than the levels of the parent drug, may be the basis of the drug’s adverse effects. Whether or not and how these metabolites promote hypersensitivity reactions is unknown, but protein haptenation might be involved. In fact, upon bioactivation, these metabolites may generate electrophilic species (Chen et al., 2008; Srivastava et al., 2010) capable of binding covalently to proteins and other biomacromolecules (Figure 1.5) (Chen et al., 2008; Antunes et al., 2009; Wen et al., 2009; Srivastava et al., 2010; Caixas
et al., 2012; Sharma et al., 2013). The involvement of phase II reactions, and particularly the sulphotransferase (SULT)-mediated formation of 12-sulphoxy NVP from 12-hydroxy NVP, has recently gained increased support as a major player in this context (Chen et al., 2008; Antunes et al., 2009; Wen et al., 2009; Antunes et al., 2010; Meng et al., 2013; Sharma et al., 2013),with protein adducts from this pathway having already been detected in patients on therapeutic doses of NVP (Caixas et al., 2012; Meng et al., 2013).
.
Figure 1.5 - NVP biotransformation, disposition and proposed bioactivation pathways. In: (Marinho et al.,
2013).
13
1.6
Rational, aim and work plan
What we know?
• The number of HIV/infected patients with pre-diabetes is increasing;
• The NNRTIs efavirenz and nevirapine based cART are recommend first line choice; • NVP is a protective factor for pre-diabetes;
• Diabetes influences drug pharmacokinetics and toxicokinetics;
• NVP is a drug with a narrow therapeutic window: sub therapeutic NVP concentrations are associated with therapeutic failure and resistance development and higher NVP concentrations predispose for toxicity;
• NVP is toxic to the skin and liver and the first steps mechanism underlying it involve bioactivation of its phase I metabolite 12-OH NVP and protein adducts formation;
• Glutathione is a defense system for adducts formation and hepatotoxicity prevention, which levels are decreased in diabetes.
What we need to know?
• What is the effect of pre-diabetes on NVP pharmacokinetics? • What is the effect of pre-diabetes on NVP metabolites profile? • What are the effects of NVP on glycemia and insulin sensitivity? • What are the effects of NVP in thiols antioxidant system?
Generally, is expected to give new insights on the applicability of NVP in HIV infected patients with pre-diabetes, in the view of NVP pharmacokinetic changes induced by diabetes and the consequent effect on its efficacy and toxicity.
The specific aims of this
work are:• To evaluate the pre-diabetes effect on:
- Plasmatic and hepatic NVP bioavailability;
- NVP biotransformation, phase I metabolites (12-OH NVP and 2-OH NVP) bioavailability and metabolite profile.
• To evaluate the NVP effect on:
- Fasting glycemia, insulin sensitivity and mean arterial pressure;
14
Work Plan
15
17
2.1
Animals maintenance and study group
The animals were females obtained from the vivarium of the NOVA Medical School (FCM), NOVA University (UNL), where were kept under temperature and humidity control (21±1 ⁰C; 55±10% humidity) with 12/12h light/dark cycles and fed a standard chow (7.4% fat + 75% carbohydrate (4% sugar) + 17% protein; SDS diets RM1 (Probiológica, Sintra, Portugal)).
All procedures were followed in accordance to the European Union Directive for Protection of
Vertebrates Used for Experimental and Other Scientific Ends (2010/63/ EU) and were previously approved by Ethic Committee for Animal Care and Use at FCM-UNL.
Five groups of rats aged between 11 to 20 weeks (0.22-0.30 kg) were used: Control group without methylcellulose (CC); Control group with methylcellulose (C); Control group treated with NVP solved in methylcellulose (C-NVP); Insulin resistant group with methylcellulose (IR); Insulin resistant group treated with NVP solved in methylcellulose (IR-NVP).
NVP (Cipla, Maharashtra, India) was administered at a dose of 40 mg/kg/day in a 0.5% methylcellulose solution (MC) in the drinking water bottles, during 8 days. Methylcellulose was used to facilitate dissolution of NVP (Mitchell et al., 2003).
The insulin resistant animal model (IR group) used was the high sucrose (HSu) rat, a lean model of combined insulin resistance and hypertension (Ribeiro et al., 2005; Conde et al., 2012), which was obtained by submitting the animals to 35% of sucrose GPR Rectapur (VWR, Belgium) in drinking water during 28 days (Figure 2.1).
In IR-NVP group, NVP was administered during 8 days after the 28 days of HSu diet. C and IR groups were also administered with the vehicle 0.5% methylcellulose (MC) (Sigma-Aldrich Corporation, St. Louis, MO, USA) in drinking water (Figure 2.1).
CC group
C group
C-NVP group
IR group
IR-NVP group
Sta
nd
a
rd c
ho
w 0.5% methylcellulose (8 days)
NVP solved in 0.5% methylcellulose (8 days)
HSu diet (28 days) + 0.5% methylcellulose (8 days)
HSu diet (28 days) + NVP solved in 0.5% methylcellulose (8 days)
Figure 2.1 - Animal maintenance and study groups.
18 Drinking water daily intake was measured to monitor nevirapine and/or sucrose ingestion, depending on group. Animal body weight was assessed twice per week.
On the last day of the experimental protocol, the rats were fasted overnight and allowed free access to water or nevirapine solution, according to the groups.
After that, the animals were anesthetized with intraperitoneal sodium pentobarbital (60 mg/kg) and were transferred to a heating pad to maintain body temperature at 37.5±0.5 ⁰C throughout the experiment.
2.1.1
Blood sampling and liver collection
After insulin sensitivity and mean arterial pressure (MAP) measurements (Section 2.3.2.2), blood
was collected by heart puncture into EDTA pre-coated tubes. The plasma was obtained by blood centrifugation (Sigma Laborzentrifugen 2K15, Osterode am Harz, Germany) at 3000 g and 4 ⁰C, for 10 minutes. The liver was extracted and cryopreserved at -80 ⁰C, until posterior study.
2.2
Pharmacokinetic assessment
2.2.1
Drugs and reagents
The ammonium acetate was obtained from Merck S.A. (Darmstadt, Germany) and acetonitrile from Lab-Scan, analytical sciences (Gliwice, Poland). Nevirapine was obtained from Cipla (Maharashtra, India) and the 2-OH, 3-OH, 8-OH and 12-OH NVP metabolites were synthesized as previously described (Antunes et al., 2010) and used as standards for HPLC quantification. The other reagents used were mainly purchased from Sigma-Aldrich Corporation (St. Louis, MO, USA).
2.2.2
Preparation of calibration solutions
19
2.2.3
Sample pre-treatment
A liquid-liquid extraction procedure was performed. Briefly, dichloromethane was added to Wistar rat plasma (250 µL) in a proportion of 1:10 and liver homogenate (12 mL) in a proportion of 1:2. The organic phase was recovered and the aqueous phase was re-extracted. Two and three extractions were performed to plasma and liver, respectively. The total organic phase obtain were collected and dried under vacuum (Centrivap micro IR, Labconco (Kansas City, USA)) at 60 ⁰C. The solid residues were reconstituted in 150 μL of water:methanol (50:50) mixture, centrifuged (13 000 g, 3 minutes, 4 ⁰C) for suspension removal and insert into high-performance liquid chromatography (HPLC) vials.
2.2.4
High-performance liquid chromatography (HPLC) analysis
HPLC analyses of nevirapine and its metabolites was conducted on an Agilent 1100 Series system (Agilent Technologies (Santa Clara, CA, USA)) using a reversed-phase Luna C18 (2) column (250 mm x 4.6 mm; 5 μm; Phenomenex, Torrance, CA, USA). The mobile phase—10% acetonitrile in 15 mM ammonium acetate buffer, pH 4—was delivered at a flow rate of 0.8 mL/min for 90 min; the flow rate was then increased to 1.5 mL/min over 5 min and maintained at this value for an additional period of 19 min. The column temperature was 40 ⁰C, the injection volume was 100 μL and UV absorbance was monitored at 254 nm.
The chromatographic peaks occurred at 34 min for 2-OH NVP, 52 min for 12-OH NVP, 69 min for 3-OH NVP, 85 min for 8-OH NVP and 109 min for NVP (Figure 2.2).
The lower limit of quantification of the method was 10 ng/mL for each analyte.
20
2.3
Fasting glycemia, insulin sensitivity and mean arterial pressure
assessment
2.3.1
Drugs and reagents
Insulin is commercially available as Humulin Regular® Lilly (Algés, Portugal) in a concentration of
100 UI/mL.
2.3.2
Measurement of insulin sensitivity
The insulin tolerance test (ITT) was used to measure insulin sensitivity. The ITT is one of the
earliest developed methods to assess insulin sensitivity in vivo and provides an estimate of overall insulin sensitivity, correlating well with the ‘gold standard’ hyperinsulinaemic–euglycaemic clamp (Monzillo and Hamdy, 2003; Conde et al., 2012). This method consists in the administration of an intravenous insulin bolus of 0.1 U/kg body weight after an overnight fast, followed by measuring the decline in plasma glucose concentration over 15 min at 1 min intervals. The constant rate for glucose disappearance (KITT) was calculated using the formula 0.693/t1/2. Glucose half-time (t1/2) was
calculated from the slope of the least square analysis of plasma glucose concentrations during the linear decay phase. Blood samples were collected by tail tipping and glucose levels were measured with a glucometer (Abbott Diabetes Care, Amadora, Portugal) and test strips (Abbott Diabetes Care, Amadora, Portugal).
2.3.3
Measurement of blood pressure
To measure mean arterial pressure (MAP), the femoral artery was cannulated under a dissection microscope and the catheter was connected to a pressure transducer (model 603; HSE-HA GmgH, Harvard Apparatus, Madrid, Spain) and pressure amplifier (Plugsys Housings, modelo 603, HSE-HA GmgH, Harvard Apparatus, Madrid, Spain). MAP data were acquired with HSE-Harvard PULMODYN W software (Harvard Apparatus, Madrid, Spain).
2.4
Antioxidant assessment in rat plasma and liver: the aminothiols.
2.4.1
Reagents
21 (Cys-Gly), glutathione (GSH) and N-acetylcysteine (NAC) as well the most of the reagents were purchased from Sigma-Aldrich Corporation (St. Louis, MO, USA).
2.4.2
Aminothiol measurement in plasma
The method for sample preparation was adapted from (Nolin et al., 2007). 2.4.2.1 Standard preparation
Stock solutions were prepared by solving each thiol in water. These solutions were used to prepare standard solutions in PBS in the following concentration range 5 – 800 μM for Cys, 0.625 – 100 μM for HCys, 1.25 – 200 μM for Cys-Gly, and 0.313 – 50 μM for GSH and NAC.
2.4.2.2 Sample preparation
Samples were prepared following three main steps: thiol reduction, protein precipitation and derivatization. In first step, 10 μL of Tris-(2-carboxyethyl)-phosphine hydrochloride (TCEP) 100 g/L were added to 100 μL of plasma sample, briefly vortex-mixed and incubated at room temperature for 30 min. Subsequently, trichloroacetic acid (TCA) 100 g/L with EDTA 1 mM was added, briefly vortex-mixed and centrifuged at 13000 g, for 10 min, at 4 ⁰C and the supernatant was collected. Afterward, the following solutions were added to 50 μL of supernatant: 10 μL of NaOH 1.55 M, 125 μL of borate buffer 0.125 M, pH 9.5 with EDTA 4 mM and 50 μL of ammonium-7-fluorobenzo-2-oxa-1,3-diazole-4-sulfonic acid (SBD-F) 1 g/L in borate buffer 0.125 M with EDTA 4 mM. Samples were briefly vortex-mixed and incubated for 1 h, at 60 ⁰C, in the dark. Finally, the samples were cooled on ice and protected from light until analyses.
2.4.2.3 High-performance liquid chromatography (HPLC) with fluorescence analysis.
22 Figure 2.3 - Representative chromatogram of aminothiols.
Cys - cysteine, HCys – homocysteine, Cys-Gly - cysteinyl-glycine, GSH – glutathione, NAC - N-acetylcysteine (NAC)
2.4.3
Aminothiol measurement in liver
The method for sample preparation was adapted from (Nolin et al., 2007). 2.4.3.1 Standard preparation
Standards of thiols were prepared accordingly the method described for plasma but with different concentration ranges: 1.25 – 200 μM for Cys, 0.16 – 25 μM for HCys, 0.31 – 50 μM for Cys-Gly, 5 – 800 μM for GSH and 0.0781 – 12.5 for NAC.
2.4.3.2 Sample preparation
For preparation of liver samples an additional step towards thiol extraction, prior to aminothiol reduction, was necessary. For that, 250 μL of liver homogenate sample (prepared as described in
2.2.3 Section) were centrifuged in an Amicon tube of 10 000 MWCO at 3800 g, for 20 min, at 4º C
before thiol reduction with TCEP 100 g/L.
2.4.3.3 High-performance liquid chromatography (HPLC) with fluorescence analysis.
The quantification of aminothiols in liver was performed by the same HPLC method conditions previously described in 2.4.2.3. Section.
CYS
[160 M]
HCYS
[10 M]
CYS-GLY
[40 M]
GSH
[10 M] NAC
23
2.5
Statistical data analysis
25
27
3.1 Effect of pre-diabetes on nevirapine disposition and biotransformation
The profile of NVP and its phase I metabolites 12-OH and 2-OH NVP, in plasma and liver, for C-NVP and IR-C-NVP is represented in Figure 3.1.
A decline in the plasma concentration of NVP and 12-OH NVP was observed in the IR-NVP group (Panel A). The same effect was found in the liver (Panel B). Although, the concentration differences
for 2-OH NVP were failed to be proved in both liver and plasma. In addition, the profile of metabolites has also changed. While 12-OH-NVP is the major metabolite in C-NVP group, this pattern is lost in IR-NVP animals.
In Figure 3.2 is represented the metabolite ratio NVP/12-OH NVP and NVP/2-OH NVP in C-NVP and in IR-NVP. In plasma only the NVP/2-OH NVP ratio was lower and in liver both ratios decreased in IR-NVP.
3.2 Effect of nevirapine on fasting glycemia, insulin resistance and blood
pressure in pre-diabetic rats
A control group of animals without treatment and without methylcellulose (CC) was included to explore the effects of MC on animals MAP, fasting glycemia and insulin sensitivity and no effects of MC were found.
Additionally MAP was similar across groups (Figure 3.3 Panel A). The IR-NVP group is not represented because due to a software crash the files were lost.
The influence of NVP on fasting glycemia and insulin sensitivity is represented in Figure 3.3Panel B and C respectively. In C-NVP, the drug did not modify significantly fasting glycemia. However, when
28 0 20 40 60 80
**
**
A
NVP 12-OH NVP 2-OH NVP
P
la
s
m
a
(
m
g
/L
.L
in
g
-1)
0 5 10 15***
***
B
NVP 12-OH NVP 2-OH NVP
Li
v
e
r (
m
g
/L
.L
in
g
-1)
Figure 3.1 - Nevirapine and its phase I metabolites in plasma (A) and liver (B).
29 0.0 0.5 1.0 1.5
A
NVP/12-OH NVP NVP/2-OH NVP
**
R
at
io
P la sm a 0.0 0.5 1.0 1.5 2.0***
B
NVP/12-OH NVP NVP/2-OH NVP
*
R
at
io
L iv erFigure 3.2 - Nevirapine/12-hydroxy nevirapine (NVP/12-OH NVP) and Nevirapine/ 2-hydroxy nevirapine (NVP/2 OH NVP) ratios in plasma (A) and liver (B).
30
C C-NVP IR
0 20 40 60 80 100 120
A
M A P ( m m H g )C C-NVP IR IR-NVP
0 20 40 60 80 100 120
**
B
G ly ce m ia (m g /d L )C C-NVP IR IR-NVP
0 1 2 3 4 5 6
C
KIT T (% glu c o s e/m in )Figure 3.3 - Effect of NVP intake in mean arterial pressure (A), basal glycemia (B) and insulin sensitivity (C).
( ) Control group (C) (n = 10); ( ) control group treated with NVP (C-NVP) (n = 4); ( ) insulin resistant group (IR) (n = 4); ( ) insulin resistant group with NVP (IR-NVP) (n = 6)
The vertical bars represent mean ± SEM. Comparisons presented reflect differences between IR and IR-NVP group: **P<0.01 (One-way ANOVA with Bonferroni multiple comparison test).
31
3.3 Effect of nevirapine on thiol system
The total aminothiol concentration (tHCys, tCys, tCys-Gly and tGSH) found in plasma of each group (C, C-NVP, IR, IR-NVP) is represented in Figure 3.4.
For total homocysteine only insulin resistant effect was considered significant with higher levels in IR animals. No effect of treatment was found. There were no differences in total cysteine across groups. About tGSH were not found difference too. tCys-Gly plasma levels were higher elevated in insulin resistance animals but NVP treatment decreased these levels.
Control IR 0 5 10 15
A
## tH C y sp la s m a ( M) Control IR 0 50 100 150 200 250B
tC y sp la s m a ( M) Control IR 0 1 2 3 4 ###C
*
tC y s -Gl yp la s m a ( M) Control IR 0 10 20 30 40 50D
*
tGS Hp la s m a ( M)Figure 3.4 - Plasma concentrations of Total Aminothiol
( ) Not treated (n = 6 per group); ( ) Treated (n = 6 per group). A – total homocysteine level (tHCys); B – total cysteine level (tCys); C – total cysteinyl-glycine level (tCys-Gly); D – total glutathione level (tGSH). Concentration of aminothiols (mean ± SEM) is expressed in μM. Data are statistically different between control and insulin resistant groups (C and IR) ##P<0.01, ###P<0.001(Two-way ANOVA with Bonferroni’s
32 For the liver, no significant differences across groups were found to tHCys, tCys and tCys-Gly (Figure 3.5 Panel A, B and C). For total glutathione only insulin resistant effect was considered
significant with higher lower in IR animals (Figure 3.5 Panel D).
Also, tNAC levels were detected on liver (data don’t shown). However it was not detected in all animals: four in control (C; C-NVP) and in insulin resistant not treated (IR), and two animals in insulin resistant NVP treated group (IR-NVP).While, pre-diabetes seems not have influence on these levels the effect of treatment reduced tNAC content (Annex 1).
Control IR 0.0 0.5 1.0 1.5 2.0 2.5
A
tH C y sli v e r ( M) Control IR 0 10 20 30 40B
tC y sli v e r ( M) Control IR 0.0 0.5 1.0 1.5 2.0C
tC y s -Gl yli v e r ( M) Control IR 0 200 400 600D
### tGS Hli v e r ( M)Figure 3.5 - Liver concentrations of Total Aminothiol
33
35 In the present work an influence of a pre-diabetic status on NVP PK was shown: NVP and its phase I metabolites 12-OH NVP and 2-OH NVP presented changes in their disposition and the metabolite profile pattern of NVP was changed. Moreover, NVP has no effect on fasting glycemia and insulin sensitivity in a non-diabetic context indicating that it can be a good option for pre-diabetes prevention, while in a pre-diabetic perspective is associated with a benefic effect on fasting glycemia. The drug has no effect on mean arterial pressure and insulin resistance. Moreover, nevirapine is associated with a lower degradation of total glutathione. So far, there are no similar studies reported in literature, being this data pivotal in this area.
The management of HIV-infection is gradually expanding to include the chronic complications associated with this infection and the undesirable effects associated with antiretroviral drugs. For the past 20 years, researchers and clinicians have reported changes in fasting glycemia and insulin sensitivity in this population. Although, most of the data generated focus on the first available antiretroviral as stavudine, didanosine, zidovudine or indinavir (Mulligan et al., 2000; Murata et al., 2000; Blumer et al., 2008; De Wit et al., 2008) that, due to its toxic profile, have been substituted for safer antiretroviral in first-line therapy. Moreover, most of these studies were conducted in advanced state diabetic patients, with scarce data on pre-diabetes.
For the management of HIV patients who develop diabetes, the added responsibilities can be overwhelming. The intersection among these two chronic diseases might compromise the treatment regimens required for both conditions. Thus, prudent choices for cART must be done for diabetic patients or those at higher risks to develop it.
In fact, antiretroviral represent a very dynamic group in terms of drug innovation, with different mechanisms of action and a considerable number of new drugs that became available in the last 20 years, increasing the possibility of perform a rational and personalized prescription. To give new insights on this context, the effects of co-pathologies in a particular antiretroviral pharmacokinetics and the consequent effects on its antiretroviral response as well as its toxic effects are worth to pursue.
36 In some HIV-infected patients who developed glucose disorder during treatment, the switch of the antiretroviral could implicate a reduction of therapeutic benefits and sometimes the better option prescribe an anti-diabetic drug with possibility of a drug-to-drug interactions to occur (Fichtenbaum and Gerber, 2002). However, some of the medications used to treat diabetes and the antiretroviral medication have similar metabolic pathways. Moreover, antiretroviral agents can influence the activity of the CYP P450 system as well as the activity other intervenient on drug metabolism (Xu et al., 2005). This is the case of NVP, a well-known CYP3A4 inducer (Pereira, 2012a). This interaction may change the efficacy and increase the risk of toxic effects of the both drugs.
On the other hand, the influence of glucose abnormalities and insulin resistance in pharmacokinetic and pharmacodynamic of several drugs has been consistently recognized (Dostalek et al., 2012). Although, on the regard of antiretroviral drugs scarce information exists. Antiretroviral are drugs with a narrow therapeutic range for each a variation in PK might produce an increased incidence of sub-therapeutic concentrations and the consequent virologic failure or increased plasma concentrations and higher risk of adverse effects (Liu et al., 2010).
The choice of the animal model and the related experimental conditions
In the light of the study of pre-diabetes condition influence on NVP PK, female Wistar rats on a sucrose diet were used as study model. Female rats were used due to sex-dependent dimorphic profile of the adverse reactions of NVP, with woman being at an increased risk (Ho et al., 1998; Bersoff-Matcha et al., 2001). Female sex has been shown to be a risk factor for clinically relevant adverse drug reactions (Anderson, 2005; Soldin et al., 2011) and a pharmacokinetic variation has been implicated as the main factor underlying the increased rate and wider range of drug-induced toxicity reactions in women (Miller, 2001; Anderson, 2008). Regarding NVP, a dissimilar phase I metabolite profile was found among men and women: a higher plasma level of the metabolites 12-OH and 3-OH NVP in female sex (Marinho et al., 2013). Moreover, females have higher CYP 3A4, 2A6 and 2B6 activities (Anderson, 2008; Scandlyn et al., 2008). These enzymes are involved in NVP phase I biotransformation. About phase II reactions, female mice showed higher hepatic mRNA levels of SULT1A1 (isoenzyme involved in the 12-OH NVP bioactivation) compared with male mice (Alnouti and Klaassen, 2006; Suzuki et al., 2012). On the other hand, women have lower UDP-glucuronosyltransferase activity which suggests that may be prone to less efficient detoxification of phase I metabolites than men (Anderson, 2008; Gallagher et al., 2010).
37 phase I metabolite profile is similar among rat and man with the proportion of metabolites being similar and 12-OH NVP being the major phase I metabolite (Riska et al, 1999b). Adaramoye et al. used 18 mg/kg body weight NVP dose (equivalent of human therapeutic dose, 400 mg of NVP are taken once a day) by oral gavage in a study on the toxicological effect of nevirapine on the liver, kidney and testis of male Wistar rat (Adaramoye et al., 2012). As, in other ongoing work of the team, the carcinogenic/mutagenic potential (Antunes et al., 2008) of NVP is being explored, to be surely able to measure NVP phase I metabolites and as a first pilot study with only 7 days of NVP exposition, a toxic dose of NVP 40 mg/kg/day was chose.
As NVP intake is by an oral administration (Boehringer Ingelheim Pharmaceuticals, 2013) and as it was intended to study PK variations, oral administration was selected as the administration route. However, the drug administration by gavage might induce stress in animals and since increased sympathetic activity is associated with the development and worsen of diabetes (Landsberg, 2006). Therefore this way of administration was avoided.
The drug dissolution is one of the main factors to determine its absorption (Mitchell et al., 2003). As methylcellulose (MC) enhances drug dissolution properties, NVP was solved in MC 0.5% w/v since it is practically insoluble in water (Mitchell et al., 2003; Srivastava et al., 2010). In the preliminary experiments, it was found that the volume of drinking water intake per day for each animal was equal to the one observed when NVP-MC was included in drinking water. Each rat drank approximately 30 mL of water per day. Thus, NVP was administered orally in drinking water of the animals.
38
Is there a change in NVP pharmacokinetics due to pre-diabetes?
The level of NVP was lower in both liver and plasma, suggesting that NVP is being less absorbed or highly biotransformated and eliminated. Moreover, the 12-OH NVP levels are lower in both liver and plasma, but 2-OH NVP levels do not vary.
Drug absorption is decreased in patients with diabetes (Zhu, 1993; Nowak et al., 1995; Jung et al., 2003; Wu et al., 2004). A plausible mechanism is an increased first past effect in diabetic condition. Little is known about the transporters that influence the disposition of NVP; however it was recently discovered a role for the multidrug resistance protein 7 (MRP7) and multidrug resistance type I (MDR1) encoded by the adenosine triphosphate-binding cassette gene ABCC10 and ABCB1, respectively, in the efflux transport of NVP (Ciccacci et al, 2010; Liptrott et al., 2012). While the effects of diabetes in these transporters are poorly characterized, its activity has not changed in hyperglycemic pregnant woman on insulin (Anger et al, 2012).
At first glance it would be said that the lower levels of 12-OH NVP in both liver and plasma were expected in pre-diabetes as NVP is being less bioavailable in these animals. However an interesting result was observed: the ratios NVP/2-OH and NVP/12-OH were inferior in liver of pre-diabetic rats, which revealed a higher biotransformation of NVP into its phase I metabolites. This higher biotransformation may explain the low disposition of NVP found in plasma and liver. Moreover, this effect was more pronounced for 2-OH NVP. While, different CYP isoenzymes are involved in 2-OH NVP (CYP3A) and 12-OH NVP formation (CYP2A6, 2D, 2C9 and 2C19), its functionality seems not be diminished in pre-diabetic animals treated with NVP. Moreover, NVP is a well know CYP inducer (Pereira 2012a) and this increased conversion into 12-OH NVP and 2-OH NVP suggests that this inductor effect is not lost in diabetes. The effect of diabetes in CYP is dependent on the particular CYP isoenzyme, disease status and the model used for the study (Kotlyar and Carson, 1999; Borbas et al., 2006, Dostalek et al, 2011; Brill et al, 2012).
The pre-diabetic rats showed an increased formation of 2-OH NVP (evaluated by the metabolite rate) and higher levels of this metabolite.
But, surprisingly, pre-diabetic rats showed an increased formation of 12-OH NVP and lower levels of this metabolite. As β-glucuronidase appears be increased in diabetes (Perdichizzi et al., 1983), a plausible explanation for reduced NVP absorption is that an increased first pass effect due to an efficient phase II reactions and drug excretion. Moreover, it might also explain while the 12-OH NVP formation is higher, while plasmatic levels are lower. The 2-OH NVP behaved different. Data on UGT enzymes involved in the biotransformation of each particular metabolite are scarce to establish the comparison.
39 as SULT expression experiments, phase II metabolites quantification, markers of hepatotoxicity (liver function tests) must be conducted.
Summing up, besides decreasing NVP absorption, pre-diabetic condition changes the metabolite pattern of NVP: the 2-OH NVP was the major metabolite formed instead of 12-OH NVP. This can have interesting implications on NVP toxicity, as 12-OH NVP has been described as the main player metabolite on NVP-associated toxic events (Caixas et al, 2012, Pereira et al, 2012). Moreover, while the lower NVP absorption, also decreases the risk of its toxicity (de Maat et al., 2003; Almond et al., 2004; Dailly et al., 2004; Kappelhoff et al., 2005; Hall and MacGregor, 2007; Stohr et al., 2008; Wyen et al., 2008; Dong et al., 2012; Ratanasuwan et al., 2012) this can have strong implications on drug efficacy. NVP is a drug with a narrow therapeutic window and a low genetic barrier (AIDS, 2012) and its sub-exposition might lead to resistance development and virological failure with serious therapeutic implications in these patients.
It is concluded that NVP PK is strongly influenced by HSu diet with plausible diminishing of its absorption and a different metabolite profile pattern. The finding of a decreased absorption can have significant impact on the NVP dose to be used in IR patients. Moreover on basis of the present data it is not possible to describe the fate of 12-OH NVP metabolite and the consequent implications on NVP toxicity. Also, further experiments should explore the increased formation of 2-OH NVP.
NVP and pre-diabetes: friend or foe?
Pre-diabetic animals treated with NVP showed no variation in arterial pressure, a benefic decrease in fasting glycemia and no influence in insulin sensitivity. Pre-diabetic patients have a proneness to present a superior mean blood pressure comparatively with healthy populations (Ryden et al., 2007). Also, long term cART use has been associated with an increase risk for heart disease (Dube et al., 2008; Gopal et al., 2009), but the regiments based on non-nucleoside reverse transcriptase inhibitors (NNRTI) seem to be more heart friendly (van Leth et al., 2004b; Parienti et al., 2007; Maggi et al., 2011). Moreover, several studies reported that NVP raises HDL levels, resulting in an improvement of the atherogenic index of patients (van der Valk et al., 2001; van Leth et al., 2004a). The drug has been associated to an HDL increase up to 49%, which represents a more pronounced effect than the obtained with the currently available HDL-raising drugs and is thought to be due to the stimulation of the apolipoprotein A-1 (Apo A-1) production (van Leth et al., 2004a; Sankatsing et al., 2007; Franssen et al., 2009). Moreover, it was recently indicated as a protective factor in pre-diabetes (Srivanich et al., 2010). On this regard NVP might be a good choice for patients with multiple cardiovascular risk factors as hypertension, dyslipidemia or diabetes.