in metropolitan areas: uncovering
micro-urban manufacturing
in the case of São Paulo, Brazil
Espaços de produção invisíveis em áreas metropolitanas:
revelando a micromanufatura urbana no caso de São Paulo, Brasil
Giselle Kristina Mendonça Abreu [I]
Abstract
Manufacturing in metropolitan areas has been drastically transformed. This case study of São Paulo, Brazil contributes new insights to debates about urban economies by shedding light on micro-urban manufacturing – an activity that, despite its pervasiveness, is usually left out of planning theory and discourses. First, I broadly frame this debate by retracing the relationship between economic activity and urban development in the historical making o f S ã o P a u l o . S e c o n d , I a n a l y z e m i c r o -manufacturing as a segment within the broader contex t of manufac turing, highlighting its relevance, ubiquit y, and resilience. Next, I examine micro-manufacturing activities by themselves and point out at their heterogeneity. Finally, I describe the emergence of two unique geographies of micro-urban manufacturing in the city.
Key words : urban economic development ; micro-urban manufacturing; urban planning; São Paulo.
Resumo
A manufatura em áreas metropolitanas tem sofri-do drásticas transformações. Por meio de um es-tudo de caso realizado em São Paulo, Brasil, este artigo fornece novos insights para debates sobre economias urbanas, lançando luz sobre a micro-manufatura urbana – uma atividade que, apesar de muito difundida, não costuma ser incluída na teoria e nos discursos de planejamento. Inicial-mente, delimito o debate de maneira ampla, re-constituindo a relação entre atividade econômica e desenvolvimento urbano no processo histórico de construção de São Paulo. Em seguida, anali-so o segmento de micromanufatura no contexto da manufatura como um todo, ressaltando sua relevância, ubiquidade e resiliência. Finalmente, examino as próprias atividades de micromanufa-tura, apontando sua heterogeneidade e a exis-tência de duas geografias, dependendo do setor de manufatura.
Introduction
When we think about metropolitan industrial spaces, our collective imaginaries quickly assemble a landscape of smokestack buildings, with extensive production floors and heavy machinery. Even though this might ring true for a few of the manufacturing sectors, the reality is that most of them have been drastically transformed. Manufacturing in contemporary cities is now far more knowledge-based and technologically-advanced, with leaner production areas, less pollution and noise, and more integration with other urban uses (Daniels and Bryson, 2002). Neoliberal and globalized capitalism have highly impacted manufacturing activities in cities and transformed the role of cities in global economies (Sassen, 2001). Structural change in the predominant mode of production accompanies technological advances: first, we witnessed the deindustrialization of large cities as manufacturing plants moved around the globe; second, a new flexible and more on-demand mode of production fragmented the production process into smaller units that are connected through networks of outsourcing (Scott, 1988).
This new landscape of manufacturing calls for a refreshed look into its activities and role in contemporary metropolitan areas. I contribute to the debate on urban economies by arguing that there’s a missing piece to the puzzle: micro-urban manufacturing. Micro-urban manufacturing has been largely invisible in both planning research and practice. The field of urban studies, particularly in Brazil,
has been dominated by narratives of global restructuring processes. These narratives highlight the process of deindustrialization, which large metropolitan areas face all over the world. Furthermore, metropolitan deindustrialization displaces large-scale factories to areas where the workforce and land are cheaper. In the U.S., for example, millions of jobs have moved to China. Scholars in São Paulo, however, focus on understanding the process of decentralization, where manufacturing moves from the metropolitan region to other cities upstate (Araújo, 2001). Therefore, as a provocation, I ask: how can we reframe our theories and thinking about the economy of cities and metropolitan areas by incorporating an understanding of small-scale economic activity?
The objective here is to develop a preliminary and exploratory examination of primary data on micro-urban manufacturing activities in the context of a metropolitan area in the Global South (São Paulo, Brazil), aiming at contributing new insights to liven up debates on urban economies. First, I broadly frame this debate by retracing the relationship between economic activity and urban development in the historical making of the City of São Paulo. Second, I analyze the specific segment of micro-urban manufacturing in the broader context of manufacturing, highlighting the relative relevance, ubiquity, and resilience of small production spaces in the city. Lastly, I examine micro-urban manufacturing by itself, pointing out the existence of two geographies (spatial distributions), depending on the manufacturing sector.
Definition
In this study, I adopt two different statistical definitions of micro-urban manufacturing, depending on the database. For economic ac tivit y dat a , I consid er micro - ur ban manufacturing a manufacturing business that has 1-20 employees, which is the definition used by Sebrae.1 When dealing with land use
data, I consider micro-urban manufacturing a lot with a built area of up to 500 m2, which is
the threshold defined by local zoning laws for manufacturing use to be allowed in most areas of the city (not only in industrial zones).
Additionally, I employ the qualifier urban to highlight that these activities are located within the urban fabric, in multiple neighborhoods – not just traditionally
industrial zones – and that production is oriented towards final consumers who live
in cities. Manufacturing solely refers to
industries of transformation, which do not include transportation, utilities services, or construction sectors.
Data
The three main data sources for this study are (1) land use data from the municipality of São Paulo; (2) data on formal businesses collected by the federal government of Brazil, and provided by the municipality;2 and (3) census
sample data, also organized and provided by the municipality.
The land use database is georeferenced and contains each lot registered with the municipality for tax purposes. The source of the original database is the Land and Building Registry (TPCL, the Portuguese acronym). Each lot contains, among other attributes, the built area and land use, which is categorized into general classes (e.g., residential, retail, and manufacturing). Reaching almost 18 million m2,
manufacturing land use accounts for 4% of the total built area of the city.
I was able to obtain data on the number of micro-manufacturing businesses, which are divided by sector, for each of the municipality’s 310 weighting areas.
Lastly, I use the most recent 2010 census data to track down the education level and commute time of workers from different manufacturing sectors. Working with sample data necessitated expanding the data to the total population through the use of the census weighting areas. It’s important to mention that census and RAIS databases use slightly different classifications of economic sectors. Therefore, some variation might occur due to the dataset used. To the extent possible, I have tried to standardize these categories.
Historical overview
of São Paulo’s economy
and urban development
3Historically, economic dynamics have always impacted the settlement patterns and spatial organization of cities. Seminal studies on the history of the City of São Paulo have pointed to this link, seeking in economic geography and history the baselines from which to explain São Paulo’s urban development (Monbeig, 2004; Prado Jr., 1998; Singer, 2004). I will briefly retrace this history to provide the necessary context for my empirical investigation, as well as a critical perspective on existing gaps.
The period that extends from the foundation of the town of São Paulo de Piratininga until the second half of the nineteenth-century is defined by a subsistence economy. With the gold cycle in Minas Gerais,
a neighboring state, the town gained more prominence as a commercial hub, due to its strategic location at the intersection of the tropeiros’ paths. During the last decades of the nineteenth-century, coffee production in the interior of the State of São Paulo expanded from 16% to 40% of the total national economic output. With the inauguration of a railway connection between São Paulo and Santos in 1868, São Paulo became an even more important link between the coffee farms and Santos’s port of export (Singer, 2004). The coffee cycle, extending until the 1920s, marks a critical period in the city’s history, which promotes a significant inflection in the urbanization process and creates the conditions for industrialization.
substitution and two world wars that paralyzed European industry and reduced the availability of imports.
Since the beginning of the twentieth-century, the fluvial plains of the city’s main rivers – Tietê, Tamanduateí, and Pinheiros – have been the preferred industrial sites. The triad formed by the railroad, flat and cheap land, and abundance of water provides the ideal conditions for the settlement of São Paulo’s industrial areas. Initially, factories settled along the Tamanduateí river, on the opposite bank to the historic city center. Later, they expanded towards other municipalities of the metropolitan region, and to the banks of Pinheiros river, forming the industrial districts of Jaguaré and Jurubatuba.
The 1950s onward brought a process of “heavy” industrialization, with the arrival of factories from more technologically-intensive industries that produced machinery and equipment. Industries of consumer goods were replaced by industries of capital goods
as the main drivers of the urban economy.4
This shift relates to the developmental policy promoted by Brazil’s National Administration under Juscelino Kubitschek (1956-1961). Industrialization was followed by intense migratory flows – rural workers looking for employment opportunities in the growing city – that led to a drastic expansion of the urban population during this period and charac terize d t he pro ce ss of t he “metropolitanization” of São Paulo.5
In general, there is a consensus in the literature about the economic history of São Paulo until the mid-1970s, how each of these previous moments can be understood and characterized, and how their role in
driving the urbanization process should be framed. However, after reaching the peak of its industrialization in the 1970s, there was a strong slowdown in the dynamics of manufacturing in São Paulo; here is where the literature diverges. The process that unfolded during the three decades has been interpreted in quite different ways.
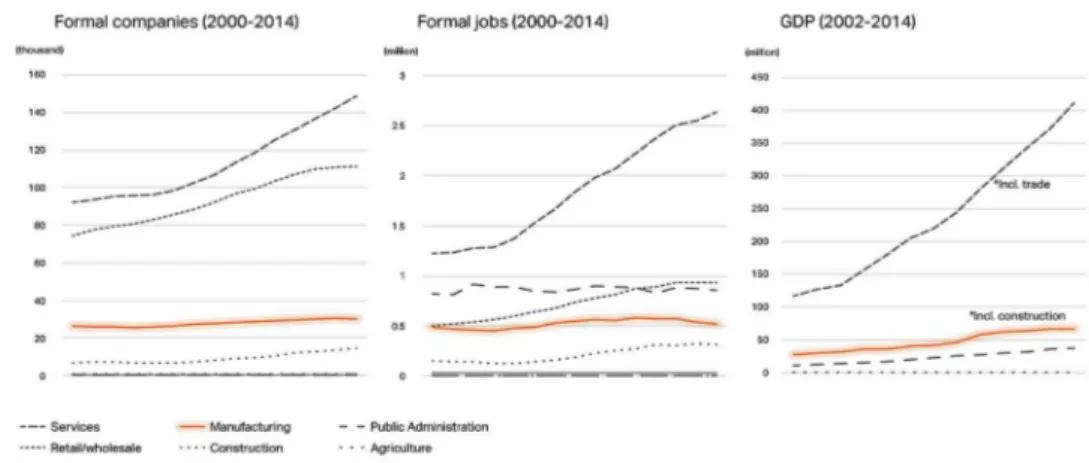
On the one hand, there are authors who interpret this dynamic of industrial decline as an irreversible transformation of the metropolitan economic base from secondary to tertiary, anchored in the process of deindustrialization (Biderman, 2004; Meyer, Grostein and Biderman, 2004). For Biderman, “the city increasingly presents a functional specialization of corporate headquarters, business services, and industries that serve the first two, rather than the [manufacturing] concentration that characterized it in the 1970s” (Biderman, 2004, p. 268, my translation). For the author, even the manufacturing businesses that remain in the metropolis are vitalized by the tertiary sector, which reinforces their centrality in the economy. This understanding is mainly based on an analysis of workforce data, which clearly shows a sharp decline in the share of manufacturing jobs in relation to total employment in the city, and a considerable increase in service sector jobs. Even if we only look at the period from 2000 to 2014, for which there’s easily accessible data on the number of formal businesses, jobs, and GDP by sector, this detachment of trends is clear, with the services sector abruptly rising (Figure 1).
Figure 1 – Economic trends: companies, jobs and GDP by sector – City of São Paulo, 2000-2014
Source: Companies and jobs – RAIS/MTE, 2000-2014; GDP – IBGE/Fundação Seade, 2000-2014. Preparation by: Mendonça Abreu, 2017.
as “deindustrialization” of the metropolitan economy. Looking at the national economic dynamics, Azzoni argues that the process is not about the decentralization of manufacturing throughout the entire national territory or even abroad, but instead it is about the continuation of manufacturing businesses close to the metropolitan region. In other words, even if manufacturing businesses are not inside the capital city anymore, they are still located in municipalities close by, within what is called the “macrometropolis of São Paulo” (Azzoni apud Torres, 2012). The author also points out that this process is related to the location of command-and-control business headquarters in the metropolitan area, further strengthening the City of São Paulo’s continued centrality within national industrial development.
In addition, Araújo (2001) argues that what happened in the metropolitan area
still a region that has its economic dynamism conceded by manufacturing, not by services” (Matteo, 2007, p. 4, my translation).
This brief overview of how the City of São Paulo’s economy has been interpreted, particularly with multiple considerations given to the role of manufacturing activity in the urban economy, only highlights how scholarly discussions about the city’s economy are still mostly restricted to large-scale processes and “big” numbers. Most of these studies are coming from a regional economy tradition in which data is usually aggregated for the whole of the municipality – the urban fabric is lost, and the heterogeneity of manufacturing activity is occluded in these analyses. There are rare studies that focus on understanding economic activities within the intra-urban scale, or that consider the diversity of manufacturing activities and the ways in which they are embedded within the city. It is precisely the recognition of this gap that motivates this paper. In what follows, my goal is to uncover a mostly invisible component of this larger equation: the sector of micro-urban manufacturing. My aim is to contribute insights that challenge common understandings of the role of manufacturing in the city’s economy.
Representation and significance
of micro-urban manufacturing
In this section, I argue that micro-urban manufacturing in São Paulo is a specifically relevant segment of economic activity since (1) it represents a significant part of the total industrial manufacturing sector, (2) it is
intrinsically and ubiquitously embedded in the urban fabric, and (3) it has demonstrated resilience in the face of economic crises.
Participation
Micro-urban manufacturing has been largely invisible to discourses of the urban economy. In fact, when you look at the participation of micro and small businesses6 in the Brazilian economy,
their role in the economic output of the manufacturing sector is lower than the share that micro and small businesses hold in retail or services. In manufacturing, micro and small businesses produce around 25% of the sector’s national GDP, while they account for 53% in retail and 36% in services (Sebrae, 2014). If you consider only micro businesses, the share is significantly lower: micro businesses account for only 9% of the manufacturing sector’s national GDP (Ibid.). However, their presence in the urban fabric and their participation in the economy is far from insignificant.
The distribution of land use in the City of São Paulo reveals that 50% of lots with manufacturing use are small production spaces, with a built area of less than 500 m2 (Table 1.1). When looking
Built area
# of lots with manufacturing
use
Participation %
Up to 500 m2 6.718 50,0
Between 500 and 2.500 m2 5.416 40,3
Between 2.500 and 10.000 m2 1.060 7,9
More than 10.000 m2 248 1,8
Total 13.442 100
Segment of manufacturing businesses by size
Formal businesses Formal jobs # Participation
% #
Participation %
Firms with 0-20 employees 35.112 81,4 182.181 20,1
Firms with 20-100 employees 6.327 14,7 256.958 28,3
Firms with 100-250 employees 1.021 2,4 158.060 17,4
Firms with 250-500 employees 462 1,1 111.081 12,2
Firms with more than 500 employees 199 0,4 199.479 22,0
1.1 – Lots with manufacturing use by built area – City of São Paulo, 2016
1.2 – Manufacturing firms and jobs – Metropolitan Region of São Paulo, 2016
Table 1 – Manufacturing lots, firms, and jobs – São Paulo, 2016
Source: TPCL/PMSP, 2016. Preparation by: Mendonça Abreu.
Source: RAIS/MTE, 2016. Preparation by: Mendonça Abreu.
of manufacturing employment in the city. These numbers are also consistent with the national average. Considering the entire country, micro-manufacturing businesses account for 79% of companies and 17% of manufacturing jobs (Ibid.).
These numbers reflect only formal businesses that report to the federal government. However, it is known that this segment is also highly informal, so one could extrapolate that the share of micro-manufacturing businesses and jobs is, in reality, even larger. The so-called “informal” economy is known for consisting of small firms, usually self-employed, that aren’t regulated by the formal regulatory environment (Castells and Portes, 1989; Tokman, 1992; Williams, 2014). Home-based industrial workers – mostly women – are also another relevant segment of the informal economy that falls outside of the reach of the database used here (Chen, 2014).
Ubiquity
Micro-urban manufacturing not only holds a significant share of the total number of manufacturing lots and businesses in the city, it also has a strong presence in the urban fabric. In contrast to large-scale manufacturing plants, which are mostly concentrated in specific parts of the city, micro businesses are everywhere, composing a pattern that is both dispersed and concentrated (Figure 2). There is a changing geography of industrial production in São Paulo. Several medium- and large-scale manufacturing plants – originally located along the main fluvial plains close to railway lines and expressways – have exited the city and moved to other municipalities around the state (Torres, 2012). At the same time, thousands of small production areas
proliferate throughout the urban fabric. The difference in the geographies inscribed in the territory by large- versus micro-manufacturing firms is striking (Figure 3).
This picture adds to the narrative of a new manufacturing landscape in large metropolitan areas that is primarily composed of decentralized networks of small specialized companies that are simultaneously spread out in neighborhoods and hidden from our imaginaries. Particularly in the case of São Paulo, these micro-manufacturing firms have been locating mostly in the eastern area of the city, a region historically characterized by a larger share of medium- and lower-income residents and lack of jobs. This influx of micro-manufacturing firms, therefore, helps change the geography of employment distribution (Rolnik and Frúgoli Jr., 2001).
Figure 2 – Urban lots with manufacturing land use – City of São Paulo, 2016
Source: TPCL/PMSP, 2016.
Another important observation is that the spatial distribution of micro-manufacturing lots and the zoning ordinances of the city don’t match. Less than 12% of micro-manufacturing lots are located within current industrial zones (Figure 4 and Table 2). This relationship is distinctly different when considering larger units. Around 40% of the lots with more than 10,000 m2 of built area of manufacturing use are located inside industrial zones. There are several reasons why large-scale manufacturing units tend to be more concentrated than micro-manufacturing ones in industrial zones. One reason is the availability of infrastructure and geographical conditions: for large manufacturing plants, it is far more important to be close to main transportation routes (both railway and roadway) to dispatch and receive
large quantities of material, and in areas with large flat lands. These are the places where manufacturing activity has historically settled in São Paulo. Additionally, the delimitation of industrial zones has generally reinforced these spaces as industrial districts since the first zoning ordinance of the city, known as “Noise Law”, in 1955 (for more on the São Paulo’s historical development of zoning ordinances and its relationship to economic activities, see Mendonça Abreu, 2017).
A n o t h e r ke y r e a s o n w h y l a r g e manufacturing firms tend to locate in industrial zones has to do with the restrictions imposed by zoning ordinances. On the one hand, large manufacturing plants tend to be more formalized than micro-firms – where there is a considerable amount of informality – and
Figure 3 – Heatmaps of large and micro manufacturing lots – City of São Paulo, 2016
Source: TPCL/PMSP, 2016.
Location
Lots with manufacturing use with 500 m2 of built area
Lots with manufacturing use with nore than 10.000 m2
of built area
Participation # Participation #
City of São Paulo (Total) 6.718 100,0 248 100,0 Within ZPI (Industrial Zone) or
ZDE (Economic Development Zone) 753 11,2 100 40,3
Table 2 – Manufacturing lots, firms and jobs – São Paulo, 2016
Source: TPCL/PMSP, 2016; Zoning: Municipal Law 16.402, 2016. Preparation by: Mendonça Abreu, 2017.
Figure 4 – Manufacturing lots with less than 500 m2 of built area
vs. industrial zoning – City of São Paulo, 2016
need to comply with local regulations that impose restrictions on where they can locate in the city. Due to levels of pollution, noise, and traffic generated by these larger units, they are not allowed to settle in most of the residential, commercial, or mixed use zones in the city. Therefore, industrial zones are the only spaces reserved for this activity. On the other hand, the land in industrial zones tends to be much cheaper than in the rest of city: limitations to the maximum FAR (Floor Area Ratio, or coeficiente de aproveitamento in Portuguese) renders this land less valuable to residential real estate development, keeping the land value lower and more accessible to large manufacturing plants.
In contrast, micro-manufacturing firms can be more flexible in terms of their locational decision. First, buildings with manufacturing use and less than 500 m2 of built area are
legally allowed by the current zoning law to be located anywhere in the city. This is mainly because the level of disturbance – traffic, noise, and pollution – caused to the surrounding areas is much lower than that caused by larger plants. Additionally, the current zoning law, which was recently reviewed through a participatory process, states that in an effort to halt the decentralization of job opportunities, several restrictions to the installation of economic activities in different parts of the city have been removed (PMSP, 2016).
S e c o n d , w i t h o n l y a h a n d f u l o f employees, it makes more sense for micro-manufacturing firms to locate closer to where their employees live and in particular closer to where the owner lives. A survey conducted by Sebrae-SP (2015) found that 64% of micro- and small-manufacturing firms in the State
of São Paulo involve the owner’s family in the business. Sebrae’s findings underscore why these firms would preferably locate in neighborhoods where the owners, and their families, live. Furthermore, as I describe in more detail in the following section, most of these small businesses sell their products directly to final consumers. Thus, it makes even more sense for them to locate within mixed-use zones that are closer to residential areas.
Resilience
T h e we ll - d o c u m e n t e d p r o c e s s of t h e deindustrialization of the City of São Paulo resulted in the displacement of several manufacturing firms from the metropolitan area. This process has been compounded by recent waves of economic crises, both global and national, that have affected multiple sectors of economic activity. Business closures and increasing unemployment rates have arisen as a result. It is interesting to note, however, that this process hasn’t been uniform throughout different segments of firm size. While the number of jobs and companies in the manufacturing sector has continued decreasing in most categories of company size since 1995 – and more abruptly since 2010 – micro-urban manufacturing, as a segment, has been steadily increasing in number of businesses and jobs.
with an approximately 10% increase in number of firms. All the other segments contracted in their number of businesses. Notably, the segment of larger manufacturing firms was the most affected. In this period, São Paulo lost about 260 manufacturing companies with 250–500 employees (a decrease of 36%) and around 100 companies with more than 500 employees (a decrease of 34%).
Trends regarding the variation in number of jobs, a critical indicator for economic development, reveal an even more interesting scenario: the segment of micro-manufacturing diverges from trends observed in other segments (Figure 6). There is a strong decrease in the number of jobs from 1995 to 1999, a consequence of the broader debt crisis within the context of economic and trade liberalization policies undertaken by the federal government
during this period. In the Metropolitan Region of São Paulo, unemployment increased from 8.7% to 19.3% during the 1990s. In the first decade of the 2000s, on the other hand, there was a strong recovery in the number of manufacturing jobs in the city – But, again, this didn’t happen consistently throughout different segments of firm size.
Larger firms didn’t reach the original number of employees they had in 1995. This decrease is inversely proportional to company size: manufacturing firms with more than 500 employees faced the largest contraction, losing more than 130,000 jobs between 1995 and 2016 (an impressive decrease of 39%); Firms with 250–500 employees lost around 64,000 jobs (again, a striking decrease of 36%); Firms with 100–250 employees lost 46,000 jobs (a decrease of 7.5%). Micro-manufacturing
Figure 5 – Trend of manufacturing companies by company size – Metropolitan Region of São Paulo, 1995-2016
Figure 6 – Trend of manufacturing jobs in formal manufacturing companies by company size – Metropolitan Region of São Paulo, 1995-2016
Source: RAIS/MTE, 1995-2016. Preparation by: Mendonça Abreu, 2017.
companies were the only exception. Contrary to these trends, their number of jobs increased by 10.7% between 1995 and 2016. However, the scale of this increase in absolute number of jobs wasn’t as significant, when compared to the number of jobs lost in medium- and large-scale firms. Only 17,600 jobs were added to the pool of manufacturing jobs in the city in micro-manufacturing firms – possibly some of them due to a process of formalization (i.e., micro-firms entering the formal market and registering previously informal workers).
Nevertheless, the segment of micro-urban manufacturing has been significantly resilient throughout the past 20 years. During the critical decade of the 1990s, the number of jobs offered by micro-manufacturing companies didn’t decrease at all. Furthermore, it grew steadily throughout the following years. In order to fully analyze this phenomenon, additional
Production chains
and geographies
of micro-urban manufacturing
In this section, I examine micro-urban manufacturing activity in São Paulo by dissecting its sector composition. My goal is to provide a more detailed understanding of the different types of small-scale production spaces in the city, in order to avoid generalizations and give concrete insights into the multifaceted segment of micro-urban manufacturing and the diversity of production chains in which it is embedded. First, I will present my findings regarding the breakdown of micro-manufacturing firms into sub-sectors, highlighting the clothing industry as a key sector for micro-manufacturing. Next, I will introduce and analyze two distinct forms of spatial organization, which I am call geographies, of small production spaces in the city: (1) a pattern of distribution that spreads throughout the city, and (2) a pattern where the units are dispersed only in certain parts of the city.
Production chains
The segment of manufacturing businesses with 1-20 employees is considerably diverse (Figure 7). Around 70% of the jobs are spread more or less evenly throughout multiple sectors: production of metal, chemical, and electrical products; food and beverages; printing; furniture; and so on. According to a recent survey of micro- (1-20 employees) and small- (20-100 employees) manufacturing
companies in the State of São Paulo, around 70% of the products of these companies are sold directly to final consumers (Sebrae-SP, 2015, p. 5). Examples of this type of product – that the consumer can buy directly from the producer – can range from biscuits, chocolate, and packaged juice manufactured through the use of small cooking equipment to furniture produced in workshops and metal components assembled in machine shops that one might need when building or renovating a house.
On the other hand, there’s still a significant portion of the production of micro-manufacturing firms that is sold to other links in larger production chains, and not to final consumers. These products are usually highly specialized, attending to a niche industry. A micro-manufacturing company in the chemical sector, for example, could provide laboratories and other businesses with special and custom-made chemical products, obtained through specific and highly- controlled processes of purification. Another example is a metalworking business that produces metal pipes and bushings that can be used by a different company that produces machinery and equipment – which, in turn, might also sell their product to larger manufacturing businesses to support their own production processes.
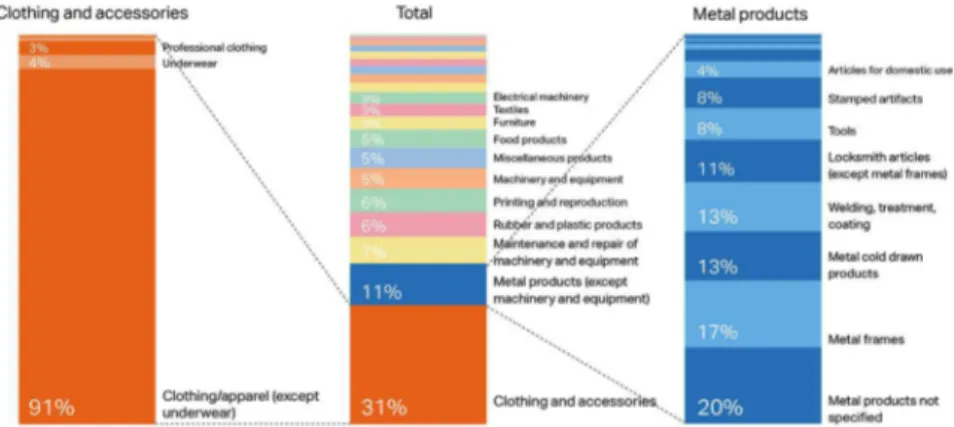
Figure 7 – Breakdown of manufacturing jobs in formal micro manufacturing companies* by sector – City of São Paulo, 2015
Source: RAIS/MTE, 2015.
Preparation by: Mendonça Abreu, 2017.
total number of jobs in micro-manufacturing companies. The clothing industry’s production chain is still considerably dynamic in the city of São Paulo, concentrating 86% of the metropolitan region’s total number of jobs in the sector, 52% of the state’s, and 14% of the country’s (SMDU, 2013). It is, therefore, an economic activity that highly benefits from being in denser urban areas more broadly, and also one that it is particularly connected to the city of São Paulo. This is mainly due to the availability of a diverse workforce, proximity to final consumers, and a closer connection to current fashion trends that dictate the demand for specific products.
Within the clothing industry, the production space is fragmented into smaller units, with outsourcing at multiple stages of production and a considerable amount of
Despite its significant share in the overall micro-urban manufacturing landscape, there’s also evidence that the number of jobs in the clothing industry have been drastically decreasing since 2010 (Figure 8). On the other hand, different sectors that didn’t previously figure so prominently have been rising in importance and number of jobs, such as in food and beverage and mechanical manufacturing companies. One possible explanation for this is that the clothing industry might have been more affected by the economic slowdown that has taken place since 2010, following the global economic crisis that erupted in 2008. Other sectors, such as food and beverage, might have been less affected – after all, people are more likely to cut clothing rather than meal costs. However, these are only conjectures that need detailed examination.
Geographies
When we look at the spatial distribution and concentration of micro-urban manufacturing companies by sub-sectors, we find that there are variegated geographies to this segment of economic activity. This means that the inscription of micro-urban manufacturing companies on the territory can’t be understood uniformly. There are significant variations that point to different relationships between small and large manufacturers according to economic sectors, or between micro-manufacturing units and their final consumers. The latter depends on the neighborhoods in which these units are concentrated. Briefly, there are two main geographies that stand out: (1) sectors that are be present in most of the city’s neighborhoods; and, (2) sectors that appear more concentrated
Figure 8 – Trend of manufacturing jobs in formal micro manufacturing companies by sector – Metropolitan Region of São Paulo, 1995-2016
in areas of medium- (not necessarily low-) income or closer to industrial zones.
In the first geography identified, which includes economic sectors such as clothing, food and beverage, and paper and graphics, micro-manufacturing companies are located in most of the neighborhoods within what is commonly known as the “expanded center” of São Paulo (Figure 9.1). However, there is a notable exception: these sectors don’t appear in more distant peripheral urban areas, such as the
extreme eastern and southwestern ends of the city, where a highly concentrated low-income population resides with no job opportunities (Figures 10.1 and 10.2). Even though micro-manufacturing units in these sectors appear to contribute to the rebalancing of uneven geographies of employment opportunities, which are highly concentrated in a vector extending from the city center to the southwestern neighborhoods, they do not reach areas that are in most need of investment and jobs.
Figure 9 – Concentration of formal micro manufacturing companies by sector – City of São Paulo, 2015
Source: RAIS/MTE, 2015.
Figure 10 – Distribution of income, employment opportunities and industrial zones – City of São Paulo
Source: Censo/IBGE, 2010; RAIS/MTE, 2014; Municipal Law 16.402, 2016.
Interesting particularities also arise when looking at individual sectors, such as the large concentration of clothing companies in the city center – in the neighborhoods of Brás, Bom Retiro, and Mooca, where this industry has traditionally existed for many decades. Yet, still, this hasn’t prevented micro-manufacturing units in the clothing industry from simultaneously spreading to different territories and composing a spatial pattern that is, at the same time, intensely concentrated and dispersed. It also comes as a surprise that the clothing industry is the only one that has micro-manufacturing companies located in more distant eastern neighborhoods. This might be due to the fact that, compared to other sectors, the clothing industry demands little infrastructure and investment to start a production. With a simple sewing machine,
one can easily start a small business in the clothing industry. Producing food, beverages, and graphic materials, by contrast, requires specialized equipment and more investment, both in terms of machinery and expertise.
to imagine the entire final product being developed within one small production unit and being sold directly to consumers or to intermediary retailers; in effect, serving a more local network of buyers. A micro-manufacturing business in the clothing sector might be able to produce and sell an entire piece of apparel, while another in the food and beverage sector could produce and package different kinds of prepared foods and drinks and sell them directly to final consumers.
The sector that doesn’t fit so neatly into this narrative is the paper and graphics sector, which primarily serves other industries by selling packaging material and graphic paper. This leads to an alternative, or perhaps complementary, hypothesis: sectors that appear more evenly distributed share the characteristic of producing less noise and pollution when compared to sectors such as metalworking and the chemical industry. This could explain why they are more broadly accepted in different neighborhoods where commercial and residential uses coexist. More research is needed to carefully investigate each of these hypotheses. But, if they are correct, I suggest the prioritization of these sectors in policies geared towards creating more diverse and mixed-use urban spaces.
The second geography reveals a pattern of spatial distribution that is significantly less ubiquitous than the first (Figure 9.2). The main sectors that can be classified within this second type of geography are metalworking, chemical, and mechanical industries. Their distribution patterns show striking similarities in the dispersion of micro-manufacturing units along the Tietê and Tamanduateí rivers; sprawling over the eastern region of the city; and some
concentrated hotspots along the initial stretch of Pinheiros river to the south. What these spaces have in common is that they mostly overlap with traditionally industrial areas along the main rivers and railway lines that emerged during initial waves of industrialization in the city. Additionally, they are mostly in medium-income neighborhoods. While they do not touch high-income areas, some cross into lower-income neighborhoods.
The fact that this set of manufacturing sectors is not as widely dispersed in the urban fabric influences average commute times of workers. Even though the census data includes all people who are identified as workers in these sectors – and not specifically in micro-manufacturing firms – the distribution of travel time from residence to workplace shows that these workers usually take longer to get to work than those who work in the sectors that present a more dispersed distribution in the city. Around 40% of workers in the clothing, food and beverage, and paper and graphics sectors take less than 30 minutes to get to work – a relatively short amount of time, considering the average commute time in São Paulo of 43 minutes, according to a report from IPEA.7 In contrast, around 30% of workers in
the metalworking, chemical, and mechanical sectors spend less than 30 minutes for their commute. The difference is particularly relevant when we look at the mechanical sector: about 50% of the workers in this sub-sector have a commute from home to workplace of more than 1 hour.
industries, micro-urban manufacturing firms tend to produce more noise and pollution. Consequently, they are less accepted in residential and wealthier neighborhoods. Moreover, I speculate that the reason they are more intensely concentrated in traditionally in d u s t r ial a r e as is t hat t h e s e mic r o -manufacturing firms might depend on a direct connection to larger manufacturing units.
This, in turn, raises a relevant policy implication: if we can differentiate between micro-manufacturing businesses that depend on proximity to larger units – either for obtaining raw materials or providing offerings to other industries as a supplier – from those that do well by themselves – either because they don’t rely on this proximity on a daily basis or because they only need the direct connection to final consumers – then we can also develop more appropriate industrial and economic development policies for the city. If we identify a sector where micro production units depend on larger manufacturing firms, then policies aimed at maintaining or stimulating the small firm must also promote the adjacent large one.
From a theoretical perspective, these findings add nuance to theories of urban economies. In the 1970s, Milton Santos proposed the theory of two circuits to explain the structure of urban economies in developing countries. This still very influential theory described an “upper” circuit that used capital intensively and was technologically modernized, as well as a “lower” circuit of small scale, labor-intensive activities (Santos, 1978). These two distinct circuits, nevertheless, operated through reciprocal relations. In some ways, my findings on micro-urban manufacturing activities reinforce
Santos’s theory. The micro-scale of these activities enables them to spread throughout urban space and become entrenched in diverse neighborhoods. They have a very different geographical presence than large--scale manufacturing firms, which are more concentrated in industrial zones. Furthermore, micro-manufacturing firms are usually closer to final consumers and offer a large range of products in the local market, similar to the role played by the “lower” circuit, as described by Santos, in urban economies.
[I] https://orcid.org/ 0000-0001-8414-0921
University of California/Berkeley, Department of City and Regional Planning. Berkeley, Estados Unidos da América.
giselle@berkeley.edu
or “upper” circuit anymore. These general processes, as well as my specific findings on micro-urban manufacturing, disrupt the dichotomy proposed by the theory of two circuits and point to the changing role of small production spaces in metropolitan areas.
Conclusion
My goal for this study was to uncover an element that is usually left out of larger narratives about manufacturing and cities: the scale of micro-urban manufacturing activities. Through a case study of São Paulo, I retraced the historical underpinnings of the relationship between space and economy in the city and highlighted key debates about the role of manufacturing in São Paulo; unearthed the role of micro-production firms and jobs in the overall manufacturing sector; and explored the heterogeneous sectors and geographies of micro-manufacturing.
First, there is an extensive and pervasive network of significantly small manufacturing units spread throughout the city, accounting for 80% of manufacturing firms and 20% of the sector’s jobs. Its relevance to the metropolitan area is expanding as it steadily grows in number of jobs and firms, despite economic crises and the departure of larger
units from the city. Second, micro-urban manufacturing is highly diversified in terms of sectors, as it extends to food and beverage, paper and graphics, chemical, metal works, and mechanical sectors. The clothing industry, however, is a main source of jobs, accounting for 30% of the total. Furthermore, these sectors form two distinct geographies: one that is more evenly dispersed and another that remains connected to traditional industrial areas, as well as to the eastern region of the city.
Notas
The manuscript was entirely revised by Yanin Kramsky (University of California, Berkeley). (1) Sebrae is a Brazilian social institution aimed at fostering the development of micro and small
enterprises.
(2) I particularly want to thank Akinori Kawata, from the Division of Information Production and Analysis at the City of São Paulo’s Department of Urban Development, who generously helped me by providing data for this project.
(3) This section draws largely from the review developed in Mendonça Abreu, 2017.
(4) According to Singer, “In general terms, the participation of the five most important sectors that produce consumer goods fell from 47.3% in 1949 to 34.9% in 1959, while the share of the six most important sectors that produce capital goods rose from 34.9% in 1949 to 42.7% in 1959” (SINGER, 2004, p. 194, my translation).
(5) Between 1940 and 1950, the City of São Paulo’s population grew at a 5.18% annual rate, and 5.70% from 1950 to 1960. During the following two decades, the annual population growth rate decreased, even though it was still high: The population grew at a 4.57% annual rate throughout the 1960s and 3.69% in the 1970s. It was only from the 1980s onward that the population growth drastically slowed down: Between 1980 and 1991, the average annual growth rate was 1.04%; in the 1990s it was 0.87%; and, finally, from 2000 to 2010, it reached an average of 0.79%.
(6) Here, I am referring to a segment that includes micro (1–20 employees in manufacturing and
1–10 employees in retail or services) and small (20-100 employees in manufacturing and 10-50
employees in retail or services) businesses, since most of the secondary data available looks at both of these scales of businesses together. The definition, as well as the data, is from Sebrae. (7) IPEA is the Institute of Applied Economic Research, a public institution that develops studies and
researches to support the federal government in policy-making.
REFERENCES
ARAÚJO, M. (2001). Reestruturação produtiva e transformações econômicas: Região Metropolitana de
São Paulo. São Paulo em Perspectiva. São Paulo, v. 15, n. 1, pp. 20-30.
BIDERMAN, C. (2004). “A expansão do setor terciário”. In: SZMRECSÁNYI, T. (org.). História econômica
da cidade de São Paulo. São Paulo, Editora Globo.
CASTELLS, M. e PORTES, A. (1989). “World Underneath: the origins, dynamics and effects of the informal
economy”. In: PORTES, A.; CASTELLS, M. and BENTON, L. A. (eds.), The informal economy: studies
in advanced and lessa developing countries. Baltimore, Johns Hopkins University Press.
CHEN, M. (2014). Informal Economy Monitoring Study Sector Report: Home-Based Workers. Cambridge:
DANIELS, P. W. and BRYSON, J. R. (2002). Manufacturing services and servicing manufacturing:
knowledge--based cities and changing forms of production. Urban Studies, v. 39, n. 5-6, pp. 997–991.
MATTEO, M. (2007). Além da metrópole terciária. Tese de Doutorado. Campinas, Universidade
Estadual de Campinas.
MENDONÇA ABREU, G. K. (2017). Planejamento urbano e atividades econômicas: balanço das experiências
na cidade de São Paulo. Dissertação de Mestrado. São Paulo, Universidade de São Paulo.
MEYER, R. M. P.; GROSTEIN, M. D. and BIDERMAN, C. (2004). São Paulo metrópole. São Paulo, Edusp/
Imprensa Oficial.
MONBEIG, P. (2004). “O crescimento da cidade de São Paulo”. In: SZMRECSÁNYI, T. (org.). História
econômica da cidade de São Paulo. São Paulo, Editora Globo.
PMSP – PREFEITURA DO MUNICÍPIO DE SÃO PAULO (2016). Parcelamento, Uso e Ocupação do Solo –
Lei n° 16.402, de 22 de março de 2016; zoneamento ilustrado. São Paulo, PMSP.
PRADO JR., C. (1998). A cidade de São Paulo: geografia e história. São Paulo, Brasiliense.
ROLNIK, R. and FRÚGOLI JR., H. (2001). Reestruturação urbana da metrópole paulistana: a Zona Leste
como território de rupturas e permanências. Cadernos Metrópole. São Paulo, n. 6, pp. 43–66.
ROY, A. and ALSAYYAD, N. (eds.). (2004) Urban Informality: Transnational Perspectives from the Middle
East, Latin American, and South Asia. Oxford, Lexington Books.
SANTOS, M. (1978). O espaço dividido: os dois circuitos da economia urbana dos países subdesenvolvidos.
Rio de Janeiro, Francisco Alves.
SASSEN, S. (2001). The Global City: New York, London, Tokyo. Princeton, Princeton University Press.
SCOTT, A. (1988) Flexible Production Systems and Regional Development: The Rise of New Industrial
Spaces in North America and Western Europe. International Journal of Urban and Regional
Research, v. 12, n. 2, pp. 171–186.
SEBRAE (2014). Participação das micro e pequenas empresas na economia brasileira. Disponível
em: http://www.sebrae.com.br/Sebrae/Portal%20Sebrae/Estudos%20e%20Pesquisas/ Participacao%20das%20micro%20e%20pequenas%20empresas.pdf. Acesso em: 10 dez 2017.
SEBRAE-SP (2015). A micro e pequena indústria paulista. Disponível em: http://www.sebrae.com.br/
Sebrae/Portal%20Sebrae/UFs/SP/ Anexos/a_micro_e_pequena_industria_paulista.pdf. Acesso em: 10 dez 2017.
SILVA, C. F. da (2008). Trabalho informal e redes de subcontratação: dinâmicas urbanas da indústria
de confecções em São Paulo. Dissertação de Mestrado. São Paulo, Universidade de São Paulo. SINGER, P. (2004). “São Paulo: os últimos 40 dos 450 anos de São Paulo”. In: SZMRECSÁNYI, T. (org.).
História econômica da cidade de São Paulo. São Paulo, Editora Globo.
SMDU – SECRETARIA MUNICIPAL DE DESENVOLVIMENTO URBANO, PREFEITURA DO MUNICÍPIO DE
SÃO PAULO (2013). Indústria da confecção mantêm força em São Paulo e concentra 14% dos
Texto recebido em 4/jun/2018 Texto aprovado em 7/ago/2018
TOKMAN, V. (1992). “The Informal Sector in Latin America: From Underground to Legality”. In:
TOKMAN, V. (ed.) Beyond Regulation: The Informal Economy in Latin America. Boulder, Lynne
Rienner.
TORRES, H. (2012). Afinal, a desconcentração produtiva é ou não relevante? A cidade de São Paulo no
olho do furacão. Novos Estudos – CEBRAP. São Paulo, n. 94, pp. 69-88.
WILLIAMS, C. (2014). “Informal Economies”. In: PADDISON, R. and HUTTON, T. (eds.) Cities and