Consequences of investment contract duration on the
valuation of firms in maturity stage
Madalena Delgado
Instituto Superior de Estudos Interculturais e Transdisciplinares, PIAGET, Campus Universitário de Almada,
Quinta da Arreinela de Cima, 2800-305 Almada, Portugal Email: [email protected]
Renato Pereira*
Universidade Autónoma de Lisboa,
Rua de Santa Marta, 47 – 3º, 1150-293 Lisboa, Portugal and ISCTE-IUL, Lisboa, Portugal Email: [email protected] *Corresponding author
Álvaro Dias
Instituto Superior de Gestão,
Rua Vitorino Nemésio, 5, 1750-306 Lisboa, Portugal Email: [email protected]
Email: [email protected]
Abstract: Investment contract duration is a key parameter for venture capital
funds operation. Variables influencing the decision around this parameter are usually treated in general principles in the classical financial literature leaving plenty of room for context sensitive research. As such, we studied variables influencing investment contract duration by investigating the performance of mature Portuguese firms that have been (partially) held by venture capital funds. Using a sample of 38 firms, sold out by venture capital funds between 1995 and 2004 we evaluated the performance of these firms using performance and sustainability indicators. We found evidence that sales growth, exports, book value, headcount and a good coverage of ISO standards implementation influenced the investment contract duration.
Keywords: investment contract duration; venture capital; divestiture; maturity. Reference to this paper should be made as follows: Delgado, M., Pereira, R.
and Dias, Á. (2015) ‘Consequences of investment contract duration on the valuation of firms in maturity stage’, World Review of Entrepreneurship,
Management and Sustainable Development, Vol. 11, Nos. 2/3, pp.217–231.
Biographical notes: Madalena Delgado received her PhD in Economics from
the Universidade Autónoma de Lisboa, Portugal (2011). She is an Assistant Professor of Management and Financial Analysis at ISEIT – Instituto Piaget
(2013–); previously, she was an International Management Consultant (2007–2012) and CFO of Media and Pharmaceutical Multinational Companies (1990–2007). Her main research areas of interest are: venture capital, firm valuation and sustainable performance.
Renato Pereira received his PhD in Management Science from the Université Paris Dauphine, France (2003). He is an Associate Professor of Management at UAL-Universidade Autónoma de Lisboa, Portugal and a Guest Professor of Management at ISCTE-IUL, Portugal. He is also Visiting Professor in African and Brazilian universities. His main research areas of interest are: entrepreneurship, strategic management and business planning.
Álvaro Dias received his PhD in Marketing from the University of Extremadura, Spain (2006). He is a BA Coordinator and Full Professor of Marketing and Strategy at ISG-Instituto Superior de Gestão, Portugal (2012-); he previously held positions of BA and PhD Coordinator at UAL-Universidade Autónoma de Lisboa, Portugal (2007–2012). He is also Guest Professor in European, African and Brazilian universities. His main research areas of interest are: marketing; dynamic capabilities, entrepreneurship, behavioural strategy and knowledge management.
This paper is a revised and expanded version of a paper entitled ‘Entrepreneurship, venture capital, and the valuation of firms in maturity stage’ presented at the 6th Annual Conference of the EuroMed Academy of Business, Estoril, 23–24 September 2013.
1 Introduction
This paper examines the impact of venture capital as a value added partner to Portuguese firms in maturity stage, especially in traditional business activities and test if whether or not this is an enduring impact, assessed by valuation increase of these firms after four years of an exit.
We chose this type of firms – companies in maturity – for two main reasons:
1 in Portugal and in the time-frame 1995–2004, mature firms from traditional business activities tended to use venture capital to achieve growth and go international 2 there is a lack of research relating venture capital with this stage in the lifecycle of
companies, however there is a variety of works revealing the positive impact of venture capital in entrepreneurship through firm performance in early stages of development.
To complement our analysis, we developed two surveys. Survey 1 was applied to managers of venture capital companies, managing one or more funds (VCs) to assess their perception on the result of the activities carried out with portfolio companies during the investment period. Response rate for survey 1 was expressive (66.7%). Survey 2 was sent to portfolio companies’ managers but the rate of response was not representative and the data thus collected was not used to test variables.
2 Theory and hypothesis
Prior studies have made progress in documenting positive effects of VCs on their portfolio companies. Rosenstein (1988) highlights the benefits of VC experience and its network resources to portfolio companies. Gorman and Sahlman (1989) is a seminal work in the study of the (positive) effects of VCs on their portfolio companies. It sustains that VC managers supply effective support to their portfolio companies in the following areas by order of importance: additional fund raising, review and support on strategy formulation, management team’s recruiting and training, operational planning and establishing contact with potential customers, suppliers and money lenders.
Busenitz et al. (2004) concluded that venture capital provides a feed back of constructive strategy in the decision-making process leading to portfolio companies’ better performance.
2.1 Factors influencing performance
Our survey shows that VCs’ managers believe the most important portfolio companies’ post-exit performance factors to be, by order of importance: top management quality; confidence; experience; VC contact network; internationalisation strategy; governance model; VC reputation; communication; management model; contract duration; exit option; innovation investment; technology investment; marketing and strategy support. These factors were already tested in previous literature as contributing to assess a positive impact of VCs on their portfolio companies.
• Top management quality – Cornelius (2005) observed changes in the North-American industry over the 15 years prior to the study. He concluded that present VC managers come mostly from the financial industry and hold MBA or equivalent degrees. These managers are more risk-averse than their predecessors and manage a growing number of portfolio companies given the increase in the average size of investment vehicles. White et al. (2007) took the portfolio companies’ manager to support the association between a certain types of leadership for different growing phases of the company allowing them to rise up alert signs by phase of development. • Confidence – Shepherd and Zacharakis (2001b) showed that are optimum control
levels allowing for trust development and refer to the choice of the control model. Duffner et al. (2009) found out a significant and reciprocal relation between trust and success.
• VC managers’ previous experience – Bottazzi et al. (2008) concluded that VCs’ managers with previous experience in the business are more active in recruiting managers and directors, helping in fund raising and interacting with portfolio companies. Zarutskie (2010) also find that VC funds whose management teams possess more prior work experience in management and strategy consulting, non-venture finance and professional science and engineering experience achieve better portfolio company exits.
• Network of contacts – VCs’ network made available to portfolio companies is of utmost importance in company’s development, not only for purposes of capital return but also for purposes of management. For Shepherd and Zacharakis (2001a),
venture capital is like an information tag about the capabilities of entrepreneurs’ management team and evidence of trust in past relations with investors.
• Internationalisation strategy – Maula et al. (2005) added that VCs are important to help portfolio companies getting new foreigner customers. Makëlä and Maula (2006) suggested that international VCs have a positive impact in which could be valuable to the company in terms of new venture’s legitimacy in an unknown market. For Manigart et al. (2006), entrepreneurs willing to go international could take advantage of VCs’ human capital in terms of international experience. Lipuma (2007)
mentioned that the odds of a VC backed venture getting more than 10% of its revenue from abroad are almost 60% better than a non-VC backed venture. • Reputation – Hsu (2004) concluded that entrepreneurs are prepared to accept a
discount on their start-up’s valuation if it makes possible to get VC investment with better reputation while Masulis et al. (2007) showed that VCs’ portfolio companies have better performance after initial public offerings (IPOs) due to VC reputation. • Communication – Gorman and Sahlman (1989) studied this variable as an
influencing factor in portfolio companies’ performance and concluded that most managers spend more than half of their time monitoring their portfolio companies and the balance to decide on new investments and administration. Jääskeläinen et al. (2006) took a different approach on the attention given to portfolio companies relative to VC performance thus establishing a relation between investor’s activities and VC performance.
• Professional management models – Hellmann and Puri (2002) concluded that VCs are responsible for portfolio companies’ upgrade in terms of management capabilities at the level of human resources, marketing and possibly general management mainly through the appointment of a new CEO. It was also concluded that VC officers play a much wider role than the traditional function of financial intermediation.
• Funding duration – Sahlman (1990) considers that duration contract is an influencing factor for portfolio companies’ success because VC investments are typically long terms’. Further, Gompers (1994) refers that a large number of projects take decades to return benefits and if funding suppliers do not have the same length orientation potential portfolio companies loose access to money.
• Exit option – Niosi (2003) concluded that VCs look forward to close IPOs for their portfolio companies which is the best case scenario for both VC and portfolio companies in terms of valuation.
• Investment in innovation and technology – Venture capital is recognised to have an impact on portfolio companies’ strategy working as an influential factor on value added. In the US there is strong evidence that VCs’ portfolio companies produce ever more valuable patents (Kortum and Lerner, 2000) innovating more frequently and achieve a higher professional level earlier (Hellmann and Puri, 2000, 2002) than non-VC backed companies.
• Expertise, strategy and marketing – Hellmann and Puri (2002) studied the effect of this factor supplied by VCs by measuring the time to market of portfolio companies and concluded that venture capital has a strong association with products
successfully reaching the market. Venture capital actually increases this probability in 79%. This proves that VCs play a fundamental role in portfolio companies’ marketing performance.
2.2 Relative or comparative valuation
Damodaran (2012) sustains that despite the importance and discussion around the discounted cash flow method or net present value (NPV), reality shows that most asset valuations are made by the relative valuation method, i.e., asset pricing is made based on the market transactional price for similar assets. From the three ratios more used in relative valuation, price earnings ratio, price book value (PBV) and price sales ratio (PSR) we selected two: PBV and PSR.
PBV reflects the relation between company price and accounting valuation. There are advantages in using these multiple-based methods because it is a relatively stable and intuitive measure of value that could be compared with market price and get a reasonable consistency from accounting standards allowing for comparison between similar companies, looking to abnormal valuations or undervaluation and making valuation of companies with negative profitability (Damodaran, 2012).
Multiple revenue method or PSR has received increasing attention from financial analysts resulting from its advantage over other ratios: Revenue figure is easy to attain even for companies with negative profitability and it is not significantly affected by accounting policies like depreciation, inventory and extraordinary events. PSR is an interesting tool to examine the consequences of pricing policy changes and other corporate strategic decisions and also it makes much easier to compare companies from different markets and different accounting standards (Damodaran, 2012).
2.3 Sustained performance
Freeman’s (1984) stakeholder theory is at the center of this debate trying to balance the best interests of all stakeholders. However, it acknowledges that companies must remain competitive; combining good financial performance with employee and customer satisfaction, with usefulness to society and with solid ethical principles is an accomplished company. The idea that increasing shareholders’ value is the main purpose of a company has been increasingly criticised since corporate social responsibility and the best interests of tax payers became a major societal concern. Focusing on shareholders’ value does not only help decision-making for social issues such as employment and business ethics but also it could destroy companies’ long term value thus diminishing shareholders’ value. Companies today understand the importance of taking into account stakeholders’ interests: suppliers, employees, community, customers, consumers, society and environment. According to Waddock and Graves (1997) corporate social irresponsibility leads to negative financial consequences. Berman et al. (1999) investigate, in a very specific form, the relationship between financial performance and social issues and conclude that there is a positive relationship between adequate management of human capital and customers’ relationship and financial performance. According to Epstein and Roy (2001), there is a growing number of top managers acknowledging the relevance of formulating a strategy of corporate social responsibility. Nevertheless they believe is very difficult to put it into action. These authors mention structures like the balanced scorecard, ISO 14001 and environmental management
systems (EMS) as patterns of such a strategy. Marom (2006) believes that the complexity of the field and the existence of contradictory results call for a unified theory of the relation between social performance and financial performance. This author promptly rejects any pretension of finding a universal relation between these two types of performance. Nelling and Webb (2009) mentioned several surveys of statistical significance and non-significance between the two variables to sustain neutrality in the relation. Either way, these authors reject the hypothesis of social responsibility being a competitive disadvantage, meaning that it does not make any sense stating that social programmes diminish financial performance, negatively affecting shareholders.
2.4 Hypothesis
Hypothesis 1 The valuation of firms in maturity stage that have been sold out by VCs is higher four years after the exit than it was in the exit moment.
Hypothesis 2 Contract duration has a positive impact on the valuation increase brought by VCs to portfolio companies.
3 Data and measures
In order to assess portfolio companies’ sustained performance, we used financial performance ratios that were identified both in literature and in VCs’ practical use.
3.1 Dependent variables
Market performance: • sales growth (SG)
• external markets sales evolution (EMSE). Financial performance:
• EBITDA evolution (EBITDAE) • book value evolution (BVE). Sustainability:
• headcount evolution (HCE)
• number of quality certifications (NQC).
Variable assessment was made through growth percentages between fourth and fifth year after an exit occurred. Whenever companies were sold out between 1995 and 2000, we used growth percentage from 2005 to 2006. To assess EMSE we used data from 2006 and 2007, for portfolio companies sold out until 2001 (more than four years after the exit). To assess headcount evolution we used data from 2006 and 2007 because we could not find it from 2005 whenever portfolio companies were sold out until 2001 (more than four years after the exit). Whenever portfolio companies were sold out in 2002 and 2004 we used data from the fourth and fifth year after an exit occurred. The choice of headcount
figure as indicator of sustainability allowed us to assess employment level evolution in portfolio companies.
3.2 Independent variable
• Based on literature review and VCs practical experience, we selected investment contract duration (ICD) as the independent variable
To test the hypothesis we used regression analysis with one independent variable and six dependent variables.
3.3 Research method
We defined two different populations; one of them composed by VCs and the other composed by portfolio companies from 1995 to 2004, sold out until 2009. These firms were in maturity stage when they became part of a VC investment portfolio.
VC population was composed of 28 officially registered companies in Portugal. Portfolio companies’ population was defined as the firms that were totally or partially held by a VC and were in maturity stage (more than 15 years old) when they signed up an investment agreement. We did not control this population for investment contract duration or VC shareholding percentage.
3.4 Data collection
In this paper, we collect data from VC’s and from portfolio companies:
3.4.1 VCs
Out of the 28 VCs, 19 were managing 51 venture capital funds and nine did not have any registered fund. We excluded four VCs because they did not have any registered funds nor reported their head count and investment portfolio. Therefore population was reduced to 24 VCs. Response rate to survey 1 was relevant, 16 answers or 66.7% of the adjusted population. These 16 companies managed 42 funds or 82.4% of all funds and had a market share of 73% in 2009.
3.4.2 Portfolio companies – 1995–2004
In December 2004 at the end of the relevant ten year period, 18 VCs had 100% of the money under VC management (678 million Euros). Therefore we got information from portfolio companies representing 80.0% of all firms that, from 1995 to 2004 had been subject of acquisition and exit operations. Portfolio companies’ database from the period 1995 to 2004 contains 407 companies. We excluded companies displaying no activity when this research was conducted which means a mortality rate of 30.7%, in line with other studies about this industry like Sahlman (1990). We also excluded foreign companies and merged companies.
Table 1 Company aging
Age (years) No. of companies
≤ 1 90 > 1 × ≤ 5 34 > 5 × ≤ 10 48 > 10 × ≤ 15 23 > 15 60 Total 255 We then launched survey 2 to managers of these 255 portfolio companies. Out of the
population of these 60 companies aging more than 15 years at the investment date, we excluded ten firms that were still portfolio companies when the research was conducted and eight that were sold out after 2004. Out of the 42 remaining firms, we could only access financial reports of the full period studied for 38 firms.
3.4.3 Populations and samples
VCs – we used a sample of 16 firms that agreed to be surveyed representing 66.7% of the population. These companies had a market share of 61.5% in 2009.
Portfolio companies – we used a sample of 38 firms aging at least 15 years at the date of the investment agreement, out of a population of 60 firms.
3.5 Statistical procedures, tests and results
For VC sample we used frequency analysis, average calculation, mode, maximum and minimum analysis. We estimated the reliability of survey 1 through Cronbach’s alpha. Regarding portfolio companies, we used frequency analysis, average calculation, modes and medians. Relation between dependent variables was verified through correlation models. To estimate independent variables predictability we used linear multiple regression.
Cronbach’s alpha – to assure internal consistency of scales and subscales of survey 1, we used the indicator Cronbach’s alpha. All tests indicated a good or greater than good result. VCs’ management answers related with VC functions, with nine subscales, proved greater value than 0.82; factors added value, testing 16 subscales, proved to be greater value than 0.94 and portfolio performance, testing 16 subscales, proved greater value than 0.97.
Correlation tests between the concepts of performance and sustainability – conducted tests of correlation between the dependent variables, in two cases, returned correlation with statistical significance: a moderate positive correlation (r = 0.333, p > 0.05) between sales growth and external markets sales evolution. A strong negative correlation (r = –0.775, p > 0.01) between book value evolution and external markets sales evolution. The overall analysis did not show any correlations between the remaining variables. The moderate positive correlation between SG and external markets sales evolution is normal with the external markets sales evolution with higher percentage.
Regression results – we used linear regression to estimate the influence of independent variable ‘duration on contract’ on the variables SG (DV1), external markets
sales evolution (DV2), EBITDA evolution (DV3), book value evolution (DV4), headcount evolution (DV5) and number of quality certifications (DV6). Results are presented for significance tests distribution of Student (or t test) and Lavene (or F test), with no statistically significant value for sig when t ≥ 0.05 for a p < 0.05.
Table 2 Significance of t
Independent variable DV1 DV2 DV3 DV4 DV5 DV6
Contract duration 0.523 0.243 0.112 0.051 0.331 0.729 The result which lies closer to the value with statistical significance is the ratio of the dependent variable ‘book value evolution’ DV4 with the independent variable ‘duration of the contract’ with a significant value of t = 0.051.
Table 3 Significance of F
DV1 DV2 DV3 DV4 DV5 DV6
0.694 0.501 0.273 0.086 0.337 0.597
4 Empirical analysis and results
4.1 Venture capitalist information
Firms and human capital – the 28 officially registered VCs have a total of 188 employees. The average number of employees per VC is 6.7 with a maximum of 30. Excluding those who referred to have none, the average raises up to 8.2 employees per company, in line with US VCs in 2008 which had an average of 8.5 employees. VC employees are highly qualified: 87.2% have at least bachelor’s degree however we only got one PhD graduate. In our research, most employees (86.1%) are graduated in Economics or Business/Management. In terms of age structure, 79.0% of all employees have 25 to 45 years old. Regarding prior professional experience, 55.9% already worked in a different industry, 37.1% come from VC business and 1.4% have worked both in and out the industry. Taking experience in portfolio companies’ industry, the mode (37.5% of all answers) is ‘some experience’ however 56.3% consider important to have a good knowledge of their portfolio companies’ business.
VC representative in portfolio companies – according to managers, VC representation is usually done through a portfolio companies’ board member (100% of all answers) but rarely on an executive function. Considering the number of portfolio companies, 64.3% of all VCs have six or less; 14.3% have from 10 to 20 and the same figure for those having from 20 to 40 portfolio companies. Only two VCs have more than 40 invested firms (7.1%) and those are state owned funds. The average number of portfolio companies per VC employee is 2.2. The biggest VC owning 150 portfolio companies has an average of five companies per employee. Contact regularity with portfolio companies is, in 93.8% of all cases, equal or inferior to monthly and the frequency for performance control is monthly in 43.8% and quarterly in 31.3% of all observations. Therefore, we have a combined frequency of 75.1% of all answers. Performance evaluation targets are based in two or more ratios in 93.8% of all observations. Two of the mentioned indicators (SG and EBITDA), analysed simultaneously or combined with other indicators are
quoted by 87.5% of all managers. According to 87.6% of all VC managers in the Portuguese market rarely or never there is a replacement of portfolio companies’ management team. This data is not in line with a previous survey conducted in the US by Gorman and Sahlman (1989) where VCs in average replace three CEOs of all portfolio companies during the investment agreements. Considering the importance of VC manager’s role in portfolio companies’ performance, they consider it to be high, for the following purposes and in the following order: fund raising; general management; back-office organisation; product and marketing strategy; market information; innovation strategy; information systems; EU grants; Technology. About exit clauses, answers about divestiture strategy in Portugal are not surprising and are consistent with all other surveys carried out in the past. Management buy out and management buy in are first and second most common options. Unsurprisingly, in the US the most desired exit is through an IPO. When we asked VCs if in their opinion an investment agreement with a VC increased portfolio companies’ valuation, 93.8% of all respondents said yes. When we asked them if they agreed that this valuation increase effect would last far beyond the divestiture date, 87.5% agreed or tended to agree.
Portfolio companies’ performance after divestiture – when asked about portfolio companies’ performance after divestiture, 75.0% of all VC managers said it was good. For the same question but considering a four-year time-frame after the exit, the figure decreases to 62.5%. However 31.3% of all respondents said they did not have that information. This result is mainly due to scarce information about portfolio companies after the exit, which means that many VCs do not keep track record of prior investments. When we asked them what performance ratios did get better after four years, they answered ‘revenue’ and ‘book value’.
4.2 Portfolio companies information
Firms and human capital – Table 4 displays key figures to characterise this 38 company sample.
Table 4 Sample’s data (from 2008)
Type of firm
Revenues (M€) 1,100.85
Average revenue (M€) 28.97
Revenue – external markets 74.6%
Headcount 11,325 Average headcount 298.0 Business activity Agriculture 2.6% Manufacturing 73.7% Retail 2.6% Services 21.1% Out of these 38 companies in maturity stage, 28 are manufacturers in traditional
Portuguese activities, also in maturity stage.
• headcount – 19 SMEs (50.0%), 14 big enterprises (36.8%) and five micro enterprises (13.2%)
• revenues – 24 SMEs (63.1%), nine big enterprises (23.7%) and five micro enterprises (13.2%).
If we take ‘firm’s age’ when the investment agreement was signed some of them are surprisingly old. Sample’s average is 57.5 years-old with a maximum of 180 years-old and a minimum of 16 years-old. Nineteen firms (50%) were more than 51 years old.
Contract duration VC managers (66.7%) consider the investment agreement duration as an ‘important, ‘very important’ or fundamental’ event for portfolio companies’ success after divestiture. In our model, we used it as an independent variable. Average duration in this sample is 4.53 years. Only one contract was set for ten years.
• Portfolio companies’ sustained performance – to evaluate performance we used the previously referred indicators. These are used as drivers combining performance and sustainability indicators, also used in assets’ relative evaluation. When we used multiple-method valuation, these indicators are computed for purposes of
calculation. Positive or negative evolution in the chosen indicators shows variable direction for purposes of company valuation. We did not consider variations in the multiples themselves.
• SG – total revenues from sales for the 38 companies in this sample after four years of an exit shows a positive evolution of 10.4%. Twenty-four of them (63.2%) had an increase ranging from 0.6 % to 174.7%. One company (2.6%) had no variation and 13 companies (34.2%) had a negative variation, ranging from –1.5% to –31.0%. We can therefore conclude that 65.8 % of all companies increased or maintained revenues from sales. Our survey results are consistent with this analysis.
• Sales for external markets – this sample shows a positive evolution of 19.9% in this indicator. Twenty-nine companies (76.3%) actually sold for external markets. Out of those 29, 79.3% increased their sales to external markets, ranging from 0.5 % to 769.0%. Six of them (20.7%) experienced a decrease in this indicator ranging from – 5.5% to –47.0 %. In the survey, 93.8% of all VC managers categorised
‘internationalisation strategy during investment agreement’ as ‘important’, ‘very important’ or ‘fundamental’.
• EBITDA – evolution on EBITDA displays a negative variation of 11.3% for this sample. Fifteen companies (39.5%) increased their EBITDA, ranging from 3.0% to 279.5% and 23 (60.5%) had a negative variation in this indicator, ranging from – 2.2% to 431.3%. Survey respondents had a more positive view on EBITDA evolution.
• Book value – we calculated book value for all companies in this sample and got a positive variation of 2.4%. Twenty-five companies (65.8%) increased their book value, ranging from 0.7% to 345.1% and 13 (34.2%) had a negative variation, ranging from–0.5% to –502.0%. Both VC managers’ perception and these calculations returned the same conclusions: the majority of companies ‘increased’ or ‘maintained’ their book value.
• Headcount – year four after exit returned 11,083 employees for this sample’s companies and year five 11,128. This means a positive evolution of 0.4%. While 20 companies (52.6%) increased their headcount, ranging from 0.7 % to 320.0%, four of them (10.5 %) had no variation at all in headcount figure and 14 firms (36.8%) decreased their employee-base, ranging from –1.0% to –20.6%. Survey and calculations returned similar conclusions.
• Quality certifications – 27 companies (71.1%) were certified in at least one of the ISO standards. Six companies were certified in two or more ISO standards. Twenty-six companies (68.4%) had certification for quality management systems. Four companies (10.5%) had certification for EMS. Eleven firms (28.9%) had none.
5 Discussion and conclusions
Portfolio companies’ performance is generally positive: global amount of revenue from sales, sales to external markets, book value and headcount, increased or stabilised between fourth and fifth year after VC divestiture.
VCs’ employee educational levels are adequate and their professional experience is convincing. Therefore, VCs seem adequately prepared to manage investment portfolios.
Portfolio companies’ mortality rate (30.7%) is in line with international benchmarks and cannot be related with VC investment agreements. The number of exporting companies in our sample is quite impressive (76.3%). We actually believe that portfolio companies’ internationalisation should be subject of a deeper analysis. Global amount for EBITDA decreased between fourth and fifth year after divestiture. Considering two of the most used indicators in firms’ relative or comparative valuation we concluded that PSR and PBV would have at least a positive evolution for this sample’s companies. EBITDA variable are used in corporate valuation through NPV which we did not do. According to Damodaran (2012), NPV analysis should not be used for assets whose cash flows are not positive or could not be reasonably estimated for future periods of time.
Hypothesis 1 was accepted because the valuation of firms in maturity stage at the date of VC investment which was later sold out is superior after four years of divestiture. Three of the performance variables – SG, external markets and book value – and one sustainability variable – headcount – had a positive behaviour.
Regarding Hypothesis 2 which seeks to establish factors influencing on the valuation increase produced by VC investment in the duration of the agreement with sustained performance, we could not find influential impact of selected independent variables – contract duration – on sustained performance dependent variables. We used linear regression, to estimate the influence of independent variables ‘duration on contract’ on the variables SG, external markets sales evolution, EBITDA evolution, book value evolution, headcount evolution and number of quality certifications. The result which lies closer to the value with statistical significance is the ratio of the dependent variable ‘book value evolution’ with the independent variable ‘duration of the contract’ with a significant value of t = 0.051. Therefore, H2 is rejected. However, we stress that independent variables’ selection was bounded by survey 2’s low rate of acceptance.
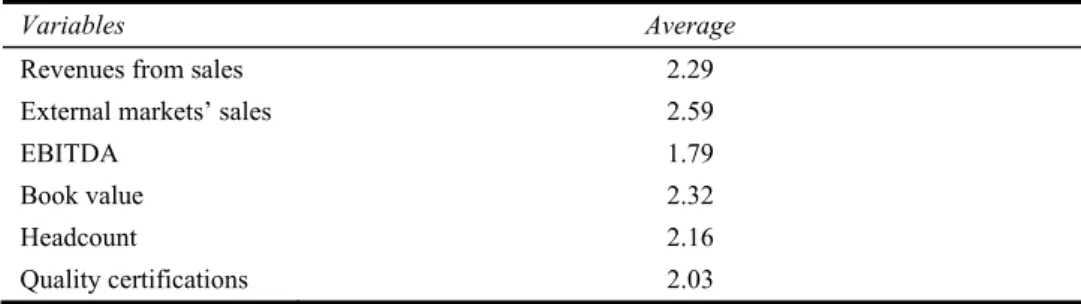
Table 5 displays average results for each of the sustained development variables after four years of an exit (three-point Likert scale: 3 – increased; 2 – maintained; 1 – decreased):
Table 5 Sustained development
Variables Average
Revenues from sales 2.29
External markets’ sales 2.59
EBITDA 1.79
Book value 2.32
Headcount 2.16
Quality certifications 2.03
6 Implications and future research
This work brings new perspective on venture capital’s role on portfolio companies both in terms of time impact and activity impact. Future research could explore the role of venture capital in internationalisation of Portuguese companies. The influence of venture capital for internationalisation in all development stages deserves further study as it is a key issue for the development of the Portuguese economy.
7 Limitations
The response rate to the survey of managers of SCR was significant (66.7%) but unfortunately this is not the case with the questionnaire sent to the subsidiaries. As mentioned in the study, 14 of the 255 responses were received from companies active in all stages of development which had been communicated by venture capital between 1995 and 2004. This limited the study which was originally intended deeper and enriched with the opinions of managers of subsidiaries.
The study was conducted at a time of economic crisis, characterised by a weak trend in economic growth in the last five years (2005 – 0.9%; 2006 to 1.4%; 2007 – 2.0%; 2008 – 0.5%; 2009 – 0.1%) which also affects the performance of subsidiary, lying in the sample whose values EBITDA and cash flows are negative. The economic downturn has limited the development of enterprises and thus a factor of abnormality for the study.
References
Berman, S., Wicks, A., Kotha, S. and Jones, T. (1999) ‘Does stakeholder orientation matter? The relationship between stakeholder management models and firm financial performance’,
Academy of Management Journal, Vol. 42, No. 5, pp.488–506.
Bottazzi, L., Da Rin, M. and Hellmann, T. (2008) ‘Who are the active investors? Evidence from venture capital’, Journal of Financial Economics, Vol. 89, No. 3, pp.488–512.
Busenitz, L., Fiet, J. and Moesel, D. (2004) ‘Reconsidering the venture capitalists’ ‘value added’ proposition: an inter-organizational learning perspective’, Journal of Business Venturing, Vol. 19, No. 6, pp.787–807.
Cornelius, B. (2005) ‘The institutionalisation of venture capital’, Technovation, Vol. 25, No. 6, pp.599–608.
Damodaran, A. (2012) Investment Valuation: Tools and Techniques for Determining the Value of
Any Asset, 3rd ed., Wiley Finance, New York.
Duffner, S., Scmid, M. and Zimmermann, H. (2009) ‘Trust and success in venture capital financing’, Kyklos, Vol. 62, No. 1, pp.15–43.
Epstein, M. and Roy, M.J. (2001) ‘Sustainability in action: identifying and measuring the key performance drivers’, Long Range Planning, Vol. 34, No. 5, pp.585–604.
Freeman, E. (1984) Strategic Management: A Stakeholder Approach, Pitman, Boston.
Gompers, P. (1994) ‘The rise and fall of venture capital’, Business and Economic History, Vol. 23, No. 2, pp.1–26.
Gorman, M. and Sahlman, W. (1989) ‘What do venture capitalists do?’, Journal of Business
Venturing, Vol. 4, No. 4, pp.231–248.
Hellmann, T. and Puri, M. (2000) ‘The interaction between product market and financing strategy: the role of venture capital’, Review of Financial Studies, Vol. 13, No. 4, pp.959–984.
Hellmann, T. and Puri, M. (2002) ‘Venture capital and the professionalization of start-up firms: empirical evidence’, Journal of Finance, Vol. 57, No. 1, pp.169–197.
Hsu, D.H. (2004) ‘What do entrepreneurs pay for venture capital affiliation?’, Journal of Finance, Vol. 59, No. 4, pp.1805–1844.
Jääskeläinen, M., Maula, M. and Seppa, T. (2006) ‘Allocation of attention to portfolio companies and the performance of venture capital firms’, Entrepreneurship Theory and Practice, Vol. 30, No. 2, pp.185–206.
Kortum, S. and Lerner, J. (2000) ‘Assessing the contribution of venture capital to innovation’,
Rand Journal of Economics, Vol. 31, No. 4, pp.647–692.
Lipuma, J. (2007) Small Business Research Summary, Corporate Venture and the International Intensity of Portfolio Companies, No 306, p.48 [online] http://www.archive.sba.gov/ADVO/ research/rs306tot.pdf (accessed 01 May 2010).
Makëlä, M. and Maula, M. (2006) ‘Inter-organizational commitment in syndicated cross-border venture capital investments’, Entrepreneurship Theory and Practice, Vol. 30, No. 2, pp.273–299.
Manigart, S., Collewaert, V., Wright, M., Pruthi, S., Lockett, K., Bruining, H., Hommel, U. and Landstrom, H. (2006) Human Capital and the Internationalization of Venture Capital Firms, Vlerick Leuven Gent Management School Working Paper Series, 12 February, pp.1–27 [online] http://www.econpapers.repec.org//2006-01.htm (accessed 05 April 2010).
Marom, I.Y. (2006) ‘Toward a unified theory of the CSP-CFP link’, Journal of Business Ethics, Vol. 67, No. 2, pp.191–200.
Masulis, R.W., Krishnan, C. and Singh, A. (2007) Does Venture Capital Reputation Matter?
Evidence from Subsequent IPO Issuer Performance, Vanderbilt University Working Paper
[online] http://www.nd.edu/~finance/020601/news/Ron/Masulis/paper/Updated%202-22-07.pdf (Accessed 30 September 2010).
Maula, M., Autio, E. and Murray, G. (2005) ‘Corporate venture capitalists and independent venture capitalists: what do they know, what do they know and should entrepreneurs care?’, Venture
Capital, Vol. 7, No. 1, pp.3–21.
Nelling, E. and Webb, E. (2009) ‘Corporate social responsibility and financial performance: the ‘virtuous circle’ revisited’, Review of Quantitative Finance and Accounting, Vol. 32, No. 2, pp.197–209.
Niosi, J. (2003) ‘Alliances are not enough explaining rapid growth in biotechnology firms’,
Research Policy, Vol. 32, No. 5, pp.737–750.
Rosenstein, J. (1988) ‘The board and strategy: venture capital and high technology’, Journal of
Business Venturing, Vol. 3, No. 2, pp.159–170.
Sahlman, W.A. (1990) ‘The structure and governance of venture capital organizations’, Journal of
Shepherd, D. and Zacharakis, A. (2001a) ‘Speed to initial public offering of VC-backed companies’, Entrepreneurship Theory and Practice, Vol. 25, No. 3, pp.59–70.
Shepherd, D. and Zacharakis, A. (2001b) ‘The venture capitalist-entrepreneur relationship: control, trust and confidence in co-operative behaviour’, Venture Capital: An International Journal of
Entrepreneurial Finance, Vol. 3, No. 2, pp.129–149.
Waddock, S.A. and Graves, S.B. (1997) ‘The corporate social performance-financial performance link’, Strategic Management Journal, Vol. 18, No. 4, pp.303–319.
White, R.J., D’Souza, R. and McIlwraith, J. (2007) ‘Leadership in venture backed companies: going the distance’, Journal of Leadership and Organizational Studies, Vol. 13, No. 4, pp.121–132.
Zarutskie, R. (2010) ‘The role of top management team human capital in venture capital markets: evidence from first-time funds’, Journal of Business Venturing, Vol. 25, No. 2, pp.155–172.