Importance-Performance Analysis As A Tool In Evaluating
Higher Education Service Quality: The Empirical Results Of
Estig (IPB)
Fátima de Jesus Henriques Silva, Polytechnic Institute of Bragança, Bragança, Portugal, [email protected]
Paula Odete Fernandes, Polytechnic Institute of Bragança, Bragança, Portugal. NECE (Unit of Business Research, UBI), [email protected]
Abstract
Effective management depends on the ability to assess the quality of services provided. The models of quality management are applied in business and has been adapted for use in the education sector, based on the experiences lived by the students.
Based on the literature review and empirical study, following the Importance-Performance Analysis, this study identifies the strengths and weaknesses of the School of Technology and Management of Bragança, from the perspectives and perceptions of students who attend the school. According to the results obtained it was concluded that students were satisfied with the performance and quality of services provided by the institution.
Keywords Importance-Performance Analysis; Higher Education; Students Perceptions; Bragança Polytechnic Institute.
1. Introduction
Quality has become an important subject of discussion among Higher Education Institutions, and has been extensively studied in recent years. One of the main ways to retain students is determining if they are satisfied with the institution performance as they compare to what they expected when their arrival at the institution, and during the frequency at academic years.
Importance-Performance Analysis (IPA) are a part of marketing research techniques that involve the analysis of customer attitudes toward main product or service and has been applied in several markets: e.g., automotive, food, housing, education, health care, hospitality industry, tourism, among others (e.g., Sethna, 1982; Hawes & Rao, 1985; Cunningham & Gaeth, 1989; Dolinsky, 1991; Martilla & James, 1977; Alexitch et al. 2004; Kitcharoen, 2004; Go & Zhang, 2008; Silva & Fernandes, 2010).
The study investigated the importance and performance of service attributes in School of Technology and Management (ESTiG), of Polytechnic Institute of Bragança (Portugal), as perceived by undergraduate and master students. The study also required to determine the relationship between the perceived service quality and student satisfaction. For that the IPA model is a methodological used.
2. Importance-Performance Analysis
Importance-Performance Analysis was first proposed and introduced by Martilla and James (1977) as a means by which to measure client satisfaction with a product or service. The IPA approach recognizes satisfaction as the function of two components: the importance of a product or service to a client and the performance of a business in providing that service or product (Martilla & James, 1977). In this way, IPA examines not only the performance of an item, but also the importance of that item as a determining factor in satisfaction to the respondent (Silva & Fernandes, 2010). The combined client ratings for those two components then provide an overall view of satisfaction with clear directives for management and where to focus agency resources.
This method has proven to be a generally applicable tool which is relatively easy to administer and interpret resulting in extensive use among researchers and managers in various fields, and is a way to promote the development of effective marketing programs, because it facilitates the interpretation of data and increases usefulness in making strategic decisions (Slack, 1994; Matzler et al., 2003; Kitcharoen, 2004; Abalo et al., 2007; Silva & Fernandes, 2010).
Fig. 1. Importance-Performance Matrix (Adapted from Martilla & James, 1977, p. 78).
The four quadrants in importance-performance analysis are characterized as (Martilla & James, 1977, p. 78):
“- A. Concentrate here - high importance, low performance: requires immediate attention for improvement and are major weaknesses;
- B. Keep up with the good work - high importance, high performance: indicate opportunities for achieving or maintaining competitive advantage and are major strengths;
- C. Low priority - low importance, low performance: are minor weaknesses and do not require additional effort;
- D. Possible overkill - low importance, high performance: indicate that business resources committed to these attributes would be overkill and should be deployed elsewhere”.
3. Perceived Importance and Performance of Attributes: Methodology
and Results
We used the IPA for assessing students’ perceptions of the School of Technology and Management of Polytechnic Institute of Bragança, located in Bragança town, Portugal. The methodology of the empirical research was articulated in three main steps: (i) selection of variables to be included in the Importance-Performance analysis according with the survey research; (ii) definition and execution of the survey; (iii) data-analysis and presentation of results.
3.1. Selection of Variables
As for the selection of the determinants of students’ satisfaction, the choice has been made on the basis of previous literature (e.g., Joseph & Joseph, 1997; Alves, 1998; Pike, 2004); as result we decided to focus on the following attributes:
(i) Quality of General Aspects: it includes Moderns facilities, Clean facilities, Sports activities, Cultural activities, Associations of students;
(ii) Quality of the Library: Easy access to shelves; Ways of consulted rapidly; Warmth of its staff and Interest in solving the problems of student;
(iii)Quality of Computer Laboratory Facilities: Availability of laboratories and computer facilities; Ability to use after classes and Existence of training in computer tools; (iv)Quality of Social Services: Financial aid for students; Existence of medical support to
students; Availability of accommodation for students; Existence of canteens; Knowledge of rules and procedures; Trust and safety in service; Information service completion; Interest in solving the problems of student; Simple rules and procedures and Warmth of its staff;
(v) Quality of Academic Services: Simple procedures; Knowledge of rules and procedures Simple procedures; Interest in solving the problems of student; Trust and safety in service; Information service completion; Quick response and Warmth of its staff;
(vii) Quality of Undergraduate Programmes: Updated content and Several career opportunities;
(viii)Quality of External Relations: Getting the internships; Exchange programs with foreign; Conferences and seminars and Internet connection.
3.2. Sample and Questionnaire
The survey was conducted during April and May of 2010, in 2nd semester of the 2009/2010 academic year. A total of 695 valid questionnaires were received, which represents 34% of total population (2.031 students). The sample size resulted in sampling error of 3,7%, assuming a 95% confidence level.
The instrument used was divided into two sections: section I collected the general demographic information of the student; while section II refers to students' perceptions of the importance and performance of key attributes and their satisfaction for these attributes. The attributes under consideration are: Quality of General Aspects, Quality of the Library, Quality of Computer Laboratory facilities, Quality of Academic Services, Quality of Teaching Aspects, Quality of Undergraduate Programmes, and Quality of External Relations.
The data for this study were collected in classroom, applying a questionnaire to the students who attend the undergraduate programmes and master degree programmes at the School of Technology and Management of Polytechnic Institute of Bragança (Portugal).
All the items were adapted from scales developed in similar studies (e.g., Joseph & Joseph, 1997; Alves, 1998; Pike, 2004); besides to evaluate the single factors, students were also asked to provide an overall evaluation of the overall perceived satisfaction. All the evaluations were measured through a five-point Likert scale (1=Strongly disagree; 2=Disagree; 3=Neither agree or disagree; 4=Agree; 5=Strongly agree).
3.3. Findings and discussion
Table 1 lists some of the socio-demographic characteristics of the respondents. The original sample consisted in 695 students, 46% female and 54% male, and the majority has between 18 and 22 years old and coming from undergraduate programs, 57,8% from engineering sciences and 42,2% from management sciences. As to their origin, this sample is characterized by 87,9% of students come from the area north of Portugal, and the, district of Bragança, Braga and Porto the main contributors, with respectively 37,5%, 22,4 % and 20,1%. The Central Region represents 7,5% of the sample, and the districts of Aveiro and Viseu are the most representative with respectively 3,7% and 2,4%. The area referred to as Other is responsible for 4,6% of the sample, among which are students with 1,2% PALOP (African Countries of Portuguese Official Language).
Table 1: Socio-demographic characteristics of respondents[n=695].
Variable No. %
Gender
Female 320 46,0
Male 375 54,0
Age
18-22 years old 510 73,0
22-27 years old 133 19,0
> 28 years old 52 8,0
Study Areas
Engineering Sciences 402 57,8
Academic Year
1st 262 38,0
2nd 226 32,0
3rd 145 21,0
1st master degree 62 9,0
Geographical location
Northern 611 87,9
Central 52 7,5
Others 32 4,6
After the sample characterization is intended to make the analysis Importance-Performance applied to ESTiG, methodology already explained above. It is useful to check not only the importance that students attach to different attributes of the service, as well as the performance on the part of the institution, thus analyzing students' satisfaction or dissatisfaction. To this end, this study was based on analysis of eight categories/attributes and variables that are different in each category and are an integral part of the questionnaire.
According to the below table, the attributes that students mentioned as the most important being a higher education institution were: the general aspects, the fact that the facilities are modern and clean, the library's ability to allow easy access to books the shelves and quick reference, the availability of laboratories and computer facilities, financial support to students and the existence of the canteen. For faculty, the ease of communication with teachers, clarity and precision in the exposition of knowledge, the scientific capacity of teachers and assessing fair, the courses have updated content and professional opportunities, the final stages of obtaining and last connection to the Internet. And the other hand the attributes considered less important are related to general aspects of the institution and relate to sports, culture and the existence of associations of students.
In evaluating the quality of services provided by ESTiG, the variables that presented the best performance with the general aspects were (see Table 2): the fact that ESTiG have modern facilities, clean and the existence of students associations. The variables with the best performance in library services were the possibility of allowing easy access to shelves and books and quick reference, these were also the variables considered most important in this service. The Social Services have a better performance with the availability of accommodation in student residences and the existence of the canteen. For faculty related variables emerged the friendliness of the teachers, ease communication with teachers, the scientific expertise and advice of the basic bibliography, as those that showed the best performance. The two variables related to the undergraduate programmes had a good performance. In relation to the external relations only one of this variable category present a value below the average. Generally the aspects considered the most negative are related to the Academic Services, where none of the variables was higher than the global average.
The values obtained for the standard deviation (SD) are considered low; the variations of the responses are low, with some figures that showed significant discrepancies (Table 2). This measure reflects the variation of dispersion of a set of data around the mean, i.e., the greater or less variability of results. Therefore, regarding the performance, the variables that showed significant values of discrepancy were: sports, kindness and interest in solving the problems of students in library services, financial aid to students, and availability of medical support to students, there are rules and the simple things of Social Services, Academic Services in the quick service and obtain internships.
and those with values above the global average. The least important attribute was the quality of general aspects. In the other hand, the average of the attributes of performance varies between 3,798 and 3,143 being the average of responses between the 3 and 4, it can be said that the average values are satisfactory since they are always higher than the midpoint 3. These results suggest that in general, students are satisfied with the performance of ESTiG as the average of all aggregate variables are higher than the intermediate value. The attributes that were most performance, considering those who had an average higher than the global average, was five. The 1st place in the ranking included the undergraduate programmes, 2nd place the quality of external relations, 3rd place the quality of the general aspects, 4th place the quality teaching services and finally the quality of the library. The quality of Academic Services is the attribute that showed lower performance from the perspective of students.
Table 2: Importance-Performance Ratings for ESTiG.
Categories/Attributes/Variables Importance Performance
Meana SD Meanb SD
1. General Aspects 3,967 0,817 3,600 0,845
1.1 Moderns facilities 4,18 0,772 3,78 0,736
1.2 Clean facilities 4,55 0,655 3,88 0,730
1.3 Sports activities 3,55 0,900 2,94 1,052
1.4 Cultural activities 3,76 0,833 3,29 0,874
1.5 Associations of students 3,79 0,922 4,12 0,832
2. Library 4,372 0,807 3,505 0,933
2.1 Easy access to shelves 4,42 0,764 4,06 0,796
2.2 Ways of consulted rapidly 4,45 0,759 3,56 0,850
2.3 Warmth of its staff 4,25 0,875 3,14 1,077
2.4 Interest in solving the problems of student 4,37 0,829 3,25 1,007
3. Computer Laboratory Facilities 4,315 0,781 3,452 0,892
3.1 Availability of laboratories and computer facilities
4,44 0,754 3,66 0,858
3.2 Ability to use after classes 4,32 0,792 3,35 0,954
3.3 Existence of training in computer tools 4,19 0,797 3,35 0,865
4. Social Services 4,294 0,809 3,454 0,955
4.1 Financial aid for students 4,47 0,845 3,47 1,051
4.2 Existence of medical support to students 4,25 0,882 3,18 1,003 4.3 Availability of accommodation for students 4,29 0,856 3,69 0,958
4.4 Existence of canteens 4,51 0,716 4,21 0,865
4.5 Knowledge of rules and procedures 4,16 0,791 3,63 0,872
4.6 Trust and safety in service 4,26 0,780 3,46 0,901
4.7 Information service completion 4,13 0,813 3,34 0,961
4.8 Interest in solving the problems of student 4,35 0,786 3,28 0,960
4.9 Simple rules and procedures 4,27 0,765 3,14 1,008
4.10 Warmth of its staff 4,24 0,856 3,15 0,973
5. Academic Services 4,267 0,825 3,143 0,939
5.1 Simple procedures 4,23 0,817 3,19 0,906
5.2 Knowledge of rules and procedures 4,28 0,798 3,24 0,882
5.3 Interest in solving the problems of student 4,32 0,809 3,21 0,932
5.4 Trust and safety in service 4,27 0,808 3,19 0,920
5.5 Information service completion 4,19 0,840 3,13 0,920
5.6 Quick response 4,31 0,845 2,94 1,025
5.7 Warmth of its staff 4,27 0,861 3,08 0,989
6. Teaching Aspects 4,450 0,749 3,518 0,903
6.1 Friendliness of the teachers 4,32 0,789 3,52 0,869
6.2 Personalized attention 4,26 0,808 3,49 0,880
6.3 Easy communication with teachers 4,46 0,721 3,65 0,913
knowledge
6.5 Scientific expertise of the teacher 4,57 0,720 3,56 0,899
6.6 Fair assessment 4,62 0,748 3,33 0,939
6.7 Advice the basic bibliography 4,28 0,755 3,61 0,923
7. Undergraduate Programmes 4,616 0,691 3,798 0,873
7.1 Updated content 4,57 0,713 3,72 0,891
7.2 Several career opportunities 4,66 0,670 3,87 0,855
8. External Relations 4,408 0,783 3,681 0,928
8.1 Getting the internships 4,56 0,794 3,21 1,113
8.2 Exchange programs with foreign 4,33 0,764 3,76 0,877
8.3 Conferences and seminars 4,22 0,828 3,59 0,896
8.4 Internet connection 4,53 0,747 4,16 0,827
Total Average 4,336 0,783 3,519 0,908
a
Rating obtained from a five-point Likert scale ranging from “Very unimportant” (1) to “Very important” (5).
b Rating obtained from a five-point Likert scale ranging from “Strongly Disagree” (1) to “Strongly
Agree” (5).
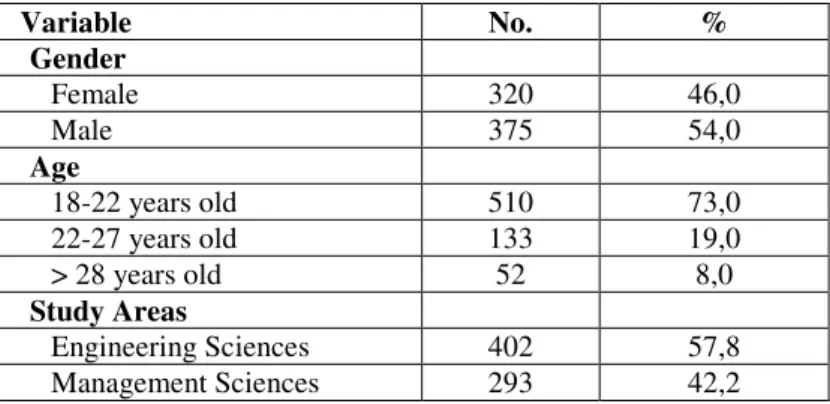
Importance-Performance matrix is represented in Fig. 2. So, bearing in mind a study with the values of intermediate scales (Silva & Fernandes, 2010) is indispensable to do an analysis based on the overall median values, recommended by Lynch et al. (1996) and Martilla and James (1977). These authors suggest that should still be considered the median value of the data reported to cross the axes, based on the trend of responses, median values as a measure of central tendency are theoretically preferable to means because a true interval scale may not exist. Can thus be observed four different quadrants being the axis defined by the global median values (4,51; 3,54) for the attributes and the global average.
1,0 1,5 2,0 2,5 3,0 3,5 4,0 4,5 5,0
1,0 1,5 2,0 2,5 3,0 3,5 4,0 4,5 5,0
Im p o rt an ce ESTiG Performance Legend Library Computer Laboratory Facilities Social Services Academic Services Teaching Aspects Undergraduate Programmes External Relations General Aspects Quadrant A
Quadrant C Quadrant D
Quadrant A
Quadrant C Quadrant D
Quadrant B
Fig. 2. IPA for the global average, according to the median value for the axis.
4. Conclusions
Importance-Performance Analysis (IPA) is simple and useful techniques that can help managers identify which attributes should be improved to increase overall customer satisfaction. From the research prospective, this study supports the adoption of the IPA as an alternative framework for evaluating students’ satisfaction. Such framework can be used in further research on students’ satisfaction.
Through the Importance-Performance Analysis we concluded that the attributes considered most important by students in Higher Education Institution were: the quality of undergraduate programmes, the quality aspects related to teaching, external relations and the quality of the Library.
The quality of the general aspects was considered the less important. In the other hand and regarding the ESTiG performance, in the students’ point of view, the results showed that in general, students are satisfied with the performance of ESTiG since the average of all aggregate variables are higher than the intermediate value. The attributes considered by the students surveyed, with higher performance included: the quality of undergraduate programmes, the quality of external relations, the quality of general aspects, the quality of teaching aspects and ultimately the quality of the Library. The attribute with the lowest performance was the quality of Academic Services.
The generalization of these results should not, however, be overstated. It would be interesting to look at institution board management and employers’ perceptions in terms of education quality attributes and how these differences affect the types of policy and management practice.
Acknowledgments
References
Abalo, J., Varela, J. and Manzano, V. (2007), ‘Importance values for Importance-Performance Analysis: A formula for spreading out values derived from preference rankings’, Journal of Business Research, 60(2), 115-121.
Alexitch, L., Kobussen, F. and Stookey, S. (2004), ‘High School Students' Decision To Pursue University: What Do Guidance Counselors and Teachers Tell Them?’, Guidance and Counseling, 9(4), 142-152.
Alves, H. (1998), O Marketing das Instituições de Ensino Superior: O caso da Universidade da Beira Interior,Master Thesis in Management. University of Beira Interior, Portugal. Bacon, D. (2003), ‘A Comparison of Approaches to Importance-Performance Analysis’, International Journal of Market Research, 45(1), 55-71.
Cunningham, M. and Gaeth, G. (1989), ‘Using Importance-Performance Analysis to Assess Parents' Decisions to Seek Care in a Dental School Clinic’, Journal of Dental Education, 53(10), 584-596.
Dolinsky, A. (1991), ‘Considering the Competition in Strategy Development: An Extension of Importance-Performance Analysis’, Journal of Health Care Marketing, 11(1), 31-36.
Go, F. and Zhang, W. (2008), ‘Applying importance-performance analysis to Beijing as an international meeting destination’, Journal of Travel Research, 35(1), 42-49.
Guadagnolo, F. (1985), ‘The importance-performance analysis: An evaluation and marketing tool’, Journal of Park and Recreation Administration,3 (2), 13-22.
Hawes, J. and Rao, C. (1985), ‘Using Importance-Performance Analysis to Develop Health Care Marketing Strategies’, Journal of Health Care Marketing, 5(4), 19-25.
Joseph, M. and Joseph, B. (1997), ‘'Employers' Perceptions os Service Quality in Higher Education’, Journal of Marketing for Higher Education, 8 (2), 1-13.
Kitcharoen, K. (2004), ‘The importance-performance analysis of service quality in administrative departments of private universities in Thailand’, ABAC Journal, 24(3), 20-46. Lynch, J., Carver, R. and Virgo, J. (1996), ‘Quadrant Analysis as a strategic planning technique in curriculum development and program marketing’, Journal of Marketing for Higher Education, 7(2), 17-32.
Martilla, J. and James, J. (1977), ‘Importance-Performance Analysis’, Journal of Marketing, 41(1), 77-79.
Matzler, K., Sauerwein, E. and Heischmidt, K. (2003), ‘Importance-performance analysis Revisited: the role of the factor structure of customer satisfaction’, The Service Industries Journal, 23(2), 112-129.
Pike, S. (2004)., ‘The Use of Repertory Grid Analysis and Importance-Performance Analysis to Identify Determinant Attributes of Universities’, Journal of Marketing for Higher Education, 14(2), 1-18.
Silva, F. and Fernandes, O. (2010). Using Importance-Performance Analysis in Evaluating of Higher Education: A Case Study. ICEMT 2010 International Conference on Education and Management Technology. IEEE. ISBN: 978-1-4244-8617-5, 121-123.