1(Trabalho 235-09). Recebido em: 14-10-2009. Aceito para publicação em: 21-05-2010.
2Researcher (D.Sc.) - Embrapa Semi-Árido, BR 428, Km 152, Zona Rural, CEP:56300-970, Petrolina-PE, C.P.: 23 e-mail: [email protected]
3Professor (D.Sc.) - Universidade Federal de Viçosa, Câmpus Universitário, Centro, CEP: 36570000 – Viçosa-MG, Brasil. e-mail: [email protected] , [email protected]
GENETIC DIVERSITY OF A BRAZILIAN WINE GRAPE
GERMPLASM COLLECTION BASED ON
MORPHOAGRONOMIC TRAITS
1PATRÍCIA COELHO DE SOUZA LEÃO2, COSME DAMIÃO CRUZ3,
SÉRGIO YOSHIMITSU MOTOIKE3
ABSTRACT - The objectives of this study were to evaluate the performance of cultivars, to quantify the variability and to estimate the genetic distances of 66 wine grape accessions in the Grape Germplasm Bank of the EMBRAPA Semi-Arid, in Juazeiro, BA, Brazil, through the characterization of discrete and con-tinuous phenotypic variables. Multivariate statistics, such as, principal components, Tocher’s optimization procedure, and the graphic of the distance, were efficient in grouping more similar genotypes, according to their phenotypic characteristics. There was no agreement in the formation of groups between continuous and discrete morpho-agronomic traits, when Tocher’s optimization procedure was used. Discrete variables allowed the separation of Vitis vinifera and hybrids in different groups. Significant positive correlations were observed between weight, length and width of bunches, and a negative correlation between titratable acidity and TSS/TTA. The major part (84.12%) of the total variation present in the original data was explained by the four principal components. The results revealed little variability between wine grape accessions in the Grape Germplasm Bank of Embrapa Semi-Arid.
Index terms: germplasm, grapevine, grape cultivars, Vitis spp., multivariate analysis.
DIVERSIDADE GENÉTICA DE UMA COLEÇÃO BRASILEIRA DE
UVAS PARA VINHO BASEADA EM CARACTERES MORFOAGRONÔMICOS
RESUMO - Os objetivos deste trabalho foram avaliar o comportamento agronômico, quantificar a va-riabilidade e estimar as distâncias genéticas de 66 acessos de videira destinadas à elaboração de vinhos, presente no Banco de Germoplasma de Videira da EMBRAPA Semiárido, em Juazeiro-BA, Brasil, por meio da caracterização de descritores fenotípicos de variação contínua e discreta. As técnicas multivariadas utilizadas, componentes principais, método de otimização de Tocher e projeção gráfica das distâncias foram eficientes no agrupamento dos genótipos mais similares, de acordo com as suas características fenotípicas. Não houve concordância na formação dos grupos pelo método de otimização de Tocher, quando foram ava-liadas características morfoagronômicas de variação contínua e discreta. A utilização de variáveis discretas permitiu a separação de Vitis vinifera e híbridos em grupos distintos. Correlações significativas positivas foram observadas entre peso, comprimento e largura de cachos, bem como correlação negativa entre acidez total titulável e relação SST/ATT. 84,12% da variação total presente nos dados originais foram explicados pelos primeiros quatro componentes principais. Os resultados obtidos demonstram que existe pequena va-riabilidade entre os acessos de uvas para vinho no Banco de Germoplasma da Embrapa Semiárido.
1165
INTRODUCTION
The wine industry in São Francisco River Valley had a great evolution in the recent years, there are now seven wineries installed and the planted area is greater than 800 ha, which produced in 2007, eight million liters of wine, representing 20% of the national production (SEBRAE, 2007).
The tropical wines known as sun wine are characterized by young wines, fruity and aromatic, which quality is recognized in international compe-titions and in the most traditional and demanding markets.
The grape industry in this region has evolved into a narrow genetic base, as there are few cultivars of a single species, Vitis vinifera L.. It is worrying from the point of view of sustainability of the grape and wine industry because they are con-stantly subjected to a high risk of introducing diseases and pests, for which these cultivars are susceptible, resulting in large losses or even in the destruction of vineyards.
The multivariate techniques in the analysis of quantitative and qualitative characteristics have been applied in viticulture in the evaluation of the diversity of genotypes for resistance to diseases (NASCIMENTO et al., 2006) and for morphological, agronomic and biochemical descriptors (MICHELI et al., 1993; CRAVERO et al., 1994, MATHEOU et al., 1995a, 1995b; BOSELLI et al., 2000; COELHO et al., 2004; BORGES et al., 2008). The molecular characterization of 81% of the accessions of the Embrapa Semi Arid grapevine germplasma bank was performed by Leão et al. (2009), using seven micro-satellite markers. The allelic profiles were compared with international databases, allowing the identifica-tion of many duplicate accessions, synonyms and name errors, generating a robust database for grape cultivars identification. Borges et al. (2008) analyzed a group of table grapes cultivars of the same germ-plasma bank by principal components and UPGMA.
The objectives of the present work were to evaluate the performance of cultivars, to quantify variability and to estimate their genetic distances, providing subsidies to guide rational management of the Germplasm Bank of Embrapa Semi-Arid and the cultivars use in grape breeding programs
MATERIAL AND METHODS
Sixty six wine grape accessions from the Grape Germplasm Bank of Embrapa Semi-Arid were evaluated (Table 1) in the Experimental Field Station of Mandacaru, Juazeiro, State of Bahia, with geographical coordinate, 9o24’S, 40o26’W,
and 365.5m (altitude). The climate is classified according to Koeppen, as Bswh, which corre-sponds to the semi-arid hot, with average annual precipitation of 505 mm, annual average relative humidity of 60.7%, annual average temperature, maximum, and minimum, respectively 26.7oC,
32.0oC, and 20.8oC (www.cpatsa.embrapa.br/
servicos/dadosmet/cem-anual.html).
The plants were trained in multi-wire verti-cal trellis and pruned in bilateral cordon. The water was supplied by drip irrigation spaced of 3 x 2m. Average data were obtained from four plants of each accession during the period from 2002 to 2007, which corresponded to four cycles.
Nine morpho-agronomic descriptors of continuous variation and six morpho-agronomic descriptors of discrete variation according to the Ipgri (1997) were evaluated: 1) duration of the phenologi-cal cycle (D), measured from the date of pruning to harvest (days), 2) production of bunches per plant (P) - weight of all bunches per plant (kg), 3) number of bunches per plant (BP); 4) mean bunches weight (BW) - total weight of all bunches divided by the total number of bunches per plant (g), 5) bunches length (BL), measured between the top and bottom of the rachis (cm) 6) width of the bunches (WB), measured between both extremity side of the rachis (cm), 7) total soluble solids (TSS), determined from a sample of ten berries per bunch in oBrix; 8)
titrat-able acidity (TTA), determined from a sample of ten berries per bunch in percentage of tartaric acid /100 mL of juice; 9) the total soluble solids (TSS)/total titratable acidity (TTA). Five discrete characteristics were also evaluated: 1) consistency of the pulp: crisp, fleshy, muscilaginous, or juicy; 2) Taste: neutral, special, muscat or foxy; 3) Format of the bunches: cylindrical, cylindrical winged or cone; 4) Format of the berries: ovoid, globose or elliptical; 5) Color: Black, red, green or green-yellow.
procedure. Diversity was also analyzed using the method of principal components. The relative im-portance of characters, used in the discrimination of clusters, was assessed at the discretion of the weight variables in eigenvectors. The eigenvectors and ei-genvalues were obtained from the correlation matrix of standardized data of original values. The variables with higher weights were considered of minor impor-tance, since the last eigenvector was associated with an eigenvalue greater than 0.70 (CRUZet al., 2004).
RESULTS AND DISCUSSION
Morphoagronomic traits of continuous variables
The means of each cultivar and, average, maximum and minimum per group, according to the method of Tocher, for nine morpho-agronomic traits studied are shown in Table 2. Cluster analysis using the Tocher’s optimization procedure allowed the formation of 12 groups (Table 3). Group 1 was composed by 41 accessions (62%), showing a small variability between wine grape cultivars in the Grape Germplasm Bank. Very different cultivars based on aspects such as genealogy, geographic origin and enological potential, were included in this group. Ninety percent of cultivars are Vitis vinifera L., however, interspecific hybrids, such as ‘Mars’ and ‘Tampa’ of the University of Arkanzas and ‘Moscato Embrapa’ and ‘BRS Rubea’ developed by Embrapa Uva e Vinho, belonged to the same group. Boseli et al. (2000) evaluated 11 cultivars of white wine grapes in the region of the Campaign in Italy, through clustering analysis and principal components based on 29 leaf measures. They observed the formation of four groups, in the group composed by the cultivars ‘Asprinio’, ‘Falanghina di Benevento’ and ‘Greco di Tufo’ there were significant differences in the wine characteristics, but the cultivars were similar in leaf morphology, suggesting a common phylogenetic origin.
The maximum distance (d = 3.07) was observed between ‘Müller Thurgau’ (group 5) and ‘Barbera’ (group 1), while the minimum (d = 0.24) was obtained between ‘Regner’ and ‘Romania’, both in group 1. The selection of parents for hibridization in a breeding program should consider not only the genetic divergence among accessions, but also their agronomic performance and characteristics.
The group 12, represented by ‘BRS Lorena’, had the longer phenological cycle, 138 days, while ‘Siegerrebe’ in group 9, was the earliest cultivar, harvested 87 days after pruning. Group 4 stood out for its higher average production per plant and group
5 for presenting larger bunches (weight, length and width), and soluble solids content (TSS). ‘Pedro Ximenez’ in group 11 and ‘Campanario’ in group 7 showed respectively the highest and lowest value for total acidity. On the other hand, the best TSS / TTA ratio was observed in group 4.
The principal component analysis showed that four components are necessary to explain 84.12% of the total variation and was used to plot the accessions in the three-dimensional space (Figure 1). The principal component 1 explained 36.67% of the total variance, associated with bunches size characteristics (weight, length and width). The com-ponent 2, representing 18.66% of the variance, was associated with the chemical characteristics of the grape (TSS/TTA, TTA and TSS). The component 3, explaining 15.99% of the variance was correlated with the yield (number of bunches and yield per plant). Finally, the main component 4, explaining 12.79% of the total variance was correlated with the bunches maturation, because the highest scores were obtained for the duration of the phenological cycle, TSS/TTA, TTA and TSS. Fatahi et al. (2004) analyzed 90 grape varieties using principal com-ponents found that seven comcom-ponents were needed to explain 81% of the total variance, with the first factor was related to the berry characteristics and the second factor was associated with bunches characteristics. Looking at Table 4, it is possible to identify the variables of greatest weight in the last eigenvectors. However, the highest score in the last eigenvector was higher than 0.70, associated with the characteristic bunches weight, indicating that no trait can be discarded. Borges et al. (2008) obtained eight groups of seeded grape cultivars and one group of seedless grape cultivars by principal componentes in the same germplasm collection. They observed an agreement between the most divergent accessions of seeded and seedless table grapes cultivars by two multivariate methods: principal components and the mean Euclidean distance.
Table 5 showed the existence of positive and significant correlation between different mor-pho-agronomic traits; however the Pearson’s cor-relation coefficients were very low. The corcor-relation between yield per plant and total acidity was high and positive (r = 0.88), indicating that the higher the yield, the greater the acidity of the berry. Fatahi et al. (2004) obtained a negative correlation between yield per plant and content of soluble solids.
bet-1167 between accessions of the specie Vitis vinifera and hybrids, which was not observed in the evaluation of continuous variation traits. According to Martinello et al. (2002), this occurs mainly because the quality characteristics are controlled by few genes and thus are little affected by the environment.
The results of multivariate analysis showed little variation among accessions of wine grape in the Germplasm Bank of Embrapa Semiarid. This can be explained because that collection was composed mainly by classic and traditional cultivars in the international wine market. According to This et al. (2006), there was a significant reduction in genetic diversity of grapevines in the last 50 years as a consequence of the globalization of wine companies and markets, which limited the cultivars to a small number, leading to the disappearance of old local varieties or landraces.
ter differentiation of the groups, but also to provide a more complete set of information for the selection of parents based on their phenotypic characteristics.
Morpho-agronomic traits of discrete variables
Cluster analysis by the Tocher’s optimization procedure based on five discrete variables resulted in the formation of 8 groups (Table 6). Forty-eight accessions (72.7%) were concentrated in group 1, which included the main wine grape cultivars of the Sub Middle São Francisco River basin, such as, ‘Cabernet Sauvignon’, ‘Syrah’, ‘Chenin Blanc’, ‘Tannat’, ‘Ruby Cabernet’, among others. Although the groups based on discrete variables are different from those based on quantitative variables, there was a coincidence of 69% of accessions in group 1. The group 1 was composed exclusively by cultivars of Vitis vinifera, the hybrids are all separated into distinct groups. The clustering based on morpho-agronomic discrete variables allowed the separation
TABLE 1 - Wine grape cultivars, origin and specie evaluated in this work.
Acessions Number Origin Specie Pedigree
Altesse 1 V. vinifera France
Ancellotta 2 V. vinifera Italy
Aramon 3 V. vinifera France
Baco Blanc 4 V. vinifera France Folle Blanche X Noah
Barbera 5 V. vinifera Italy
Bordô 6 Hybrid USA (Isabella x Labrusca) X O.P.
BRS Lorena 7 Hybrid Brazil Malvasia Bianca X Seival
BRS Rubea 8 Hybrid Brazil Niagara Rosada X Bordo
Burger 9 V. vinifera Germain Heunisch x (Vitis sylvestris x Traminer) Cabernet Sauvignon 10 V. vinifera France Cabernet Franc X Sauvignon Blanc1
Campanário 11 V. vinifera Portugal Camarate Preto X Fernao Pires
Carignane 12 V. vinifera France
Castelão 13 V. vinifera Portugal
Chasselas Doré 14 V. vinifera France
Chenin Blanc 15 V. vinifera France
Cinsaut 16 V. vinifera France
Colombard 17 V. vinifera France Heunisch Weiss X Chenin Blanc
Feher Szagos 18 V. vinifera Hungary
Flora 19 V. vinifera USA Semillon X Traminer
Gamay 20 V. vinifera France Pinot x Heunisch Weiss
Gamay Beaujolais 21 V. vinifera France
Gewurztraminer 22 V. vinifera Germain
Grand Noir 23 V. vinifera France Aramon X Petit Bouschet
Grenache 24 V. vinifera Spain
Acessions Number Origin Specie Pedigree
Lassif 25 ? ?
Malvasia Branca 26 V. vinifera Portugal Malvasia Chartrense 27 V. vinifera ? Malvasia di Lipari 28 V. vinifera Italy
Mars 29 Hybrid USA Island belle X A1339
Moscato Embrapa 30 Hybrid Brazil Couderc 13 X July Muscat
Moscato di Canelli 31 V. vinifera Italy Muscat de Alexandria X ?
Mouverdre 32 V. vinifera Spain
Muller Thurgau 33 V. vinifera Switzerland
Olivette Noire 34 V. vinifera France
Palomino 35 V. vinifera Spain
Pedro Ximenez 36 V. vinifera Spain
Periquita 37 V. vinifera Portugal
Petit Syrah FR 38 V. vinifera France Dureza de Ardeche X Mondeuse Blanche Petit Syrah RS 39 V. vinifera France Dureza de Ardeche X Mondeuse Blanche
Petit Verdot 40 V. vinifera France
Peverella 41 V. vinifera Italy
Red Vletliner 42 V. vinifera ?
Regner 43 V. vinifera German Luglienca Bianca X Gamay Precoce
Riesling do Reno 44 V. vinifera German
Riesling Itálico 45 V. vinifera France
Riesling Renano 46 V. vinifera German
Royalty 47 V. vinifera USA Alicante Ganzen X Trousseau
România 48 ? ?
Ruby Cabernet 49 V. vinifera USA Cabernet Sauvignon X Carignan
Sangiovese 50 V. vinifera Italy
Sauvignon Blanc 51 V. vinifera France Traminer X ?
Seara Nova 52 V. vinifera Portugal Diagalves X Fernao Pires
Semillon 53 V. vinifera France
Siegerrebe 54 V. vinifera German Madeleine Angevine x Traminer Rot
Souzão 55 V. vinifera Portugal
Sylvaner 56 V. vinifera Austria Oesterreichisch Weiss x Traminer
Tampa 57 Hybrid USA Vitis smalliana O.P. X Niagara
Tannat 58 V. vinifera France
Tempranillo 59 V. vinifera Spain
Tibouren 60 V. vinifera France
Tinta Roriz 61 V. vinifera Spain
Tocai Friulano 62 V. vinifera Italy
Riparia do Traviu 63 V. riparia Brazil Trebbiano Toscano 64 V. vinifera Italy
Ugni Blanc 65 V. vinifera Italy
Verdea 66 V. vinifera France/Italy
1169
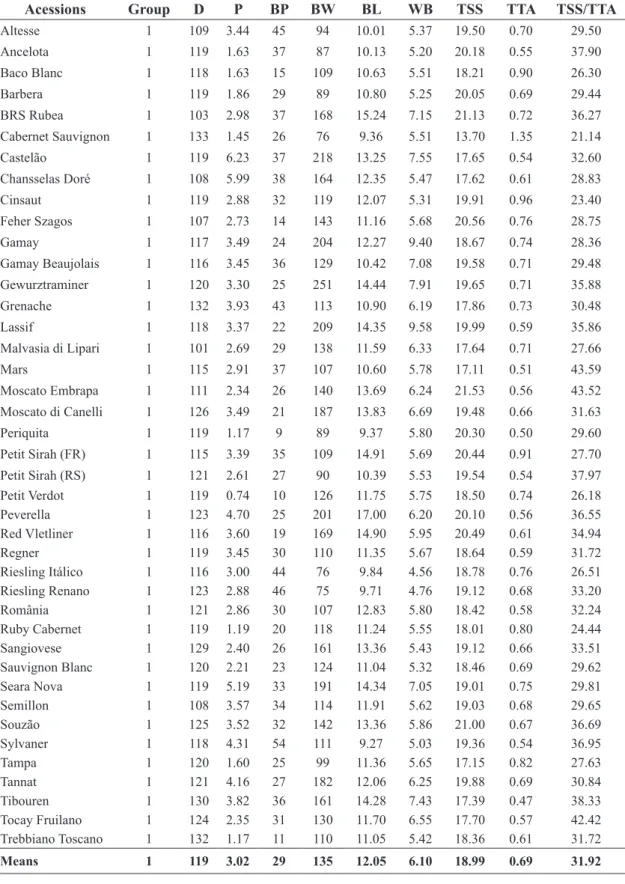
TABLE 2 - Means of 66 wine grape cultivars, according to the Tocher cluster analysis, considering nine characters of continuous variation.
Acessions Group D P BP BW BL WB TSS TTA TSS/TTA
Altesse 1 109 3.44 45 94 10.01 5.37 19.50 0.70 29.50
Ancelota 1 119 1.63 37 87 10.13 5.20 20.18 0.55 37.90
Baco Blanc 1 118 1.63 15 109 10.63 5.51 18.21 0.90 26.30
Barbera 1 119 1.86 29 89 10.80 5.25 20.05 0.69 29.44
BRS Rubea 1 103 2.98 37 168 15.24 7.15 21.13 0.72 36.27
Cabernet Sauvignon 1 133 1.45 26 76 9.36 5.51 13.70 1.35 21.14
Castelão 1 119 6.23 37 218 13.25 7.55 17.65 0.54 32.60
Chansselas Doré 1 108 5.99 38 164 12.35 5.47 17.62 0.61 28.83
Cinsaut 1 119 2.88 32 119 12.07 5.31 19.91 0.96 23.40
Feher Szagos 1 107 2.73 14 143 11.16 5.68 20.56 0.76 28.75
Gamay 1 117 3.49 24 204 12.27 9.40 18.67 0.74 28.36
Gamay Beaujolais 1 116 3.45 36 129 10.42 7.08 19.58 0.71 29.48
Gewurztraminer 1 120 3.30 25 251 14.44 7.91 19.65 0.71 35.88
Grenache 1 132 3.93 43 113 10.90 6.19 17.86 0.73 30.48
Lassif 1 118 3.37 22 209 14.35 9.58 19.99 0.59 35.86
Malvasia di Lipari 1 101 2.69 29 138 11.59 6.33 17.64 0.71 27.66
Mars 1 115 2.91 37 107 10.60 5.78 17.11 0.51 43.59
Moscato Embrapa 1 111 2.34 26 140 13.69 6.24 21.53 0.56 43.52
Moscato di Canelli 1 126 3.49 21 187 13.83 6.69 19.48 0.66 31.63
Periquita 1 119 1.17 9 89 9.37 5.80 20.30 0.50 29.60
Petit Sirah (FR) 1 115 3.39 35 109 14.91 5.69 20.44 0.91 27.70
Petit Sirah (RS) 1 121 2.61 27 90 10.39 5.53 19.54 0.54 37.97
Petit Verdot 1 119 0.74 10 126 11.75 5.75 18.50 0.74 26.18
Peverella 1 123 4.70 25 201 17.00 6.20 20.10 0.56 36.55
Red Vletliner 1 116 3.60 19 169 14.90 5.95 20.49 0.61 34.94
Regner 1 119 3.45 30 110 11.35 5.67 18.64 0.59 31.72
Riesling Itálico 1 116 3.00 44 76 9.84 4.56 18.78 0.76 26.51
Riesling Renano 1 123 2.88 46 75 9.71 4.76 19.12 0.68 33.20
România 1 121 2.86 30 107 12.83 5.80 18.42 0.58 32.24
Ruby Cabernet 1 119 1.19 20 118 11.24 5.55 18.01 0.80 24.44
Sangiovese 1 129 2.40 26 161 13.36 5.43 19.12 0.66 33.51
Sauvignon Blanc 1 120 2.21 23 124 11.04 5.32 18.46 0.69 29.62
Seara Nova 1 119 5.19 33 191 14.34 7.05 19.01 0.75 29.81
Semillon 1 108 3.57 34 114 11.91 5.62 19.03 0.68 29.65
Souzão 1 125 3.52 32 142 13.36 5.86 21.00 0.67 36.69
Sylvaner 1 118 4.31 54 111 9.27 5.03 19.36 0.54 36.95
Tampa 1 120 1.60 25 99 11.36 5.65 17.15 0.82 27.63
Tannat 1 121 4.16 27 182 12.06 6.25 19.88 0.69 30.84
Tibouren 1 130 3.82 36 161 14.28 7.43 17.39 0.47 38.33
Tocay Fruilano 1 124 2.35 31 130 11.70 6.55 17.70 0.57 42.42
Trebbiano Toscano 1 132 1.17 11 110 11.05 5.42 18.36 0.61 31.72
Means 1 119 3.02 29 135 12.05 6.10 18.99 0.69 31.92
Continued
Acessions Group D P BP BW BL WB TSS TTA TSS/TTA
Aramon 2 136 3.95 24 225 16.19 8.34 16.93 0.58 30.38
Burguer 2 130 5.45 26 269 17.23 7.32 16.74 0.71 25.26
Carignane 2 133 5.71 41 212 14.02 6.99 17.38 0.68 25.80
Chenin Blanc 2 132 6.37 35 265 14.44 6.96 18.05 0.85 26.24
Colombard 2 119 5.39 51 194 14.70 8.88 17.38 0.59 29.92
Grand Noir 2 129 5.17 33 228 15.06 7.82 19.33 0.55 41.73
Malvasia Bianca 2 136 4.12 14 365 16.63 8.45 17.43 0.51 34.36
Malvasia Chartrense 2 126 2.84 16 220 16.83 8.79 18.38 0.47 39.96
Mouverdre 2 126 5.24 21 300 15.74 8.89 16.53 0.47 37.73
Ugni Blanc 2 131 6.55 24 240 16.76 7.32 18.91 0.53 36.67
Verdea 2 133 3.55 22 206 16.57 6.61 20.03 0.75 42.26
Means 2 130 4.94 28 247 15.83 7.85 17.91 0.61 33.67
Bordô 3 110 0.72 4 39 7.23 3.67 19.00 0.82 24.05
Tempranillo 3 119 1.20 16 83 9.08 5.15 21.00 0.92 24.04
Means 3 115 0.96 10 61 8.15 4.41 20.00 0.87 24.04
Flora 4 122 6.11 40 180 12.88 5.77 21.09 0.53 40.72
Tinta Roriz 4 119 4.74 36 126 13.97 8.37 21.73 0.44 51.11
Means 4 120 5.43 38 153 13.43 7.07 21.41 0.49 45.92
Muller Thurgau 5 133 2.79 8 421 19.06 10.92 18.01 0.49 37.22
Palomino 5 118 4.85 22 340 19.01 11.30 17.04 0.73 27.87
Means 5 125 3.82 15 380 19.03 11.11 17.53 0.61 32.54
Olivette Noire 6 106 4.22 16 190 16.99 8.44 16.89 0.66 30.57
Riparia do Traviu 6 110 5.27 47 130 14.32 10.57 18.69 0.53 30.09
Means 6 108 4.74 32 160 15.66 9.51 17.79 0.60 30.33
Campanário 7 131 4.98 46 174 12.04 6.91 15.73 0.44 36.30
Riesling do Reno 8 127 0.47 8 126 9.30 6.85 16.50 0.67 24.82
Siegerrebe 9 87 0.53 6 174 13.85 8.90 21.38 0.48 44.25
Roialty 10 120 0.92 9 76 9.20 4.67 20.13 0.51 42.40
Pedro Ximenez 11 114 0.54 3 158 11.03 9.00 18.13 1.11 16.3
BRS Lorena 12 138 0.99 9 97 9.03 5.81 17.82 0.89 43.42
D: Duration of cycle (days between pruning and harvesting); P: yield per plant (Kg); BP: number of bunches per plant; BW: Bunch weight (g); BL: Bunch Length (cm); WB: Bunch Width (cm), TSS: total soluble solids (oBrix); TTA: total titratable acidity (% TA); TSS / TTA: Relationship oBrix/titratable acidity.
TABLE 3 - Grouping according to Tocher’s optimization procedure, considering nine continuous variation traits evaluated in 66 wine grape accessions.
Groups Acessions
1 43 48 51 5 39 50 58 31 21 53 55 42 2 46 1 45 24 52 62 57 49 18 40 4 28 64 10 16 38 22 20 37 14 29 56 41 60 25 8 30 13 2 23 65 66 27 3 32 26 9 12 15 17
3 6 59
4 19 61
5 33 35
6 34 63
7 11
8 44
9 54
10 47
11 36
1171
TABLE 4 - Estimates of eigenvalues (λ) and eigenvectors associated with the principal components in 66 wine grape accessions and nine morphological and agronomic traits of continuous variation. Bold values highlight the characteristic of greater weight in their eigenvector.
Traits PC 1 PC 2 PC 3 PC 4 PC 5 PC 6 PC 7 PC 8 PC 9
D 0.1824 0.2369 0.2815 0.6143 -0.5659 0.2 0.272 0.0978 0.1011
P 0.3981 -0.1157 0.4204 -0.2958 -0.148 -0.3069 0.0044 -0.5069 0.4368
BP 0.0921 -0.3604 0.6411 -0.2829 0.014 0.3816 0.0045 0.2999 -0.3672
BW 0.4842 0.2497 -0.1483 -0.06 -0.1081 -0.1837 0.0312 -0.2665 -0.7484 BL 0.4839 0.0986 -0.1712 -0.1884 -0.1776 -0.1874 -0.35970.6709 0.2127
WB 0.425 0.1817 -0.2561 -0.1762 0.3024 0.6606 0.3077 -0.095 0.2413
TSS -0.1064 -0.4378 -0.407 -0.3423-0.5831 0.0231 0.4157 0.0221 -0.0189
TTA -0.301 0.4484 0.028 -0.361 -0.42 0.3669 -0.473 -0.2061 -0.0026
TSS/TTA 0.2206 -0.5503 -0.2229 0.3709 -0.0811 0.2824 -0.5517-0.2653 -0.0126
λ 3.30 1.68 1.44 1.15 0.68 0.30 0.21 0.14 0.10
λ (%)
accumulated 36.67 55.34 71.34 84.12 91.69 94.98 97.27 98.86 10
TABLE 5 - Pearson’s correlation coefficients obtained among nine traits, of continuous variation, in 66 wine grape accessions from the Grape Germplasm Bank of EMBRAPA Semi Arid.
Traits D P BP BW BL WB TSS TTA P 0.19ns
BP 0.03ns 0.56**
BW 0.31* 0.53** -0.21ns
BL 0.18ns 0.57** -0.12ns 0.84**
WB 0.06ns 0.41** -0.12ns 0.76** 0.74**
TSS -0.2ns 0.07ns -0.05ns 0.20ns 0.26* 0.27*
TTA 0.005ns -0.34** -0.20ns -0.29* -0.33** -0.36** -0.07ns
TSS/TTA 0.07ns 0.15ns 0.18ns 0.13ns 0.24* 0.20ns 0.07ns -0.68**
(**) e (*) significant at 1 and 5% of probability, respectively, by the t test.
TABLE 6 - Grouping according to Tocher’s optimization procedure, based on five discrete variables eva-luated in 66 wine grape accessions.
Groups Acessions
1 1 14 17 22 41 53 62 2 5 10 11 12 38 39 40 49 50 58 3 42 43 44 45 52 16 20 21 23 24 32 47 4 18 25 46 51 56 64 65 66 9 15 60 28 35 36 19 61
2 6 29 57 63 55
3 13 34 37 59
4 26 30 31 33
5 27 54
6 8
7 7
CONCLUSIONS
1- The multivariate statistics to study genetic diversity applied to continuous variable traits (Tocher’s optimization procedure and principal components) were consistent with each other.
2- There was no correlation between the formation of the groups using continuous and discrete variables.
3-There is little genetic variability between wine grape accessions in the Grape Germplasm Bank of Embrapa Semi-Arid.
4- Cluster analysis based on morpho-agronomic traits resulted in the separation of accessions according to common phenotypic traits.
REFERENCES
BORGES, R. M. E.; GONÇALVES, N. P. S.; GOMES, A. P. O.; ALVES E. O. S. Divergência fenotípica entre acessos de uvas de mesa no Semi-Árido brasileiro. Pesquisa Agropecuária Brasileira,
Brasília, v.43, n.8, p.1025-1030, 2008.
BOSELLI, M.; CORSO, C.; MONACO, A. Am-plographic characterization of white grape varieties in Campania (Southern Italy) by multivariate analysis.
Acta Horticulturae, Wageninge, n. 528, p. 75-81, 2000.
COELHO, I.; CUNHA, J.; CUNHA, J. P.; CARNEI-RO, L. C.; CASTCARNEI-RO, R.; EIRA DIAS, J. E. Com-paração ampelométrica de populações selvagens de Vitis vinifera e de castas antigas do sul de Portugal.
Ciência e Técnica Vitivinícola, Dois Portos, v. 19, n. 1, p. 1-12, 2004.
CRAVERO, M. C.; GUIDONI, S.; SCHNEIDER, A.; STEFANO, R. di. Morphological and biochemical characterisation of coloured berry-muscat grapevine cultivars. Vitis, Siebeldingen, v.33, n.2, p. 75-80, 1994.
CRUZ, C. D.; REGAZZI, A. J.; CARNEIRO, P. C. de S. Modelos biométricos aplicados ao melhoramen-to genético. 3. ed. Viçosa: UFV, 2004. v. 1, 480 p. CRUZ, C. D. Programa genes: diversidade genética. Viçosa: Editora Viçosa, 2008.
FATAHI, R.; EBADI, A.; VEZVAEI, A.; ZAMANI, Z.; GHANADHA, M. R. Relationship among quanti-tative and qualiquanti-tative characters in 90 grapevine (vitis vinifera) cultivars. Acta Horticulturae, Leuven, n. 640, p. 275-282, 2004.
IPGRI - International Plant Genetic Resources Insti-tute. Descriptors for grapevine: Vitis spp. Roma, 1997. 62 p.
LEÃO, P. C. de S.; RIAZ, S.; GRAZIANI, R.; DANGL, G. S.; MOTOIKE, S. Y.; WALKER, M. A.Characterization of a Brazilian grape germplasm collection using microsatellite markers. American Journal of Enology and Viticulture, Davis, v.60, n.4, p.517-524. 2009.
MARTINELLO, G. E.; LEAL, N. R.; AMARAL JÚNIOR, A. T.; PEREIRA, M. G.; DAHER, R. F. Divergência genética em acessos de quiabeiro com base em marcadores morfológicos. Horticultura Brasileira, Brasília, v.20, n.1, p.52–58, 2002.
MATHEOU, A.; STAVROPOULOS, N.; SAMA-RAS, S. Studies on table grape germplasm grown in Northern Greece. I. Maturity time, bunch char-I. Maturity time, bunch char-acteristics and yield. Vitis, Sibeldingen, v.34, n.3, p.155-158, 1995a.
MATHEOU, A.; STAVROPOULOS, N.; SAMA-RAS, S. Studies on table grape germplasm grown in Northern Greece. II. Seedlessness, berry and must characteristics. Vitis, Sibeldingen, v.34, n.4, p.217-220, 1995b.
MICHELI, L. de; CAMPOSTRINI, F.; IACONO, F.; STEFANINI, M. Evaluation of genetic divergence among clones by means of phyllometric techniques.
Vignevine, Bologna, v.20, n.12, p.64-69, 1993.
NASCIMENTO, A. R. P.; MICHEREFF, S. J.; MARIANO, R. de L. R.; VIANA, I. de O. Reação de clones de videira a Xanthomonas campestris pv. viticola, baseada nos componentes epidemiológicos do cancro bacteriano. Ciência Rural, Santa Maria, v.36, n.1, p.1-7, 2006.
SEBRAE. Vinhos brasileiros: o mundo degusta o Brasil. Porto Alegre, 2007. 44p.
THIS, P.; LACOMBE, T.; THOMAS, M.R. His-torical origins and genetic diversity of wine grapes.