by SSR and EST-SSR markers
Bruno Mello Mulato(1), Milene Möller(1), Maria Imaculada Zucchi(2), Vera Quecini(3) and José Baldin Pinheiro(1)
(1)Universidade de São Paulo, Escola Superior de Agricultura Luiz de Queiroz, Departamento de Genética, Caixa Postal 83, CEP 13400-970 Piracicaba, SP, Brazil. E-mail: [email protected], [email protected], [email protected](2)Agência Paulista de Tecnologia dos Agronegócios, Pólo APTA Regional Centro Sul, Rodovia SP127, Km 30, Caixa Postal 28, CEP 13400-970 Piracicaba, SP, Brazil. E-mail: [email protected] (3)Embrapa Uva e Vinho, Caixa Postal 130, CEP 95700-000 Bento Gonçalves, RS, Brazil. E-mail: [email protected]
Abstract – The objectives of this work were to investigate the genetic variation in 79 soybean (Glycine max) accessions from different regions of the world, to cluster the accessions based on their similarity, and to test the correlation between the two types of markers used. Simple sequence repeat markers present in genomic (SSR) and in expressed regions (EST-SSR) were used. Thirty SSR primer-pairs were selected (20 genomic and 10 EST-SSR) based on their distribution on the 20 genetic linkage groups of soybean, on their trinucleotide repetition unit and on their polymorphism information content. All analyzed loci were polymorphic, and 259 alleles were found. The number of alleles per locus varied from 2–21, with an average of 8.63. The accessions exhibit a significant number of rare alleles, with genotypes 19, 35, 63 and 65 carrying the greater number of exclusive alleles. Accessions 75 and 79 were the most similar and accessions 31 and 35, and 40 and 78, were the most divergent ones. A low correlation between SSR and EST-SSR data was observed, thus genomic and expressed microsatellite markers are required for an appropriate analysis of genetic diversity in soybean. The genetic diversity observed was high and allowed the formation of five groups and several subgroups. A moderate relationship between genetic divergence and geographic origin of accessions was observed.
Index terms: Glycine max, molecular marker, plant breeding, plant germplasm, polymorphism information content.
Diversidade genética em germoplasma de soja identificada
por marcadores SSR e EST-SSR
Resumo – Os objetivos deste trabalho foram avaliar a diversidade genética de 79 acessos de soja de diferentes regiões do mundo, agrupá-los de acordo com a similaridade e testar a correlação entre os dois tipos de marcadores utilizados. Foram utilizados marcadores microssatélites genômicos (SSR) e funcionais (EST-SSR). Trinta pares de primers SSR foram selecionados (20 genômicos e 10 EST-SSR) de acordo com sua distribuição nos 20 grupos de ligação da soja, com sua unidade de repetição trinucleotídica e com seu conteúdo de informação polimórfica. Todos os lócus analisados foram polimórficos, e 259 alelos foram encontrados. O número de alelos por lócus variou entre 2–21, com média de 8,63. Os acessos possuem uma quantidade significativa de alelos raros, sendo os acessos 19, 35, 63 e 65 os que apresentaram maior número de alelos exclusivos. Os acessos 75 e 79 são os mais similares e os acessos 31 e 35, e 40 e 78 são os mais divergentes. Foi observada baixa correlação entre resultados de SSR e EST-SSR. Portanto, uma análise adequada de diversidade em soja deve ser feita utilizando-se tanto marcadores microssatélites genômicos como funcionais. A diversidade genética dos acessos selecionados é alta, tendo sido encontrados cinco grupos e vários subgrupos. Observou-se moderada relação entre divergência genética e origem geográfica dos acessos.
Termos para indexação: Glycine max, marcadores moleculares, melhoramento de plantas, germoplasma vegetal, conteúdo de informação polimórfica.
Introduction
The perception that current soybean cultivars are extremely uniform is corroborated by various studies based on inbreeding coefficientanalysis and studies assessing the
Genetic diversity in soybean germplasm 277
Pesq. agropec. bras., Brasília, v.45, n.3, p.276-283, mar. 2010 The narrow genetic base is a major constraint in breeding
programs, due to the lack of genetic variability, cultivar susceptibility to pathogens and herbivores, and reaching of yield plateaus (Martin, 2000; Fu, 2006).
Introducing novel germplasm sources in breeding programs, such as plant introductions (PIs), may provide the necessary genetic variability for the continuous development and adaptation of cultivars to biotic and abiotic factors. Therefore, plant germplasm is a natural source to broaden the current soybean genetic base (Chung & Singh, 2008). The potential of soybean breeding is enormous, since, currently, a small fraction of the existing accessions in germplasm collections contribute to the genetic base of the present cultivars.
The expansion of soybean genetic base may lead to the introduction of new favorable alleles to polygenic traits (Brown-Guedira et al., 2000; Guzman et al., 2007). Considering the great amount of genes hypothesized to be involved in the control of agronomic characteristics, it is unlikely that modern cultivars have concentrated the best alleles corresponding to all loci of economic interest. Undoubtedly, several favorable alleles were lost through genetic bottlenecks during soybean domestication and introduction in producing regions. The choice of accessions to be incorporated in a breeding program must include those carrying and transmitting favorable rare alleles, absent from elite germplasm. Consequently, the knowledge of the sources for such alleles is invaluable. Accessions highly dissimilar to elite genotypes are likely to provide novel alleles to the traits of interest. The challenge is to select which accessions to use in breeding programs from the available germplasm.Therefore, the knowledge of the genetic variation within accessions from germplasm collections is essential to the choice of strategies to incorporate useful diversity into the program, to facilitate the introgression of genes of interest into commercial cultivars, to understand the evolutionary relations among accessions, to better sample germplasm diversity, and to increase conservation efficiency (Fu, 2003). Previous studies have used molecular markers to help the identification of genetic divergent accessions (Lee et al., 2008; Li et al., 2009). Microsatellite or simple sequence repeats (SSR) markers are considered useful to these approaches, due to their effectiveness in genealogy analysis and in the assessment of genetic diversity among organisms (Narvel et al., 2000; Kuroda et al., 2009). The use of functional molecular markers, such as those developed from expressed sequence tags (EST), allows direct access
to the population diversity in genes of agronomic interest, facilitating the association between genotype and phenotype.
The objectives of this work were to analyze the genetic diversity of 79 soybean accessions from distinct geographic regions of the world, cluster them into groups according to genetic similarity and to test the correlation between the two types of markers used.
Materials and Methods
Seventy-nine soybean accessions, obtained from Embrapa Soja germplasm bank, were selected according to their geographical origin to represent distinct geographical regions of the world. The selection was also based on variability groups, as defined in previous studies based on geographic distances or molecular analysis (Hymowitz & Kaizuma, 1981; Perry & McIntosh, 1991; Abe et al., 2003). The accessions were numbered from 1 to 79 (Table 1), corresponding to the identification of the accession throughout the work. Accession seeds were germinated and the seedlings were cultivated for DNA extraction in greenhouse, at the Departmento de Genética da Escola Superior de Agricultura Luiz de Queiroz (ESALQ/USP), in Piracicaba, São Paulo State, Brazil. Seedlings were grown in greenhouse conditions and pots were fertilized following the technical recommendations for soybean. Overhead irrigation was used to ensure the establishment of the seedlings, and the temperature was kept under 30°C.
Twenty days after the germination, plant DNA was extracted in bulk, from young fresh leaves of a group of five seedlings, using the CTAB method, as described by Doyle & Doyle (1990). Quality and concentration of DNA were determined by comparison to DNA standard markers using SYBRSafe staining (Invitrogen, Carlsbad, USA) on 1% (w/v) agarose gels. After quantification, DNA concentrations were adjusted to10 ηg µL-1.
candidate-B.M. Mulato et al.
.45, n.3, p.276-283, mar
. 2010
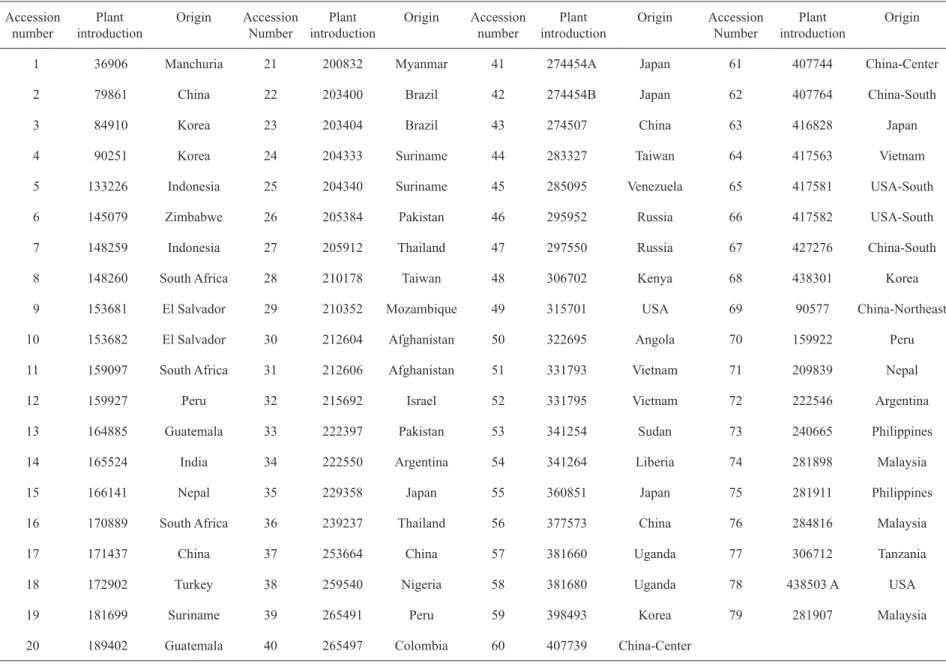
Table 1. Acession number, plant introduction code and geographic origin of the 79 soybean accessions investigated in the present study.
Accession number
Plant introduction
Origin Accession Number
Plant introduction
Origin Accession number
Plant introduction
Origin Accession Number
Plant introduction
Origin
1 36906 Manchuria 21 200832 Myanmar 41 274454A Japan 61 407744 China-Center
2 79861 China 22 203400 Brazil 42 274454B Japan 62 407764 China-South
3 84910 Korea 23 203404 Brazil 43 274507 China 63 416828 Japan
4 90251 Korea 24 204333 Suriname 44 283327 Taiwan 64 417563 Vietnam
5 133226 Indonesia 25 204340 Suriname 45 285095 Venezuela 65 417581 USA-South
6 145079 Zimbabwe 26 205384 Pakistan 46 295952 Russia 66 417582 USA-South
7 148259 Indonesia 27 205912 Thailand 47 297550 Russia 67 427276 China-South
8 148260 South Africa 28 210178 Taiwan 48 306702 Kenya 68 438301 Korea
9 153681 El Salvador 29 210352 Mozambique 49 315701 USA 69 90577 China-Northeast
10 153682 El Salvador 30 212604 Afghanistan 50 322695 Angola 70 159922 Peru
11 159097 South Africa 31 212606 Afghanistan 51 331793 Vietnam 71 209839 Nepal
12 159927 Peru 32 215692 Israel 52 331795 Vietnam 72 222546 Argentina
13 164885 Guatemala 33 222397 Pakistan 53 341254 Sudan 73 240665 Philippines
14 165524 India 34 222550 Argentina 54 341264 Liberia 74 281898 Malaysia
15 166141 Nepal 35 229358 Japan 55 360851 Japan 75 281911 Philippines
16 170889 South Africa 36 239237 Thailand 56 377573 China 76 284816 Malaysia
17 171437 China 37 253664 China 57 381660 Uganda 77 306712 Tanzania
Genetic diversity in soybean germplasm 279
Pesq. agropec. bras., Brasília, v.45, n.3, p.276-283, mar. 2010
Table 2. Genomic (the first 20 loci) and functional (the remaining 10 loci) microsatellite primers used to assess the genetic
diversity among 79 soybean accessions(1).
Locus LG GenBank Alleles (bp) AT (°C) Allele
number
PIC He Ho
Satt005 D1b - 140–180 50 13 0.817 0.834 0.013
Satt009 N - 172–270 50 16 0.883 0.892 0.025
Satt045 E - 132–160 54 12 0.834 0.851 0.013
Satt102 K - 146–174 55 4 0.520 0.595 0.130
Satt126 B2 - 121–151 48 3 0.527 0.601 0.038
Satt165 A1 - 280–320 48 6 0.364 0.386 0.025
Satt173 O - 206–288 48 17 0.862 0.874 0.038
Satt182 L - 206–226 48 5 0.476 0.522 0.038
Satt184 D1a - 138–187 48 8 0.770 0.798 0.038
Satt191 G - 212–258 48 10 0.764 0.790 0.038
Satt192 H - 204–280 48 11 0.873 0.884 0.025
Satt194 C1 - 240–288 48 10 0.772 0.797 0.051
Satt307 C2 - 150–190 48 11 0.756 0.784 0.025
Satt308 M - 142–198 48 10 0.804 0.823 0.000
Satt329 A2 - 237–271 50 12 0.862 0.875 0.025
Satt335 F - 156–186 48 6 0.559 0.611 0.025
Satt406 J - 248–325 47 9 0.761 0.784 0.038
Satt509 B1 - 187–266 51 9 0.360 0.373 0.013
Sat_001 D2 - 208–300 48 21 0.921 0.935 0.025
Sct_189 I - 160–200 48 11 0.789 0.814 0.038
SP179 D2 X07159 215–262 54 11 0.578 0.595 0.000
SOY176 F SOYHSP176 128–288 54 4 0.400 0.436 0.013
BE806 F BE806387 234–258 54 4 0.379 0.430 0.000
BF008 O BF008905 178–190 54 3 0.368 0.407 0.000
AW310 J AW310961 210–231 50 4 0.529 0.571 0.038
GYGY - X15122 171–252 52 14 0.704 0.729 0.000
PRP1 K SOYPRP1 134–160 54 8 0.748 0.780 0.000
AW620 B2 AW620774 201–210 50 3 0.311 0.351 0.025
AW508 L AW508247 201–204 50 2 0.314 0.390 0.000
PHYA1 - - 188–190 52 2 0.166 0.182 0.000
All 121–325 259 0.626 0.657 0.025
(1) LG, linkage group; AT, annealing temperature; PIC, polymorphism information content; He, expected heterozygosity; and H
genes involved in metabolic pathways and their association to important agronomic traits. Genomic SSRs are generally more polymorphic than SSR markers derived from EST (Song et al., 2004). Therefore, the used markers were combined attempting to better investigate the genetic diversity and, simultaneously, to search for candidate genes.
Amplifications through PCR were performed in a 15-μL final volume containing 20 ηg of template DNA, 0.2 μmol L-1 of each forward and reverse primers, 200 μmol L-1 of each dNTP, 1.5 mmol L-1 MgCl
2, 10 mmol L -1 Tris-HCl (pH 8.9), 50 mmol L-1 KCl and 1.5 U Taq DNA polymerase (Invitrogen, São Paulo, Brazil). Reactions were performed in a Bio-RAD thermocycler (MyCycler, Bio-RAD, USA) as follows: 94ºC for 2 min; followed by 32 cycles at 94ºC for 1 min; the annealing temperature specific for each primer pair (Table 2) for 1 min; extension at 72ºC for 1 min, followed by a final elongation step at 72ºC for 10 min. Amplification products were separated by electrophoresis on 7% (w/v) denaturing polyacrylamide gels, with 7 mol L-1 urea and 1X TBE, at constant power (70 Watts), for approximately 3–5 hours, run along with a 10-bp ladder as a size-standard, and silver-stained according to Creste et al. (2001). Amplified fragments displaying distinct sizes were considered to be different alleles.
Allelic and genotypic frequencies for each locus were calculated using the TFPGA software (Miller, 1997). The number of alleles per locus (A), expected heterozygosity (He) and observed heterozygosity (Ho) were estimated by GDA software (Lewis & Zaykin, 2000). A measure of allelic diversity at a given locus (PIC) was calculated for all 30 loci, according to the formula referred by Wang et al. (2008):
PICi = 1 - SPij2,
where Pij is the frequency of the j-th allele for the i-th marker.
To access the genetic relation of the accessions, dissimilarity matrices of Rogers-W were calculated and clustered using NTSYSpc software, version 2.2 (Rohlf, 2005) employing the unweighted pair-group method of the arithmetic average (UPGMA) to generate the dendrograms.
Genetic dissimilarity matrices obtained from genomic and EST-SSR data were compared to the measured
degree of relationship between them by computing the correlation (r) and the Mantel-test statistic (Z), with 1,000 permutations, using NTSYSpc software, version 2.2 (Rohlf, 2005). The comparison aimed to investigate the estimates of genetic dissimilarities generated by genomic and EST-SSR data.
Results and Discussion
All analyzed loci were polymorphic (Table 2). This result was expected due to the wide geographic distribution of the accessions. The primer-pairs used showed 259 alleles distributed throughout 30 loci. The number of alleles per locus ranged from 2 to 21, with an average of 8.63. Among the genomic SSR, the locus Sat_001 from the linkage group (LG) D2 had the highest number of alleles (21), whereas Satt126, from LG B2, presented the lowest number of alleles (3). Among the EST-SSR, locus GYGY had the highest number of alleles (14), whereas loci AW508 (LG L) and PHYA1 had only two different alleles. Similar results were found by Fu et al. (2007), when they analyzed Canadian soybean cultivars and exotic germplasm using SSR markers.
Allelic frequencies were calculated for each locus, and all investigated alleles exhibited a frequency higher than 1%, characterizing the polymorphism inside the population (Table 3). Only 14 alleles exhibited a frequency higher than 50%, in agreement with the previously observed great divergence between the accessions. The majority of the alleles exhibiting frequencies higher than 50% corresponded to EST-SSRs loci. The accessions displayed a high frequency of rare alleles: from the total of 259 alleles, 59 were exclusive,
n
j=1 Table 3. Allelic frequencies, allele distribution on
frequencies ranges and percentage of the total genetic pool for each range of the 79 soybean accessions.
Allelic frequency Allele number Percentage of total genetic pool
Exclusives 59 2.5
AF<5(1) 59 6.2
5<AF<10 49 10.5
10<AF<25 65 34.0
25<AF<50 13 14.5
AF>50 14 32.3
Total 259 100.0
Genetic diversity in soybean germplasm 281
Pesq. agropec. bras., Brasília, v.45, n.3, p.276-283, mar. 2010 present in a single genotype, and corresponding to
approximately 2.5% of the total genetic pool. For the alleles with frequency lower than 5%, the number increased up to 118, representing 8.7% of the total genetic pool. The accessions with the highest number of exclusive alleles were genotypes 19 and 63, each exhibiting exclusive alleles in three loci; accession 65, in four loci, and accession 35, in five loci (Table 4). The following accessions exhibited exclusive alleles in two loci: 2, 6, 10, 31, 37, 42, 49, 59, 71 and 78.
Hyten et al. (2006) concluded that, during soybean domestication, 50% of the genetic diversity and 81% of the rare alleles were lost, and that there were changes in 60% of allelic frequencies. Moreover, the introduction of a few accessions in producing countries might have caused losses of approximately 79% of the rare alleles previously found in domestic populations of soybean. A large significant number of rare alleles may contribute to soybean breeding, since they are absent from elite cultivars.
PIC values for the 30 used primers ranged from 0.166 at locus PHYA1 to 0.921 at locus Sat_001, with an average of 0.626 (Table 2). Regarding exclusively the genomic markers, PIC ranged from 0.360 at locus Satt509 to 0.921 at locus Sat_001, with a mean value of 0.714. The PIC value of functional markers ranged from 0.166 at locus PHYA1 to 0.748 at locus PRP1, with an average of 0.450. Therefore, a high PIC mean value for SSR (0.626) and a medium mean value for EST-SSR (0.450) were identified in the present work. These observations indicate great diversity between the accessions and also demonstrate that the selected primers are highly informative and useful for further studies on soybean genetic diversity.
The expected heterozygosity was highest at locus Sat_001 (0.935) and lowest at locus PHYA1 (0.182) (Table 2). The observed heterozygosity ranged from 0 to
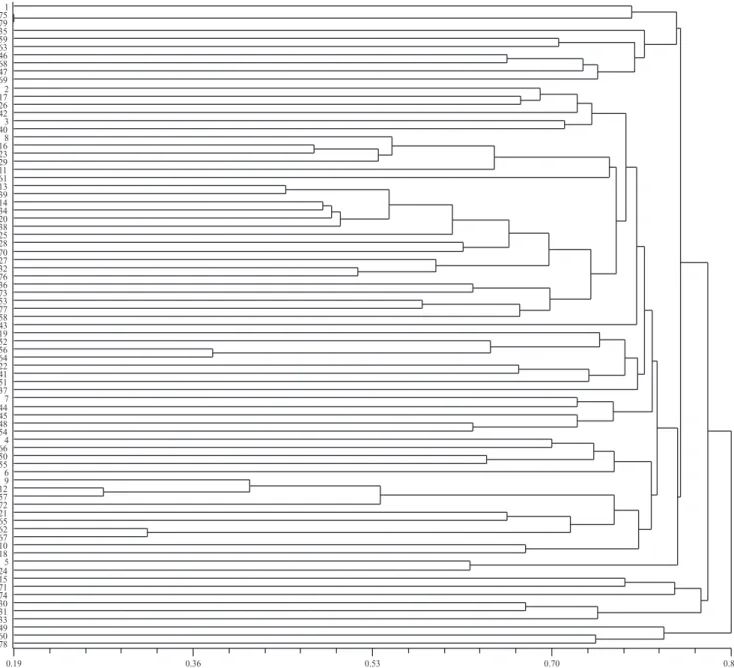
0.130 for Satt308 and Satt 102, respectively; which were considered low values, even though they were expected due to the species reproduction system. Considering Rogers-W distance matrix for all molecular markers, accessions 75 (PI 281911-Philippines) and 79 (PI 281907-Malaysia) are the most similar (0.189), whereas accessions 31 (PI 212606-Afghanistan) and 35 (PI 229358-Japan), along with accessions 40 (PI 265497-Colombia) and 78 (438503A-USA) are the most divergent ones (0.965).
The dendrogram representation of all analyzed loci (genomic and functional), assuming a cutoff point of 0.82, exhibits five groups and several subgroups, with a relative agreement according to geographic origin (Figure 1). A noteworthy group is constituted by accessions 1, 75, 79, 35, 59, 63, 46, 68, 47 and 69, since all accessions are from Eastern Asia (Japan, Korea, Northeast China, Russia, Philippines and Malaysia). Moreover, the group also concentrates the highest frequencies of rare alleles, in agreement with the fact that this geographic region is a center of origin and diversity of soybean. Other groups consistent with their geographic distribution are: Afghanistan (30 and 31) and Pakistan (33); Nepal (15 and 71) and Malaysia (74); USA (49 and 78) and Center China (60). The remaining group is the largest and contains all African and South American accessions, as well as some Asian accessions. Subgroups are identifiable within the large group and these comprise accessions consistent with geographical origin, such as: China (2 and 17), Japan (42), Korea (3) and Pakistan (26); Vietnam (51, 52 and 64), China (37 and 56) and Japan (41); two very close accessions, South China (62 and 67); all three accessions from South Africa (8, 11 and 16) along with an accession from Mozambique (29); the accessions from Sudan, Uganda and Tanzania (53, 58 and 77); and Liberia (54) and Kenya (48). A significant portion of South American accessions clustered together in a single subgroup: Guatemala (13 and 20), Peru (39 and 70), Argentina (34) and Suriname (25). A small group comprising accessions from El Salvador, Peru and Argentina (9, 12 and 72) was also present. These groups and subgroups are in agreement with previous studies, suggesting similar clustering patterns (Abe et al., 2003; Hymowitz & Kaizuma, 1981). Abe et al. (2003) proposed a cluster composed of accessions from Japan, Korea and Russia, as shown in the current study. Hymowitz & Kaizuma (1981) found similar results. Furthermore, these authors also indicate the existence of a group from Nepal. Perry & McIntosh (1991) suggested the existence of an African group, in
Table 4. Soybean accessions exhibiting exclusive alleles
and allele number.
Number of exclusive alleles
Accession number
1 1, 3, 4, 5, 8, 15, 18, 24, 27, 33, 43, 44, 45, 46, 47, 48, 51, 55, 60, 68, 69, 74 and 76 2 2, 6, 10, 31, 37, 42, 49, 59, 71 and 78 3 19 and 63
4 65
agreement with our findings, since all African accessions were clustered in a single group.
Molecular data, analyzed separately for genomic and functional loci, resulted in slightly different dendrograms, indicating that each approach differently accesses the variability present in soybean germplasm. In fact, the relationship degree between matrices derived from genomic and expressed loci, calculated by Mantel tests (Mantel, 1967), shows a low correlation value (r = 0.28**), which, however, was significant and revealed some coherence between both datasets.
Conclusions
1. The genetic diversity of the investigated accessions is high, distributed over five groups and several subgroups, and exhibits a moderate level of association between genetic divergence and geographical origin of accessions.
2. Genetic diversity of soybean is effectively investigated using both genomic and functional microsatellites markers, which allow a more complete coverage of the existent genetic variation.
Genetic diversity in soybean germplasm 283
Pesq. agropec. bras., Brasília, v.45, n.3, p.276-283, mar. 2010
References
ABE, J.; XU, D.H.; SUZUKI, Y.; KANAZAWA, A.; SHIMAMOTO, Y. Soybean germplasm pools in Asia revealed by nuclear SSRs.
Theoretical and Applied Genetics, v.106, p.445-453, 2003. BONATO, A.L.V.; CALVO, E.S.; GERALDI, I.O.; ARIAS, C.A.A. Genetic similarity among soybean (Glycine max (L) Merrill)
cultivars released in Brazil using AFLP markers. Genetics and Molecular Biology, v.29, p.692-704, 2006.
BROWN-GUEDIRA, G.L.; THOMPSON, J.A.; NELSON, R.L.; WARBURTON, M.L. Evaluation of genetic diversity of soybean introductions and north American ancestors using RAPD and SSR markers. Crop Science, v.40, p.815-823, 2000.
CHUNG, G.; SINGH, R.J. Broadening the genetic base of soybean: a multidisciplinary approach. Critical Reviews in Plant Science, v.27, p.295-341, 2008.
CREGAN, P.B.; JARVIK, T.; BUSH, A.L.; SHOEMAKER, R.C.; LARK, K.G.; KAHLER, A.L.; KAYA, N.; VANTOAI, T.T.; LOHNES, D.G.; CHUNG, J.; SPECHT, J.E. An integrated genetic linkage map of the soybean genome. Crop Science, v.39, p.1464-1490, 1999.
CRESTE, S.; TULMANN NETO, A.; FIGUEIRA, A. Detection of single sequence repeat polymorphisms in denaturing polyacrylimide sequencing gels by silver staining. Plant Molecular Biology Reporter,v.19, p.299-306, 2001.
DOYLE, J.J.; DOYLE, J.L. Isolation of DNA from fresh tissue.
Focus, v.12, p.13-15, 1990.
FU, Y.-B. Applications of bulking in molecular characterization of plant germplasm: a critical review. Plant Genetic Resources, v.1, p.161-167, 2003.
FU, Y.-B. Impact of plant breeding on genetic diversity of agricultural crops: searching for molecular evidence. Plant Genetic Resources, v.4, p.71-78, 2006.
FU, Y.-B.; PETERSON, G.W.; MORRISON, M.J. Genetic diversity of Canadian soybean cultivars and exotic germplasm revealed by simple sequence repeat markers. Crop Science, v.47, p.1947-1954, 2007.
GUZMAN, P.S.; DIERS, B.W.; NEECE, D.J.; MARTIN, S.K.; LEROY, A.R.; GRAU, C.R.; HUGHES, T.J.; NELSON, R.L. QTL associated with yield in three backcross-derived populations of soybean. Crop Science, v.47, p.111-122, 2007.
HIROMOTO, D.M.; VELLO, N.A. The genetic base of Brazilian soybean (Glycine max (L.) Merril) cultivars. Brazilian Journal of Genetics, v.9, p.295-306, 1986.
HYMOWITZ, T.; KAIZUMA, N. Soybean seed protein electrophoresis profiles from 15 Asian countries or regions: hypotheses on paths of dissemination of soybeans from China.
Economic Botany, v.35, p.10-23, 1981.
HYTEN, D.L.; SONG, Q.; ZHU, Y.; CHOI, I.-Y.; NELSON, R.L.; COSTA, J.M.; SPECHT, J.E.; SHOEMAKER, R.C.; CREGAN, P.B. Impacts o0f genetic bottlenecks on soybean genome diversity.
Proceedings of the National Academy of Science of the United States of America, v.103, p.16666-16671, 2006.
KURODA, Y.; TOMOOKA, N.; KAGA, A.; WANIGADEVA, S.M.S.W.; VAUGHAN, D.A.Genetic diversity of wild soybean
(Glycine soja Sieb. Et Zucc.) and Japanese cultivated soybeans [G.
max (L.) Merr.] based on microsatellite (SSR) analysis and the
selection of a core collection. Genetic Resources and Crop Evolution, v.56, p.1045-1055, 2009.
LEE, J.D.; YU, J.K.; HWANG, Y.H.; BLAKE, S.; SO, Y.S.; LEE, G.J.; NUGUYEN, H.T.; SHANNON, J.G. Genetic diversity of wild soybean (Glycine soja Sieb. and Zucc.) accessions from South Korea and other countries. Crop Science, v.48, p.606-616, 2008.
LEWIS, P.O.; ZAYKIN, D. Genetic data analysis: computer program for the analysis of allelic data 2000. Version 1.1. 2000. Available at: <http://hydrodictyon.eeb.uconn.edu/people/plewis/ software.php>. Accessed on: 2 set. 2009.
LI, X.H.; WANG, K.J.; JIA, J.Z. Genetic diversity and differentiation of Chinese wild soybean germplasm (G. soja Sieb. & Zucc.) in geographical scale revealed by SSR markers. Plant Breeding, v.128, p.658-664, 2009.
MANTEL, N. The detection of disease clustering and a generalized regression approach. Cancer Research, v.27, p.209-220, 1967. MARTIN, M.S. Crop strength through diversity. Nature, v.406, p.681-682, 2000.
MILLER, M. Tools for population genetic analyses (TFPGA): a windows program for analyses of allozyme and molecular population genetic data. Version 1.3. 1997. Available at: <http:// www.marksgeneticsoftware.net/tfpga.htm>. Accessed on: 2 set. 2009.
NARVEL, J.M.; FEHR, W.R.; CHU, W.S.; GRANT, D.; SHOEMAKER, R.C. Simple sequence repeat diversity among soybean plant introductions and elite genotypes. Crop Science, v.40, p.1452-1458, 2000.
PERRY, M.C.; MCINTOSH, M.S. Geographical patterns of variation in the USDA soybean germplasm collection. I. Morphological traits.
Crop Science, v.31, p.1350-1355, 1991.
PRIOLLI, R.H.G.; MENDES-JUNIOR, C.T.; ARANTES, N.E.; CONTEL, E.P.B. Characterization of Brazilian soybean cultivars using microsatellite markers. Genetics and Molecular Biology, v.25, p.185-193, 2002.
ROHLF, F.J. NTSYS-Pc: numerical taxonomy and multivariate analysis system. Version 2.2. Setauket: Exeter Software, 2005. SONG, Q.J.; MAREK, L.F.; SHOEMAKER, R.C.; LARK, K.G.; CONCIBIDO, V.C.; DELANNAY, X.; SPECHT, J.E.; CREGAN, P.B. A new integrated genetic linkage map of soybean. Theoretical and Applied Genetics, v.109, p.122-128, 2004.
WANG, L.X.; GUAN, R.X.; LI, Y.H.; LIN, F.Y.; LUAN, W.J.; LI, W.; MA, Y.S.; LIU, Z.X.; CHANG, R.Z.; QIU, L.J. Genetic diversity of chinese spring soybean germplasm revealed by SSR markers. Plant Breeding, v.127, p.56-61, 2008.