OF CALOPO RHIZOBIAL ISOLATES IN AN
ARGISSOLO
VERMELHO-AMARELO
UNDER THREE VEGETATION COVERS
IN THE DRY FOREST ZONE OF PERNAMBUCO
Altanys Silva Calheiros(1), Mario de Andrade Lira Junior(2)*, Mércia Virgínia Ferreira Santos(3) and Maria do Carmo Catanho Pereira Lyra(4)
(1) Instituto Federal de Alagoas, Pró-Reitoria de Pesquisa e Inovação, Maceió, Alagoas, Brasil.
(2) Universidade Federal Rural de Pernambuco, Departamento de Agronomia, Recife, Pernambuco, Brasil. (3) Universidade Federal Rural de Pernambuco, Departamento de Zootecnia, Recife, Pernambuco, Brasil. (4) Instituto Agronômico de Pernambuco, Laboratório de Genética Molecular, Recife, Pernambuco, Brasil. * Corresponding author.
E-mail: [email protected]
ABSTRACT
Biological N fixation in forage legumes is an important alternative to reduce pasture degradation, and is strongly influenced by the inoculant symbiotic capability. This paper evaluates the effectiveness of Calopo (Calopogonium mucunoides) rhizobial isolated from
soil under three vegetation covers of an Argissolo Vermelho-Amarelo of the Dry Forest
Zone of Pernambuco. An experiment was conducted evaluating 25 isolates, aside from 5 uninoculated controls with 0; 309; 60; 90 and 120 kg ha-1 N, and a treatment inoculated with the SEMIA 6152 strain. The first cut was performed 45 days after inoculation and a second and third cut after 45-day-intervals. Shoot N content was quantified at all cuts. Shoot dry mass was affected by N rates at all cuts. Shoot dry mass increased from the first to the second cut in inoculated plants. There was no difference between rhizobial isolates from the different plant covers for any of the variables. Most variables were significantly and positively correlated.
Keywords: Calopogonium mucunoides, biological fixation, forage legumes.
INTRODUCTION
Forage legumes intercropped with grasses allow partial or total substitution of N fertilizer, which
is usually expensive and when insufficient, one of
the main reasons for low pasture yield (Carvalho and Pires, 2008). On the other hand, in tropical regions there are no well-established grass-legume
pastures, mostly due to difficulties with legume
survival, which indicates that the use of native legumes might reduce the problem (Lira et al., 2006). Calopo (Calopogonium mucunoides) is a forage legume, native to South America, that can be used in humid tropical regions, and is found in a native or naturalized status in State Forest Zone of Pernambuco (Souza et al., 2007).
According to Herridge et al. (2008), forage legumes
in pastures can fix from 110 to 227 kg ha-1 yr-1 of N, and an estimated 10 to 15 Gg yr-1 N on a worldwide basis. Higher legume yields and consequently
higher biological N fixation rates may be obtained
through the selection of rhizobial strains with
higher biological nitrogen fixation (BNF) efficiency
(Antunes et al., 2011; Rahmani et al., 2011).
The selection of rhizobial strains effective for BNF usually require several steps, such as soil or nodule sampling from areas in which the target species naturally occurs, strain isolation,
purification, and characterization, as well as the estimation of BNF efficiency on both sterilized and unsterilized substrates before the final field
evaluation. Ideally a large number of strains should be included in these stages, to increase the chance
of finding higher efficiency strains for inoculant
production (Lima et al., 2009; Chagas Junior et
al., 2010; Rufini et al., 2011; Araújo et al., 2012; Calheiros et al., 2013).
As an example of the possible effect of plant cover
on rhizobial efficiency, Santos et al. (2005) studied groundnut with rhizobia isolated from different plant covers in a semi-arid region in Pernambuco. These authors found large variation in strain efficiency for BNF, due both to the groundnut cultivar and the plant cover from which the strain was initially isolated.
This paper aims to evaluate the symbiotic
efficiency of Calopo rhizobial strains isolated from
signal grass pastures, “sabiá” woodlots and Atlantic Forest in nearby areas of the same soil type in a Tropical Subhumid Area, the Dry Forest Zone of Pernambuco State.
MATERIAL AND METHODS
Soil was collected in March 2010, at the Experimental Station of Itambé of the Agronomic Institute of Pernambuco (07° 25’ S, 35° 06’ W, 190 m asl) in the Zona da Mata Seca of the State of
Pernambuco. The climate classification according to Köppen is AS’, and the soil was classified as
a Argissolo Vermelho-Amarelo, with prominent A horizon with clayey loam texture and slightly undulating relief, according to Jacomine et al. (1973), and updated according to Embrapa (2006).
Composite soil samples were collected from the 0.0-0.2 m layer in each of three distinct areas of signal grass (Brachiaria decumbens) pastures, “sabiá” (Mimosa caesalpiniifolia) woodlots and Atlantic Forest. Signal grass pastures were established at the end of the 1980’s and were pastured since then, and in different stages of degradation, with some invasion of native herb legumes. The “sabiá” woodlots were established in 1987 and 1990, and the Atlantic Forest at least 1960 before.
RESUMO: EFETIVIDADE SIMBIÓTICA E COMPETITIVIDADE DE RIZÓBIOS DE CALOPOGÔNIO ISOLADOS DE TRÊS COBERTURAS VEGETAIS, EM ARGISSOLO VERMELHO-AMARELO DA ZONA DA MATA PERNAMBUCANA
A fixação biológica de N por leguminosas forrageiras é uma alternativa importante para reduzir a degradação de pastagens e é muito influenciada pela capacidade simbiótica do inoculante. Este trabalho avaliou a efetividade de isolados rizobianos de calopogônio (Calopogonium muconoides) de um Argissolo Vermelho-Amarelo da Zona da Mata Seca de Pernambuco com três diferentes coberturas vegetais. Foi conduzido um experimento testando 25 isolados, além de cinco controles não inoculados com 0; 30; 60; 90; e 120 kg ha-1 de N, e um tratamento inoculado com a estirpe SEMIA 6152. O primeiro corte foi realizado 45
A soil subsample from each area was conserved at about 4 °C until inoculation of the trap plants. Another part of the samples was used for physical and chemical analyses (Table 1), according to Ruiz (2005) and (Embrapa, 1999), respectively.
Calopo plant traps were used for nodulation studies, from which 1,575 assumedly rhizobial isolates were obtained, and after authentication and initial
symbiotic efficiency tests, 25 isolates were identified as the most efficient, with shoot dry mass higher than achieved with 50 kg ha-1 N. These isolates were selected for the unsterilized soil experiment described in this paper.
This experiment was conducted in soil from the same experimental station (chemical and physical properties listed in table 1). Apart from the 25 selected strains, six control treatments were carried out. Five of these were uninoculated, treated
with 0, 30, 60, 90, or 120 kg ha-1 N, and the other was inoculated with Bradyrhizobium japonicum,
strain SEMIA 6152=BR1602 (Genbank access
AY904756), currently recommended for Calopo inoculant production (Brasil, 2011).
Nitrogen was supplied as ammonium nitrate, in one third 15 days after seedling establishment, and the remainder evenly divided after each cut. The amounts per experimental unit were established according to the average soil mass. Soil pH was corrected with calcium carbonate to 70 % base saturation, equivalent to 3.65 t ha-1 of lime, 20 days before seedling transplantation. Phosphorus and potassium were supplied according to fertilizer recommendations for Pernambuco (IAP, 2008), at the beginning of the experiment and after each cut. The other nutrients were applied in Hoagland´s
nutrient solution (Hoagland and Arnon, 1950), only at the beginning of the experiment.
Calopo seeds were chemically scarified with concentrated sulfuric acid for 20 min, repeatedly washed with distilled water, and afterwards surface-disinfected with sodium hypochlorite for 5 min, and again repeatedly washed with distilled water. Seeds were germinated in Petri dishes with paper towel for two days, and then transferred three-by-three to polyethylene bags. Two days after transplantation, each seedling was treated with 1 mL of bacterial broth with about 108 rhizobial cells mL-1. Plants were irrigated as necessary to
maintain soil moisture near field capacity.
The first cut was performed 45 days after inoculation,
and the second and third within 45-day-intervals. Shoot dry mass (SDM) was obtained by oven-drying at 65 °C to constant mass. The material was ground in a Willey mill, sieved (<1.0 mm), and used for N content determination according to Malavolta et al. (1989). After the third cut, root (RDM) and nodule (NDM) dry masses were obtained similarly to SDM.
For the N-fertilized treatments, regressions were estimated for SDM, shoot N content (SNC) and shoot N accumulation (SNA) using supplied N as the independent variable. The equivalent N rate (END) was then estimated for each pot based on observed SDM and SNA, on the basis of the respective regression.
Relative efficiency (RE) was calculated based on
SNA, using the equation:
RE = SNA per bag ×100
Average SNA of the treatment fertilized with 60 kg ha-1 of N
The data were subjected to analysis of variance and the Scott-Knott test as appropriate, using
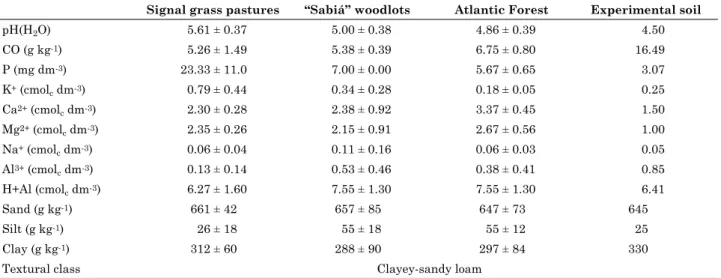
Table 1. Means and 95 % confidence interval of soil chemical and physical characteristics of signal grass pastures, “sabiá” woodlots and Atlantic Forest areas used for rhizobial isolation, and of the soil used in the inoculant efficiency experiment
Signal grass pastures “Sabiá” woodlots Atlantic Forest Experimental soil
pH(H2O) 5.61 ± 0.37 5.00 ± 0.38 4.86 ± 0.39 4.50
CO (g kg-1) 5.26 ± 1.49 5.38 ± 0.39 6.75 ± 0.80 16.49
P (mg dm-3) 23.33 ± 11.0 7.00 ± 0.00 5.67 ± 0.65 3.07
K+ (cmol
c dm-3) 0.79 ± 0.44 0.34 ± 0.28 0.18 ± 0.05 0.25
Ca2+ (cmol
c dm-3) 2.30 ± 0.28 2.38 ± 0.92 3.37 ± 0.45 1.50
Mg2+ (cmol
c dm-3) 2.35 ± 0.26 2.15 ± 0.91 2.67 ± 0.56 1.00
Na+ (cmol
c dm-3) 0.06 ± 0.04 0.11 ± 0.16 0.06 ± 0.03 0.05
Al3+ (cmol
c dm-3) 0.13 ± 0.14 0.53 ± 0.46 0.38 ± 0.41 0.85
H+Al (cmolc dm-3) 6.27 ± 1.60 7.55 ± 1.30 7.55 ± 1.30 6.41
Sand (g kg-1) 661 ± 42 657 ± 85 647 ± 73 645
Silt (g kg-1) 26 ± 18 55 ± 18 55 ± 12 25
Clay (g kg-1) 312 ± 60 288 ± 90 297 ± 84 330
Textural class Clayey-sandy loam
Mean ± 95 % confidence interval; pH in water (1:2.5); P, K and Na extracted by Mehlich-1; Ca, Mg and Al extracted by 1 mol L-1;
SIsvar 5.3 (Ferreira, 2008) for each cut separately.
Correlation coefficients among the variables were
calculated using Statistica 8.0 (Statsoft, 2008).
RESULTS AND DISCUSSION
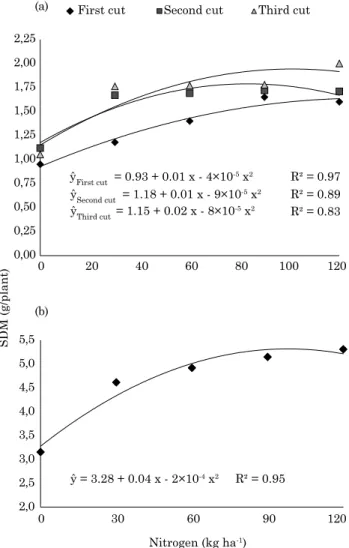
Shoot dry mass was affected by N rates in all three cuts; maximum values were achieved by 137.5;
82.0 and 98.0 kg ha-1 N in the first, second and third cut, respectively, and with maximum SNA values of
1.68, 1.78 and 1.92 g/plant of N in the first, second
and third cut, respectively (Figure 1).
In most treatments, SDM increased from the
first to the second cut, but not from the second
to the third (Tables 2 to 4). This may be due to organic matter decomposition (Buso & Kliemann, 2003), since it was independent from fertilization and inoculation. This conjecture is strengthened
by a lower increase at higher N rates, congruent with lower dependency from soil organic matter decomposition. The soil organic carbon content
(16.49 g kg-1 ≈ 28.5 g kg-1 of organic matter) is close
to the limit of 30 g kg-1 of organic matter considered high for soils in Pernambuco (Luz et al., 2002), and substantially higher than in the initial sampling, but with lower pH and P content (Table 1).
Significant differences (p<0.05) were found for all variables in the first cut (Table 2), in which
only isolate UFRPE Cm243 (p>0.05) allowed SDM as high as that for plants fertilized with up
to 120 kg ha-1 N and 1.22 and 1.38 times higher than the recommended strain and uninoculated plants, respectively.
In plants inoculated with the UFRPE isolates UFRPE Cm244, 253, 677, and 153, SNC did not differ (p>0.05) from N-fertilized plants, and was higher than for isolate UFRPE Cm 243, probably due a dilution effect for the latter. Values of SNA of plants inoculated with UFRPE isolates UFRPE Cm243; 677; 323; 244; 81; 362; 321; 90; 88; 163, and
308 were significantly higher (p<0.05) than for the
other strains and did not differ from plants receiving
30 kg ha-1 N, but lower than for other N-fertilized treatments (Table 2).
There was a 32 % average SDM increase in the
second cut, compared to the first (Tables 2 and
3), which was higher for most of the inoculated plants. This stronger effect for inoculated plants may be due to higher RDM, as observed by Xavier et al. (2005) for alfalfa plants inoculated with Sinorhizobium meliloti in a greenhouse experiment in Minas Gerais, Brazil. On the other hand, those authors did not observe the SDM increase shown in our data.
Average SDM for the 15 highest-yielding isolates (Table 3) was 48 % higher than observed in the uninoculated, unfertilized treatment, and SDM for the highest yielding isolate (UFRPE Cm 244), although not different from the others of the group, was 88 % higher than in the uninoculated, unfertilized
treatment. Since there was no significant difference
(p>0.05) between SNC among all treatments, plants with those isolates also had the highest SNA, and RE ranged from 82 to 131.5 %, similar to RE of N-fertilized plants. The only isolate with RE below 50 %, e.g. whose SDM was below 50 % of plants
receiving 100 kg ha-1 N, was UFRPE Cm603. In contrast to these large increases in SNA due to inoculation, Soares et al. (2006) found that a single strain achieved SNA similar to that of plants
receiving 70 kg ha-1 N in common bean in a field experiment in Minas Gerais, Brazil, while for the remaining isolates, SNA did not differ from the unfertilized treatment, even when inoculated with a strain recommended for inoculant production.
ŷFirst cut = 0.93 + 0.01 x - 4×10-5 x2 ŷSecond cut = 1.18 + 0.01 x - 9×10-5 x2 ŷThird cut = 1.15 + 0.02 x - 8×10-5 x2
ŷ = 3.28 + 0.04 x - 2×10-4 x2 R² = 0.95 0,00
0,25 0,50 0,75 1,00 1,25 1,50 1,75 2,00 2,25
(a)
(b)
0 20 40 60 80 100 120
120
SDM
(g/plant
)
First cut Second cut Third cut
2,0 2,5 3,0 3,5 4,0 4,5 5,0 5,5
0 30 60 90
Nitrogen (kg ha-1)
R² = 0.97 R² = 0.89 R² = 0.83
Plants inoculated with UFRPE isolates (UFRPE Cm155; 244; 362; 504, and 1302) had the highest
END values, with an average of 71.92 kg ha-1 N, significantly higher (p<0.05) than observed for
plants receiving up to 120 kg ha-1 N.
Constrasting to the SDM increase from the first
to the second cut, there was a small (6 %) decrease from the second to the third, probably due to the
flowering that occurred a few days after the initial
regrowth from the second cut. In the third cut, only isolates UFRPE Cm72; 81; 163; 321; 323; 556; 677 and 1302 did not differ from the SDM yields of N-fertilized plants (Table 4). There was no
significant effect of inoculation on either RDM or NDM, most likely due to the high random variability
observed in the experiment. On the other hand,
this lack of significant difference in NDM, coupled
with the increase in both SDM and SNA, indicates Table 2. Shoot dry mass (SDM), shoot N concentration (SNC) and shoot N accumulation (SNA), relative efficiency (RE), and estimated equivalent N rate (END) in the first cut of calopo inoculated with isolated rhizobial previously obtained by calopo plant trap
Treatment SDM SNC SNA RE(1) END(2)
g/plant dag kg-1 mg/plant % kg ha-1
UFRPE Cm72 0.99 b 2.62 b 25.78 c 58.47 c 5.53 c
UFRPE Cm81 1.19 b 2.53 b 29.49 b 66.86 b 27.48 b
UFRPE Cm88 1.09 b 2.64 b 28.22 b 63.99 b 16.38 c
UFRPE Cm90 1.26 b 2.30 b 28.79 b 65.30 b 35.42 b
UFRPE Cm153 0.94 b 2.73 a 26.02 c 58.99 c 1.82 c
UFRPE Cm155 1.10 b 2.36 b 26.27 c 59.56 c 18.14 c
UFRPE Cm163 1.09 b 2.54 b 28.11 b 63.75 b 16.59 c
UFRPE Cm243 1.31 a 2.58 b 33.89 b 76.85 b 41.28 b
UFRPE Cm244 1.01 b 3.00 a 30.18 b 68.43 b 7.43 c
UFRPE Cm253 0.95 b 2.76 a 25.58 c 58.01 c 2.42 c
UFRPE Cm308 1.12 b 2.52 b 28.07 b 63.64 b 19.16 c
UFRPE Cm309 0.98 b 2.54 b 25.03 c 56.76 c 4.89 c
UFRPE Cm321 1.08 b 2.60 b 28.81 b 65.32 b 16.03 c
UFRPE Cm323 1.21 b 2.58 b 30.53 b 69.22 b 29.95 b
UFRPE Cm326 1.06 b 2.27 b 24.83 c 56.29 c 13.46 c
UFRPE Cm362 1.22 b 2.39 b 29.43 b 66.75 b 31.63 b
UFRPE Cm363 1.05 b 2.35 b 24.84 c 56.32 c 12.93 c
UFRPE Cm504 1.08 b 2.40 b 26.37 c 59.80 c 16.48 c
UFRPE Cm556 0.89 b 2.55 b 23.14 c 52.47 c
-UFRPE Cm603 1.00 b 2.49 b 24.58 c 55.69 c 7.04 c
UFRPE Cm677 1.11 b 2.75 a 30.71 b 69.63 b 18.60 c
UFRPE Cm683 0.99 b 2.48 b 24.88 c 56.42 c 6.75 c
UFRPE Cm799 1.02 b 2.34 b 23.23 c 52.67 c 9.66 c
UFRPE Cm1302 1.06 b 2.16 b 22.89 c 51.91 c 12.32 c
UFRPE Cm1535 0.95 b 2.56 b 24.36 c 55.25 c 2.02 c
SEMIA 6152(3) 1.07 b 2.61 b 27.74 b 62.90 b 14.60 c
CV (%) 17.14 12.62 16.21 16.21
Letters in the same column followed by the same letter are not significantly different (p < 0.05) by Scott-Knott. (1) RE: SNA for each
pot/average SNA for the treatment with 60 kg ha-1 N. (2) Estimated based on the SDM regression for the applied N treatments.
a higher BNF efficiency for the isolates used in the
experiment, compared to the natively occurring, and may also imply that they are at least as competitive as those naturally found in the soil, otherwise this effect would not be observed.
Plants inoculated with isolates UFRPE Cm 72; 163; 323 and 677 had the highest SNA, and RE over 90 %, not differing (p>0.05) from N-fertilized plants. Six other isolates (UFRPE Cm81; 253; 321; 556; 603 and 683) also increased SNA with the cuts,
and only isolates UFRPE Cm88 and 1535 had RE values below 50 % (Table 4).
Oliveira et al. (1996), working with calopo, cunhã,
stylo and tropical kudzu, all grown in monoculture
or intercropped with one of two grasses in a greenhouse, similarly found increased SNA up to the third cut, with a decline after the third, in 8 of 13 treatments.
Plants inoculated with UFRPE Cm 677 did not
differ (p>0.05) from plants receiving 120 kg ha-1 N, Table 3. Shoot dry mass (SDM), shoot N concentration (SNC) and shoot N accumulation (SNA), relative efficiency (RE), and estimated equivalent N rate (END) in the second cut of calopo inoculated with isolated rhizobial previously obtained by calopo plant trap
Treatment SDM SNC SNA RE(1) END(2)
g/plant dag/kg mg/plant % kg/ha
UFRPE Cm72 1.49 a 2.80 a 41.80 a 84.42 a 25.50 c
UFRPE Cm81 1.11 b 2.86 a 32.19 b 65.01 b
-UFRPE Cm88 1.10 b 3.04 a 32.22 b 65.07 b
-UFRPE Cm90 1.07 b 3.21 a 34.02 b 68.71 b
-UFRPE Cm153 0.86 b 3.14 a 26.72 b 53.97 b
-UFRPE Cm155 1.88 a 2.95 a 54.90 a 110.88 a 72.53 a
UFRPE Cm163 1.45 a 2.85 a 41.37 a 83.55 a 21.33 c
UFRPE Cm243 1.65 a 2.46 a 40.61 a 82.00 a 46.02 b
UFRPE Cm244 2.11 a 3.06 a 65.11 a 131.49 a 81.67 a
UFRPE Cm253 0.97 b 2.89 a 26.75 b 54.03 b
-UFRPE Cm308 1.60 a 3.19 a 50.57 a 102.12 a 44.04 b
UFRPE Cm309 1.64 a 2.91 a 47.45 a 95.83 a 42.96 b
UFRPE Cm321 1.10 b 3.09 a 34.11 b 68.88 b
-UFRPE Cm323 1.28 b 2.99 a 38.18 b 77.09 b 11.16 c
UFRPE Cm326 1.61 a 2.99 a 48.37 a 97.68 a 39.10 b
UFRPE Cm362 1.78 a 3.02 a 53.83 a 108.71 a 71.44 a
UFRPE Cm363 1.52 a 2.78 a 41.85 a 84.51 a 31.41 b
UFRPE Cm504 1.79 a 2.89 a 51.39 a 103.78 a 73.74 a
UFRPE Cm556 1.24 b 2.98 a 37.41 b 75.55 b 6.44 c
UFRPE Cm603 0.71 b 3.17 a 22.84 b 46.12 b
-UFRPE Cm677 1.37 a 3.16 a 43.58 a 88.01 a 16.34 c
UFRPE Cm683 0.85 b 3.32 a 28.07 b 56.70 b
-UFRPE Cm799 1.68 a 2.80 a 46.49 a 93.88 a 49.97 b
UFRPE Cm1302 1.80 a 2.60 a 46.37 a 93.65 a 60.20 a
UFRPE Cm1535 1.51 a 2.85 a 42.41 a 85.65 a 30.20 b
SEMIA 6152(3) 1.41 a 2.49 a 34.48 b 69.63 b 17.66 c
CV (%) 14.92 9.99 16.79 16.79
Letters in the same column followed by the same letter are not significantly different (p<0.05) by Scott-Knott. (1) RE: SNA for each
pot/average SNA for the treatment with 60 kg ha-1 N. (2) Estimated based on the SDM regression for the applied N treatments.
while isolates UFRPE Cm72; 163 and 323 had lower results, but were not different either from those
receiving up to 90 kg ha-1 N, while plants inoculated with the currently recommended SEMIA 6152 did not differ from unfertilized, uninoculated plants (Table 4).
Isolates UFRPE Cm72, 163, 243, 244, 323, 362, 677, and 1302 allowed higher total SDM after three cuts, not differing (p>0.05) from the plants receiving
30 kg ha-1 N, although only UFRPE Cm 244 and
677 did not differ from the 30 kg ha-1 N treatment in SNA and RE after the third cut (Table 5).
Shoot dry mass, after each cut (Figure 1a) and accumulated after three cuts (Figure 1b), was affected by applied N, with the highest SDM after
three cuts achieved by 104 kg ha-1 N at 5.44 g/plant. The isolates UFRPE Cm244 and 677 were generally effective, and their average SNA was around 83 and 85 % of that accumulated by plants
receiving 120 kg ha-1 N. These effects are similar Table 4. Shoot (SDM), root (N) and nodule (NDM) dry mass, shoot N concentration (SNC) and shoot N accumulation (SNA), relative efficiency (RE) and estimated equivalente N rate (END) in the third cut of calopo inoculated with isolated rhizobial previously obtained by calopo plant trap
Treatment SDM RDM NDM SNC SNA RE(1) END(2)
g/plant mg/plant dag/kg mg/plant % kg/ha
UFRPE Cm72 1.74 a 0.98 b 97.00 a 2.92 a 50.92 a 104.03 a 51.82 b
UFRPE Cm81 1.43 a 0.89 b 80.50 a 2.64 a 38.04 b 77.88 b 24.01 c
UFRPE Cm88 0.78 b 0.51 b 34.33 a 2.54 a 19.80 b 40.53 b
-UFRPE Cm90 0.90 b 0.44 b 36.00 a 2.84 a 25.39 b 51.98 b
-UFRPE Cm153 0.95 b 0.41 b 56.67 a 2.27 a 21.55 b 44.11 b
-UFRPE Cm155 0.99 b 0.79 b 35.56 a 2.96 a 29.36 b 60.09 b
-UFRPE Cm163 1.68 a 0.73 b 105.50 a 2.74 a 45.90 a 93.97 a 42.69 b UFRPE Cm243 1.27 b 0.83 b 79.50 a 2.74 a 35.27 b 72.20 b 8.38 c UFRPE Cm244 1.18 b 0.70 b 59.50 a 2.86 a 33.52 b 68.61 b 1.90 c UFRPE Cm253 1.17 b 0.57 b 72.34 a 2.67 a 31.56 b 64.60 b 2.89 c UFRPE Cm308 1.29 b 0.69 b 69.50 a 2.73 a 35.24 b 72.14 b 9.86 c UFRPE Cm309 1.15 b 0.65 b 62.25 a 2.99 a 34.26 b 70.12 b 0.58 c UFRPE Cm321 1.48 a 0.62 b 92.00 a 2.74 a 40.03 b 81.95 b 23.84 c UFRPE Cm323 1.76 a 0.77 b 85.00 a 2.77 a 48.65 a 99.59 a 52.59 b
UFRPE Cm326 1.04 b 0.64 b 54.50 a 2.83 a 29.23 b 59.84 b
-UFRPE Cm362 1.28 b 0.83 b 63.50 a 2.83 a 36.27 b 74.25 b 9.09 c UFRPE Cm363 1.34 b 0.65 b 101.00 a 2.75 a 36.79 b 75.32 b 13.91 c UFRPE Cm504 1.16 b 0.70 b 47.67 a 2.60 a 29.22 b 59.82 b 2.46 c UFRPE Cm556 1.55 a 0.67 b 92.00 a 2.45 a 38.27 b 78.34 b 31.24 c UFRPE Cm603 1.37 b 0.44 b 89.00 a 2.79 a 38.14 b 78.08 b 16.06 c UFRPE Cm677 1.96 a 0.91 b 133.25 a 2.98 a 58.68 a 120.12 a 91.09 a
UFRPE Cm683 1.09 b 0.52 b 80.00 a 2.71 a 29.57 b 60.52 b
-UFRPE Cm799 1.32 b 0.77 b 95.17 a 2.36 a 30.92 b 63.28 b 12.42 c UFRPE Cm1302 1.47 a 0.91 b 82.78 a 2.60 a 37.47 b 76.71 b 24.19 c
UFRPE Cm1535 0.89 b 0.53 b 45.83 a 2.70 a 24.37 b 49.88 b
-SEMIA 6152(3) 1.26 b 0.97 b 45.00 a 2.54 a 32.26 b 66.03 b 8.12 c
CV (%) 13.33 30.05 54.31 11.71 14.84 14.84
Letters in the same column followed by the same letter are not significantly different (p < 0.05) by Scott-Knott. (1) RE: SNA for each
pot/average SNA for the treatment with 60 kg ha-1 N. (2) Estimated based on the SDM regression for the applied N treatments.
to those found by Fontoura et al. (2011) who found that inoculated Lotus glaber plants, cultivated in Leonard jars, accumulated similar levels of N as
plants fertilized with 100 kg ha-1 N.
Inoculation with isolates UFRPE Cm362 and 677
was equivalent to supplying 112 and 126 kg ha-1 N,
respectively (Tables 2 to 4), over the three cuts, which would be the maximum N fertilizer rate recommended for Pernambuco, where average annual rainfall is at least 1,200 mm yr-1 (IAP, 2008).
Assuming an average N fertilizer cost of R$ 2.79 kg-1 of N (CONAB, 2012), inoculation with these strains would cost R$ 313.00 and R$ 352.00, per hectare, Table 5. Average shoot dry mass (SDM), shoot N
accumulation (SNA) and relative efficiency (RE) of calopo rhizobial isolates after three cuts
Treatment SDM SNA RE(1)
g/plant mg/plant %
UFRPE Cm72 4.22 b 118.50 c 83.18 c
UFRPE Cm81 3.74 d 99.72 d 69.99 d
UFRPE Cm88 2.96 e 80.23 e 56.32 e
UFRPE Cm90 3.22 e 88.21 e 61.91 e
UFRPE Cm153 2.75 e 74.28 e 52.14 e
UFRPE Cm155 3.97 c 110.53 d 77.58 d
UFRPE Cm163 4.22 b 115.39 c 80.99 c
UFRPE Cm243 4.22 b 109.76 d 77.04 d
UFRPE Cm244 4.30 b 128.81 b 90.41 b
UFRPE Cm253 3.09 e 83.89 e 58.89 e UFRPE Cm308 4.01 c 113.87 c 79.93 c
UFRPE Cm309 3.76 d 106.73 d 74.92 d
UFRPE Cm321 3.66 d 102.95 d 72.26 d
UFRPE Cm323 4.24 b 117.35 c 82.37 c
UFRPE Cm326 3.70 d 102.43 d 71.89 d
UFRPE Cm362 4.28 b 119.53 c 83.90 c
UFRPE Cm363 3.90 c 103.48 d 72.63 d
UFRPE Cm504 4.02 c 106.98 d 75.09 d
UFRPE Cm556 3.68 d 98.81 d 69.36 d
UFRPE Cm603 3.08 e 85.54 e 60.04 e
UFRPE Cm677 4.45 b 132.96 b 93.33 b UFRPE Cm683 2.93 e 82.52 e 57.92 e
UFRPE Cm799 4.01 c 100.62 d 70.63 d
UFRPE Cm1302 4.33 b 106.74 d 74.92 d
UFRPE Cm1535 3.34 e 91.14 e 63.97 e
SEMIA 6152 3.73 d 94.48 d 66.31 d
CV (%) 7.44 7.88 7.88
Letters in the same column followed by the same letter are not
significantly different (p<0.05) by Scott-Knott. (1) RE: SNA per
pot/average SNA for the treatment with 60 kg ha-1 N.
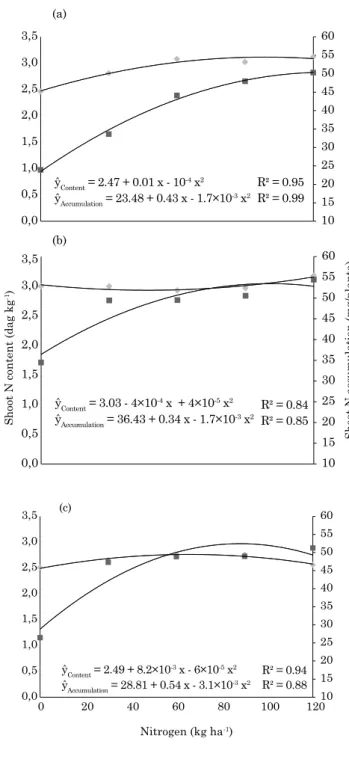
ŷContent = 2.47 + 0.01 x - 10-4 x2 R² = 0.95 ŷAccumulation = 23.48 + 0.43 x - 1.7×10-3 x2
ŷContent = 3.03 - 4×10⁻⁴ x + 4×10-5 x2 ŷAccumulation = 36.43 + 0.34 x - 1.7×10-3 x2
R² = 0.99
10 15 20 25 30 35 40 45 50 55 60 0,0 0,5 1,0 1,5 2,0 2,5 3,0 3,5 (a) (b) (c)
Shoot N content Shoot N accumulation
R² = 0.84 R² = 0.85
R² = 0.88 R² = 0.94
10 15 20 25 30 35 40 45 50 55 60 0,0 0,5 1,0 1,5 2,0 2,5 3,0 3,5
Shoot N content
(da
g
kg
-1)
Shoot N accumulation (mg/planta)
10 15 20 25 30 35 40 45 50 55 60 0,0 0,5 1,0 1,5 2,0 2,5 3,0 3,5
0 20 40 60 80 100 120
Nitrogen (kg ha-1)
ŷContent = 2.49 + 8.2×10
-3 x - 6×10-5 x2
ŷAccumulation = 28.81 + 0.54 x - 3.1×10-3 x2
respectively, aside from the non-financial advantages
of substitution of N fertilizer.
Figure 2 presents shoot N concentration and accumulation for the three cuts, in the N-fertilized treatments. A quadratic regression was found for
all situations, with high, significant determination coefficients. In the first cut, maximum SNC would have been achieved with 65 kg ha-1 N, while maximum
SNA would be extrapolated to 126 kg ha-1 N. For the following cuts, SNC was not importantly affected by the N rate, while the effects of N application on SNA continued strong, but maximum SNA was estimated
to occur with 100 and 87 kg ha-1 N for the second and third cut, perhaps due to increased BNF, or increased organic matter cycling.
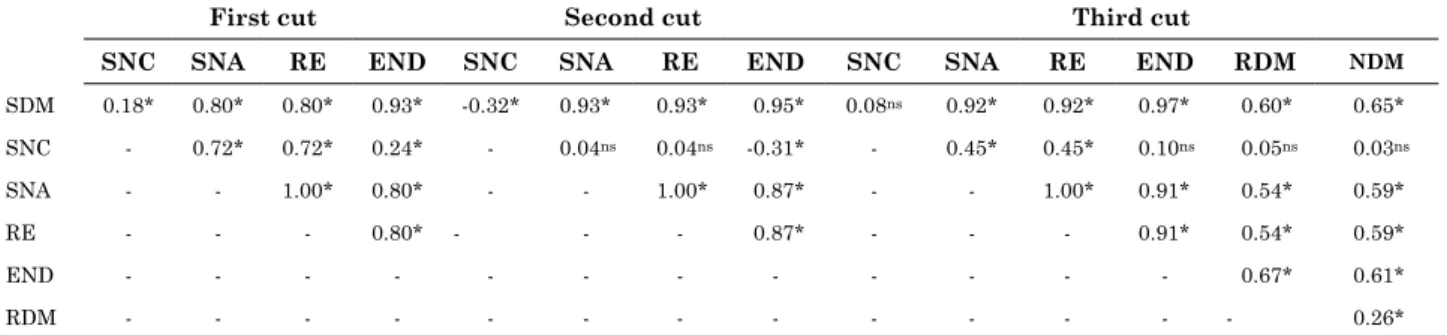
There were positive and significant correlations
for most variables in all cuts (Table 6), with the
highest correlation coefficients for SDM and SNA,
RE and END; SNA and RE, as was expected due to their calculation formulas. On the other hand, SDM was negatively correlated with SNC and SNC with
END, most likely indicating a dilution effect.
Positive and significant correlations are frequently found between SDM and SNA in inoculation studies, which is one of the bases for strain selection for inoculant production (Nascimento et al., 2010; Antunes et al., 2011), particularly in greenhouse experiments.
CONCLUSION
The currently recommended rhizobial strain was not as effective as strains UFRPE Cm 244 and 677 in the accumulation of shoot dry mass and shoot N content over three cuts. Inoculation with these two UFRPE isolates did not differ from the application
of 30 kg ha-1 N, but exceeded 90 % of the values
achieved by plants fertilized with 60 kg ha-1 N, indicating potential use for inoculant production.
Table 6. Shoot dry mass (SDM), shoot N content (SNC) and shoot N accumulation (SNA); relative efficiency (RE) and estimated N rate (END) for the first, second and third cut; and root (RDM) and nodule dry masses (NDM) for the third cut for Calopo plants grown on an unsterilized Argissolo Vermelho-Amarelo in the Zona da Mata Seca, Pernambuco
First cut Second cut Third cut
SNC SNA RE END SNC SNA RE END SNC SNA RE END RDM NDM
SDM 0.18* 0.80* 0.80* 0.93* -0.32* 0.93* 0.93* 0.95* 0.08ns 0.92* 0.92* 0.97* 0.60* 0.65*
SNC - 0.72* 0.72* 0.24* - 0.04ns 0.04ns -0.31* - 0.45* 0.45* 0.10ns 0.05ns 0.03ns
SNA - - 1.00* 0.80* - - 1.00* 0.87* - - 1.00* 0.91* 0.54* 0.59*
RE - - - 0.80* - - - 0.87* - - - 0.91* 0.54* 0.59*
END - - - 0.67* 0.61*
RDM - - - 0.26*
ns and*: not significant (p>0.05) and significant (p<0.05) correlation coefficient, according to Student’s t test.
ACKNOWLEDGEMENTS
The authors are indebted to the Brazilian Council
for Scientific and Technological Development (CNPq),
Brazilian Federal Agency for Support and Evaluation of Graduate Education (CAPES) and State of Pernambuco Research Foundation/Pernambuco State Research Support Foundation (FACEPE), for
scholarships and grants to finance this project, and
to the Agronomic Institute of Pernambuco (IAP) for the access and support of the Itambé Experimental
Station with the field work and sampling. We also thank both the ad-hoc reviewers and the technical
staff of this Journal for their collaboration in the technical review of this paper.
REFERENCES
Antunes JEL, Gomes ELF, Lopes ACA, Araújo ASF, Lyra MCCP,
Figueiredo MVB. Eficiência simbiótica de isolados de rizóbio
noduladores de feijão-fava (Phaseolus lunatus L.). R Bras Ci Solo. 2011;35:751-7.
Araújo ASF, Leite LFC, Iwata BF, Lira Junior MA, Xavier GR, Figueiredo MBV. Microbiological process in agroforestry systems. A review. Agron Sustain Dev. 2012;32:215-6.
Brasil. S.D.D. a.-M. D. a. P. E. A. Instrução Normativa nº 13,
de 24 de março de 2011. Diário Oficial da União - Seção 1, 2011.
Buso WHD, Kliemann HJ. Relações de carbono orgânico e de
nitrogênio total e potencialmente mineralizável com o nitrogênio
absorvido pelo milheto. Pesq Agropec Trop. 2003;33:97-105. Calheiros AS, Lira Junior MA, Soares DM, Figueiredo MVB. Symbiotic capability of calopo rhizobia from na agrisoil with different crops in Pernambuco. R Bras Ci Solo. 2013;37:869-76. Carvalho GGP, Pires AJV. Leguminosas tropicais herbáceas em associação com pastagens. Arch Zootec. 2008;57:103-13. Chagas Junior AF, Oliveira LA, Oliveira AN. Caracterização fenotípica de rizóbio nativos isolados de solos da Amazônia e
Companhia Nacional de Abastecimento - Conab. Insumos agropecuários [internet]. 2012 [acessed on July 16, 2012]. Available: http://consultaweb.conab.gov.br/consultas/ consultainsumo.do?method=acaocarregarconsulta.
Empresa Brasileira de Pesquisa Agropecuária - Embrapa. Manual de análises químicas de solos, plantas e fertilizantes. Rio de Janeiro; 1999.
Empresa Brasileira de Pesquisa Agropecuária - Embrapa.
Sistema brasileiro de classificação de solos. Rio de Janeiro; 2006.
Ferreira, D.F. SISVAR: Um programa para análises e ensino de estatística. R Symp. 2008;6:36-41.
Fontoura RA, Frizzo MLS, Sá ELS, Osório Filho BD, Tonon BC, Binz A, Silva MC, Camargo FAO, Selbach PA. Rizóbios nativos
do Rio Grande do Sul simbioticamente eficientes em Lotus glaber.
Ci Rural. 2011;41:440-6.
Herridge DF, Peoples MB, Boddey RM. Global inputs of biological
nitrogen fixation in agricultural systems. Plant Soil. 2008;311:1-18.
Hoagland DR, Arnon DI. The water-culture method for growing
plants without soil. Berkeley: California Agricultural Experiment
Station; 1950.
Instituto Agronômico de Pernambuco - IAP. Recomendações de adubação para o Estado de Pernambuco: 2ª aproximação. Recife; 2008.
Jacomine PKT, Cavalcanti AC, Burgos N, Pessoa SCP, Silveira CO. Levantamento exploratório - reconhecimento de
solos do Estado de Pernambuco. Recife: Superintendência do
Desenvolvimento do Nordeste; 1973.
Lima AS, Nóbrega RSA, Barberi A, Silva K, Ferreira DF, Moreira
FMS. Nitrogen-fixing bacteria communities occurring in soils
under different uses in the Western Amazon region as indicated by nodulation of siratro (Macroptilium atropurpureum). Plant Soil. 2009;319:127-45.
Lira MA, Santos MVF, Dubeux Junior JCB, Lira Junior MA, Mello ACL. Sistemas de produção de forragem: Alternativas para sustentabilidade da pecuária. In: Anais do 43º Simpósio da Reunião Anual da Sociedade Brasileira de Zootecnia, 2006; João Pessoa. João Pessoa: Sociedade Brasileira de Zootecnia; 2006. p.405-23.
Luz MJS, Ferreira GB, Bezerra JRC. Adubação e correção do solo: Procedimentos a serem adotados em função dos resultados da análise do solo. Campina Grande: Embrapa; 2002. (Circular técnica, 63).
Malavolta E, Vitti GC, Oliveira SA. Avaliação do estado nutricional das plantas. Piracicaba: Associação Brasileira para Pesquisa da Potassa e do Fosfato; 1989.
Nascimento LRS, Sousa CA, Santos CERS, Freitas ADS, Vieira
IMMB, Sampaio EVSB. Eficiência de isolados de rizóbios
nativos do agreste paraibano em caupi. R Bras Ci Agron. 2010;5:36-42.
Oliveira JP, Burity HA, Lyra MCCP, Lira Junior MA.
Avaliação da fixação e transferência de nitrogênio na
associação gramíneas - leguminosas forrageiras tropicais, através da diluição isotópica do 15N. R Soc Bras Zootec. 1996;25:210-22.
Rahmani HA, Räsänen LA, Afshari M, Lindström K. Genetic diversity and symbiotic effectiveness of rhizobia isolated from root nodules of Phaseolus vulgaris L. grown in soils of Iran. Appl Soil Ecol. 2011;48:287-93.
Rufini M, Ferreira PAA, Soares BL, Oliveira DP, Andrade MJB, Moreira FMS. Simbiose de bactérias fixadoras de nitrogênio
com feijoeiro-comum em diferentes valores de pH. Pesq Agropec Bras. 2011;46:81-8.
Ruiz HA. Incremento da exatidão da análise granulométrica do solo por meio da coleta da suspensão (silte + argila). R Bras Ci Solo. 2005;29:297-300.
Santos CERS, Stamford NP, Freitas ADS, Vieira IMMB,
Souto SM, Neves MCP, Rumjanek NG. Efetividade de rizóbios
isolados de solos da região Nordeste do Brasil na fixação do N2
em amendoim (Arachis hypogaea L.). Acta Sci. 2005;27:301-7. Soares ALL, Ferreira PAA, Pereira JPAR, Vale HMM, Lima
AS, Andrade MJB, Moreira FMS. Eficiência agronômica de
rizóbios selecionados e diversidade de populações nativas nodulíferas em Perdões (MG). II - Feijoeiro. R Bras Ci Solo. 2006;30:803-11.
Souza LAG, Bezerra Neto E, Santos CEDRS, Stamford NP. Desenvolvimento e nodulação natural de leguminosas arbóreas em solos de Pernambuco. Pesq Agropec Bras. 2007;42:207-17.
Statsoft. Statistica: Data analysis software systems. Tulsa: StatSoft; 2008.
Xavier DF, Gomes FT, Lédo FJS, Pereira AV. Eficiência de