TEMPORAL VARIABILITY OF SOIL WATER CONTENT UNDER
DIFFERENT SURFACE CONDITIONS IN THE SEMIARID
REGION OF THE PERNAMBUCO STATE
(1)Thais Emanuelle Monteiro dos Santos(2), Demetrius David da Silva(3) & Abelardo Antônio de Assunção Montenegro(4)
SUMMARY
Rainfall in the semiarid region of Pernambuco is characterized by irregular distribution in time and space, which significantly hinders the rainfed agriculture in the region. This work aims to evaluate the temporal profile of soil moisture in the semiarid region of the Pernambuco State (Brazil) and the effect of different soil surface conditions on soil water content variation and the yield of rainfed beans. To monitor soil water content, five plots 4.5 m wide by 11 m long were installed in a Yellow Argisol (Ultisol). The following treatments were adopted in the experimental plots: natural vegetation, bean intercropped with cactus, beans planted down the slope, beans planted along contour lines with mulch and rock barriers, and bare soil. In each plot, eight PVC access tubes were installed for monitoring the soil water content profile at depths of 0.20 and 0.40 m using a neutron probe device. The surface condition significantly influenced the soil water content variation, both in the dry and rainy seasons. The use of mulch, associated with rock barriers, provided higher soil water content levels than the other treatments and increased the rainfed beans production.
Index terms: moisture profile, soil cover, antecedent rainfall.
(1) Part of the Doctorate Thesis of the first author presented to the Soil Science Graduate Program of the Rural Federal
University of Pernambuco, UFRPE. Project supported by CNPq and FINEP. Received for publication in December 2009 and approved in August 2010.
(2) Doctorate Student of the Agronomy Graduate Course – Soil Science, Scholarship holder of CT-Hidro/CNPq, Rural Federal
University of Pernambuco, UFRPE. E-mail: [email protected]
(3) Associate Lecturer of the Applied Engineering Department, Federal University of Viçosa, UFV. Av. PH Rolfs s/n, CEP
36570-000 Viçosa (MG). CNPq Scholarship holder. E-mail: [email protected]
(4) Associate Lecturer of the Rural technology Department, Rural Federal University of Pernambuco, UFRPE. R. Dom Manoel de
RESUMO: VARIABILIDADE TEMPORAL DO CONTEÚDO DE ÁGUA DO SOLO, SOB DIFERENTES CONDIÇÕES DE SUPERFÍCIE, EM REGIÃO SEMIÁRIDA DE PERNAMBUCO
As chuvas na região semiárida de Pernambuco caracterizam-se pela irregularidade na distribuição no tempo e no espaço, dificultando expressivamente a agricultura de sequeiro na região. Com base nessa consideração, este trabalho objetivou avaliar temporalmente o perfil do conteúdo de água no solo do semiárido de Pernambuco, de modo a investigar o efeito de diferentes condições de superfície na variação do conteúdo de água volumétrico do solo, bem como na produtividade do feijoeiro em regime de sequeiro. Para monitoramento do conteúdo de água no solo foram implantadas cinco parcelas experimentais, com 4,5 m de largura por 11 m de comprimento, em um Argissolo Amarelo. Foram adotados os seguintes tratamentos nas parcelas experimentais: vegetação natural; feijoeiro consorciado com palma forrageira; feijoeiro cultivado morro abaixo; feijoeiro cultivado em nível, com cobertura morta e barramentos em pedras; e solo descoberto. Em cada parcela foram instalados oito tubos de acesso de PVC para determinação do perfil do conteúdo de água no solo, nas profundidades de 0,20 e 0,40 m, utilizando sonda de nêutrons. A condição de superfície influenciou expressivamente a variação do conteúdo de água no solo tanto no período seco como no chuvoso. Verificou-se, também, que a utilização de cobertura morta, associada ao emprego de barramentos em pedra, proporcionou valores mais elevados de conteúdo de água no solo e incrementou a produtividade do feijoeiro de sequeiro.
Termos de indexação: perfil de umidade, cobertura do solo, precipitação antecedente.
INTRODUCTION
Rainfall in the semiarid region of the Pernambuco State has poor distribution in time and space, with high intensity and short duration events. The rainfed agriculture in the region starts with the first rainfall events of the year, when erosive rain usually occurs. Due to the irregular rainfall distribution, the adoption of practices aiming at the conservation of the soil water content is particularly important (Santos et al., 2008).
Several studies have been published on the spatial variability pattern of soil properties, such as texture, hydraulic conductivity, and others, but little is known about their temporal variability. Nevertheless, in the last years, interest in the analysis of the temporal dynamics of the soil water content has increased (Rocha et al., 2005).
Among the alternatives available for water and soil conservation, mulching has been largely investigated. Studying the effect of conservation practices on maintaining soil water content along different phases of bean development, Santos et al. (2009) observed that the antecedent water content to rainfall was significantly higher in treatments with mulching. Sarkar & Singh (2006) observed a significant reduction in soil temperature and an increase in yield with the adoption of high density mulching, while Cook et al. (2006) reported the importance of mulching in the interception of heavy rain and in the conservation of the soil hydraulic characteristics. Chen et al. (2007) studied the effect of different vegetation types on the seasonal dynamics
of the soil water content of a semiarid region in China. They found that plots covered with native species residues presented higher mean soil water content values.
Another technique that has been used to preserve moisture and the soil, especially in the Brazilian semiarid region, is the use of rock microbarriers as a means of preventing surface runoff. This strategy contributes to conserving the soil water content and the soil itself, allowing farming to occur during the dry season (Padilha, 2000).
Cactus (Opuntia ficus-indica Mill.), known as palma forrageira, is a very common crop in the semiarid region and is used as both human and animal food. It has been largely used in conservation practices, as is the case of contour line crops, where they are cultivated in ridges for an adequate fixation, thus increasing infiltration. Despite the extensive cactus crop area in the Brazilian semiarid region, data on its efficiency for surface runoff retention in the region is scarce (Galindo et al., 2005).
Rain fed beans are largely cultivated in the semiarid region, being one of the main protein sources for families. It is grown in a number of different production systems (Farinelli et al., 2006).
Conservation studies generally focus on water and soil loss and there is a lack of research on the evaluation of the influence of the soil water content on these processes, mainly in the semiarid region.
surface conditions and their effects on the soil water content variation, as well as on the bean yield, were investigated.
MATERIALS AND METHODS
Characterization of the study area
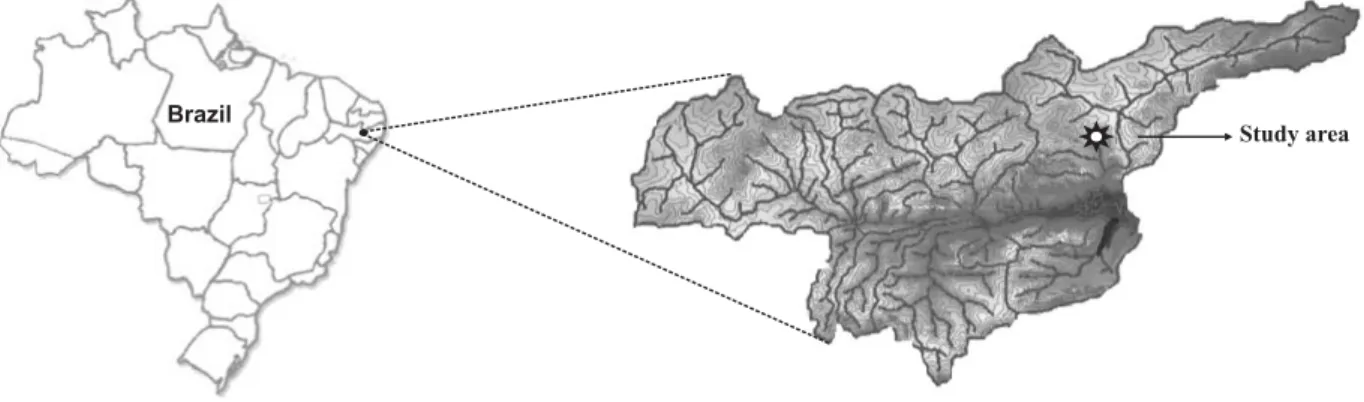
This study was conducted in the municipality of Pesqueira, Pernambuco State, in the representative basin of Alto Ipanema (Figure 1), with an area of 183 km2, located in the semiarid Agreste Region, between 8 ° 34 ’ 17 ” and 8 ° 18 ’ 11 ” latitude South and 37 ° 1 ’ 35 ” and 36 ° 47 ’ 20 ” longitude West. The climate is steppe-type semiarid, very hot, according to Köeppen. The annual mean rainfall is 607 mm, mean temperature of 23 ºC and the potential evapotranspiration is about 2,000 mm per year. The dominant vegetation is hypoxerophilous caatinga (Montenegro & Montenegro, 2006).
Description of the experiment
The experiment was conducted on a hillslope of the basin with a 5 % slope. The soil of the area was classified as abruptic eutrophic Yellow Argisol (Embrapa, 1997). The physical characteristics of the soil are given in table 1.
Five experimental plots 4.5 m wide and 11 m long were marked with a single brick wall (Figure 2). Each plot had eight PVC access tubes installed 2 m apart
from each other. Due to the depth of the impervious layer of the profile, the access tubes were installed mainly up to 50 cm depth, and the depths for analysing the soil water content were 0.20 and 0.40 m. The soil water content was monitored every 15 days from February to October 2009 using a neutron probe device model CPN 503 DR. The neutron probe readings were converted into soil water volumetric content based on pre-established calibration curves plotted for the experimental area soils.
The following experimental plot treatments were adopted: Natural Vegetation (NV), beans intercropped with cactus (BC), bean plant spacing of 0.25 m and inter-row spacing of 0.5 and 3.0 m between double rows to allow a surface runoff contention barrier; beans planted down the slope (DSB), contour line beans with mulch and rock barrier between rows approximately 0.08 m high (CB+RB+M), and bare soil (BS). Beans
(Phaseolus vulgaris L.) were cultivated from April
20th to July 7th with spacing of 0.5 x 0.25 m. Bean straw was used as mulch in CB+RB+M with 3.2 Mg ha-1 density.
The mulch percentage was evaluated in three repetitions in the same period of soil water content, monitored by the Mannering method (Rizzard & Fleck, 2004; Bertol, 2005; Bezerra & Cantalice, 2006; Santos et al., 2008), which uses the projection of a picture frame with the mulch area on a standard square. The sum of the number of intersections with the projected surface mulch points (canopy/residue) gives the total soil mulch area, each point of the intersection representing 2 % of the total area.
Table 1. Physical characteristics of the Argisol of the experimental area
(1) CDW: Clay-dispersed in water. (2) Pd: particle density. (3) Sd: soil density. Embrapa (1997).
Bean yield was determined for treatments BC, DSB and CB+RB+M by collecting pods from four plant rows, corresponding to an area 4.5 m wide and 1.5 m long, from the upper, middle and lower parts of each experimental plot, comprising an area of 20.25 m2. Grains were separated from the pods and the wet mass was determined, with 13 % moisture, and the data were extrapolated to 1 ha. The mean data were submitted to variance analysis and compared by Tukey’s test at 5 % significance level.
An automatic raingauge, model TB4-L Rain Gauge from Campbell Scientific, resolution of 0.254 mm, was installed near the experimental area. The device has a datalogger, which was programmed to take regular records every 5 min during rainfall. The rainfall data were grouped for seven and 15 day periods prior the soil water content readings, using the neutron probe device, in order to investigate the relationship between the soil water content variations and the antecedent rainfall.
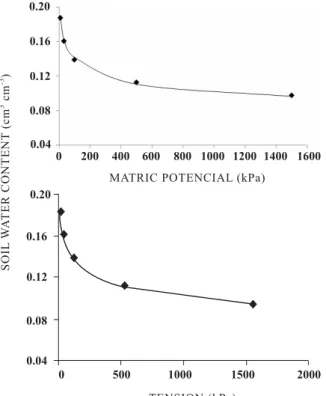
At a site close to the experimental area, a trench was opened for soil classification and for soil water retention curve determination. Undisturbed samples were collected using metal rings with 0.5 m diameter and 0.015 m height. Samples were taken in three repetitions from the three layers where the soil water content was monitored. A Richards’ pressure chamber (Richards, 1965) from the Soil Physics Department of the Agricultural Engineering Department of the Federal University of Viçosa was used to relate the soil water volumetric content with the matric potentials of -10, -33, -100, -500, and -1,500 kPa. The retention curves were adjusted to the van Genuchten (1980) model using the software Statistica 6.0 (STATSOFT, 2001). Determination coefficients of 0.97 and 0.98 were found for the depths of 0.20 and 0.40 m, respectively. Figure 3 displays the resulting retention curves.
At the matric potentials corresponding to field capacity and wilting point at the 0.20 m depth, soil water content values were 0.161 and 0.096 cm3 cm-3 for comparison of the mean for the treatments, Tukey’s
Figure 2. Details of the experimental plots. DSB: beans planted down the slope, BC - beans intercropped with cactus, BS: bare soil, NV: natural vegetation, CB+RB+M: contour line beans with rock barrier and mulch.
The temporal distribution of the soil water content in the 0–0.20 m layer for different soil surface conditions is shown in figure 5. Table 2 gives the statistical analysis of the mean soil water content values for the different treatments, as well as the antecedent rainfall. It can be seen in table 2 that at the beginning of the study period the soil water content was very low in all treatments (Figure 3), except for the CB+RB+M treatment, which had a slightly higher water content and was statistically different from the BS and the NV treatments.
In the week before the Feb. 17th monitoring, rainfall was 18.8 mm (Table 2). On Feb 13th it lasted 1:30 h, but it did not contribute to an effective increase in the soil water content, as the soil water deficit was significant. In the same period, the NV treatment had the lowest water content, probably due to the higher evapotranspiration rate for such soil surface condition.
For the moisture measurement on April 12th, 2009, the 15 day antecedent rainfall was 37.59 mm and there was an increase in the soil water content for all treatments. There was no significant difference between treatments at 5 %. On April 23, 2009, after approximately 20 days without antecedent rainfall, the soil water content decreased by 46, 19, 14, 28, 28 % for NV, BC, CB+RB+M, DSB, and BS treatments, respectively. The soil water content became very low again and the NV treatment had the lowest value, which was statistically different from the other treatment results, with a higher percentual reduction as a result of evapotranspiration.
Table 2 shows that the soil water content remained very low at least three months during the study period. It is worth pointing out that the period after monitoring is characterized by the absence of rainfall in the region (dry period) and the soil water condition is below the wilting point. Cassel & Nielsen (1986) reported that the top layer might dry, reaching soil water content values close to the residual value due to evaporation, while the deeper layers kept higher water availability. This is demonstrated by the water contents at the 0.40 m depth, which is close to field capacity (0.15 cm3 cm-3).
test was used at a 5 % level of significance. The statistical package adopted was SAS - Statistical Analytical System (SAS, 1998).
The soil water content calculation corresponds to each matric tension in the Richards chamber in regular intervals of approximately 24 h, determined based on the method proposed by Embrapa (1997).
To observe the variability of the soil water content in the plot, the temporal stability of the measurements at the installed access tubes was analyzed by the Vachaud et al. (1985) method, according to equation 1.
(1)
where RD is the relative difference between the individual moisture determination for a site i at time j and its estimated mean, θijis the water content at the site i at time j, is the mean water content for all locations at time j. The standard deviations related to the spatial variations were also determined.
Statistical analysis
The experimental design was fully randomized and the data were submitted to variance analysis. For comparison of the mean for the treatments, Tukey’s test was used at a 5 % level of significance. The statistical package adopted was SAS - Statistical Analytical System (SAS, 1998).
The moving average was calculated for trend analysis assessment. In such cases, mean values of three subsequent soil water content measurements of each treatment was used (Morettin et al., 2006).
RESULTS AND DISCUSSION
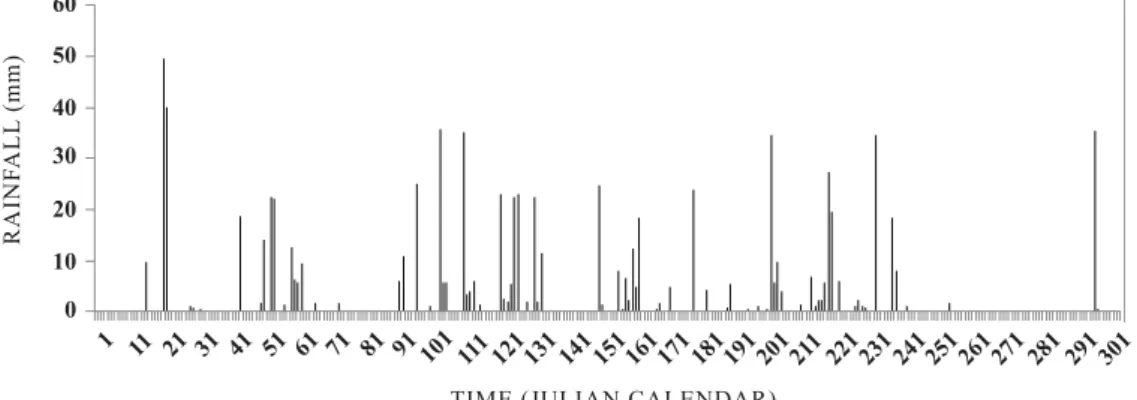
Figure 4 shows the temporal rainfall distribution from January to October 2009. The total rainfall in this period was 802.43 mm. Months with the highest rainfall were April, May, and August, while March and September had the lowest total rainfall.
Table 2. Mean volumetric water content values in the abruptic eutrophic Yellow Argisol under different surface conditions in different monitoring periods at 0.20 and 0.40 m depths, and total antecedent rainfall (which occurred 15 and 7 days before soil water content measurements)
(1) Means followed by small letters in the same line are not statistically different at 5 % by Tukey’s test. NV: natural vegetation,
BC: beans intercropped with cactus, DSB: beans planted down the slope, CB+RB+M: contour line beans with rock barrier and mulch, and BS: bare soil.
The 42.4 mm rainfall distributed in the seven days prior to monitoring on April 8th resulted in an increase in the soil water content in all treatment conditions at 0.40 m depth. Although treatment NV had the lowest soil water content in the 0.20 m layer, it had the greatest increase in the soil water content in the 0.40 m depth, demonstrating the efficiency of mulching in increasing water infiltration into the profile. It worked as a barrier to free water flow due to the increase in the surface roughness.
At the 0.40 m depth, soil has a higher clay content than the 0.20 m depth (Table 1). According to Reichardt (1990), one of the main factors affecting soil water retention is soil texture, as it determines the contact area between the solid particles and the water. Buckman & Brady (1979) mentioned that sand has reduced water retention capacity due to its large space between granulometric particles and the quick water percolation flow.
In the interval of 15 days after monitoring on April 8th, rainfall was 62.15 mm. As the rain was better distributed in this period, that is, it had a higher frequency, the soil water content increased in all treatments. DSB presented the lowest value, which was statistically different from the others.
The higher rainfall observed in May, 105.41 mm, resulted in significant increase in the soil water content in all studied plots. The NV treatment soil water content remained significantly higher than those at the other plots from May to July. Similar results were found by Wagner Junior et al. (2006). They evaluated the influence of four soil mulching management methods on the soil water content on Okinawa peach rootstock. They found that the soil water content was higher in the treatment with spontaneous vegetation and between plantation rows, demonstrating that the permanence of the spontaneous vegetation mulch allowed a higher capacity of soil water content conservation and a lower water loss than the other treatments.
Despite the antecedent rainfall of 58.92 mm for the August 12th 2009 monitoring, soil water content decreased. This can be explained by the lack of rainfall four days before monitoring, which surely contributed to the soil water content deficit increase.
At the end of the rainy period, the soil moisture values tended to decrease and the evapotranspiration effect on the NV condition was again observed, producing significantly lower moisture values, both in the 0.20 and the 0.40 m depths. Similar results were reported by Ampofo (2006) in a study of different types of soil mulch impact in the water content conservation in Ghana. This author reported that the soil surface layer with mulch had lower soil water content due to evapotranspiration, which did not occur for the bare soil treatment.
Comparison of the treatment with mulch, CB+RB+M (3.2 Mg ha-1 rate) with the treatment without mulch, DSB, the soil water content was preserved in the end of the rainy period for the first treatment, with a statistical difference. After 45 days without rainfall, the plot under treatment CB+RB+M had 45 % loss of water content, while for the DSB the loss was 52 %.
Costa et al. (2003) also found higher soil water content values for direct plantation as a soil and water conservation method than the conventional tillage method, which was attributed to lower evaporation resulting from mulching. In contrast, Mulumba & Lal (2008) found a significant increase in the soil water content by using 2 Mg ha-1 mulch in a study adopting different mulch densities in a wheat plantation in Ohio.
The moving average analysis for moisture (Figure 6), which gives the temporal variability trends, demonstrates the occurrence of higher water content values for the NV treatment, followed by the CB+RB+M, in the rainy period, between days 97 and 227 (early August) (Figure 5, Table 2).
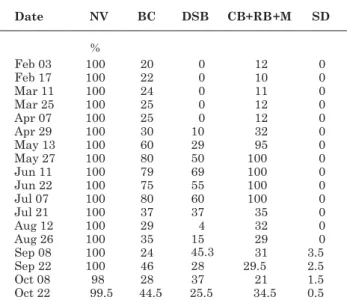
Table 3 gives the cover index data for the different treatments, corresponding to 100 % for the NV treatment. This index can explain the lower water content found in this treatment on February 2nd, which was attributed to plant transpiration and agrees with the result reported by Ampofo (2006) of soil water loss by evapotranspiration of 30 % of the total rainfall loss in the semiarid region.
Similar results were found by Mello et al. (2007), studying the impact of different land use scenarios of a basin in the Lavras region, State of Minas Gerais. They observed a reduction in the soil water content resulting from a short summer combined with the increase in the eucalyptus cultivation area.
In relation to the temporal stability of the soil water content in the several access tubes, relative differences (RD) were estimated, and the central regions of the plots had a higher stability (values closer to the mean at any time) and a smaller standard deviation, equal to 0.2. This indicates that such places in the plots are subject to more gradual variations on soil water content, both during wetting and drying events, allowing regions of higher similarity in relation to the mean water content of the entire plot to be identified.
A positive effect on yield was observed by using conservation practices, as productivity of the soil treated with CB+RB+M was higher than the others, probably because of mulching (Table 4). DSB presented yield reductions of 61.2 and 39.3 % in
relation to the CB+RB+M and BC treatments, respectively. Bean yield values for treatments CB+RB+M and BC were higher than the national average of 1,100 kg ha-1 in 2006/2007 (Yamaguishi, 2008).
CONCLUSIONS
1. The soil surface condition had an expressive influence on the soil water content variation, both in the dry and the rainy periods.
2. The presence of natural vegetation contributed to retain larger water contents in the soil than the other treatments, during the entire rainy period.
3. The effect of mulching for evapotranspiration was significant in the dry period.
4. Mulching, associated with rock barriers, allowed higher water content retention in soil than the other treatments and increased the dry season bean yield.
ACKNOWLEDGEMENTS
To CNPq, FACEPE and FINEP for the financial support and the revisers who contributed to improve the quality of this manuscript.
LITERATURE CITED
AMPOFO, E.A. Soil moisture dynamics in Coastal Savanna soils in the tropics under different soil management practices. Hydrol. Sci. J., 51:1194-1202, 2006.
BERTOL, O.J. Contaminação da água de escoamento superficial e da água percolada pelo efeito de adubação mineral e adubação orgânica em sistema de semeadura direta. Curitiba, Universidade Federal do Paraná, 2005. 209p. (Tese de Doutorado)
BEZERRA, S.A. & CANTALICE, J.R.B. Erosão entre sulcos em diferentes condições de cobertura do solo, sob o cultivo da cana-de-açúcar. R. Bras. Ci. Solo, 30:565-573, 2006.
Table 4. Bean yield for the different treatments
Means followed by small letters in the same column are not statistically different at 5 % by Tukey’s test. CB+RB+M: contour line beans with rock barrier and mulch, BC: beans intercropped with cactus, and DSB: beans planted down the slope.
Table 3. Soil cover index for the treatments analyzed during the soil water content monitoring period
BUCKMAN, H.O. & BRADY, N.C. Natureza e propriedade dos solos. 5.ed. Rio de Janeiro, Freitas Bastos, 1979. 647p. CASSEL, D.K. & NIELSEN, D.R. Field capacity and available water capacity. In: KLUTE, A., ed. Methods of soil analysis: Physical and mineralogical methods. 2.ed. Madison, Soil Science Society of America, 1986. p.901-926.
COSTA, F.S.; ALBUQUERQUE, J.A.; BAYER, C.; FONTOURA, S.M.V. & WOBETO, C. Propriedades físicas de um Latossolo Bruno afetadas pelos sistemas plantio direto e preparo convencional. R. Bras. Ci. Solo, 27:527-535, 2003.
COOK, H.F.; VALDES, G.S.B. & LEE, H.C. Mulch effects on rainfall interception, soil physical characteristics and temperature under Zea mays L. Soil Till. Res., 91:227-235, 2006.
CHEN, L.; HUANG, Z.; GONG, J.; FU, B. & HUANG, Y. The effect of land cover/vegetation on soil water dynamic in the hilly area of the loess plateau, China. Catena, 70:200-208, 2007.
EMPRESA BRASILEIRA DE PESQUISA AGROPECUÁRIA -EMBRAPA. Centro Nacional de Pesquisa de Solos. Manual de métodos de análise de solo. 2.ed. Rio de Janeiro, 1997. 212p. (Documentos, 1)
FARINELLI, R.; LEMOS, L.B.; PENARIOL, F.G.; EGÉA, M.M. & GASPAROTO, M.G. Adubação nitrogenada de cobertura no feijoeiro, em plantio direto e convencional. Pesq. Agropec. Bras., 41:307-312, 2006.
GALINDO, I.C.L.; SAMPAIO, E.V.S.B. & MENEZES, R.S.C. Uso da palma na conservação dos solos. In: MENEZES, R.S.C.; SIMÕES, D.A. & SAMPAIO, E.V.S.B., eds. A palma no Nordeste do Brasil: Conhecimento atual e novas perspectivas de uso. Recife, Universitária, 2005. p.163-176.
MELLO, C.R.; LIMA, J.M. & SILVA, A.M. Simulação do deflúvio e vazão de pico em microbacia hidrográfica com escoamento efêmero. R. Bras. Eng. Agric. Amb., 11:410-419, 2007.
MONTENEGRO, A.A.A. & MONTENEGRO, S.M.G.L. Variabilidade espacial de classes de textura, salinidade e condutividade hidráulica de solos em planície aluvial. R. Bras. Eng. Agric. Amb., 10:30-37, 2006.
MORETTIN, P.A. & TOLOI, C.M.C. Analise de séries temporais. 2.ed. São Paulo, Edgard Blucher, 2006. 535p. MULUMBA, L.N. & LAL, R. Mulching effects on selected soil
physical properties. Soil Till. Res., 98:106-111, 2008.
PADILHA, J.A. Base zero ano 2000: Mudança de paradigma na produção agroambiental nos trópicos secos. In: LEITE, P.S.L.; PEIXOTO, A.B.; MAGALHÃES, A.R.; MIRANDA, C.; TEÓFILO, E.; AMSBERG, J. VON & SANT’ANNA, S., eds. Reforma agrária e desenvolvimento sustentável. Brasília, Ministério do Desenvolvimento Agrário/ NEAD, 2000. p.239-309.
REICHARDT, K. A água em sistemas agrícolas. São Paulo, Editora Manoele Ltda, 1990. 188p.
RICHARDS, L.A. Physical conditions of water in soil. In: BLACK, C.A., ed. Methods of soil analysis. Madison, America Society of Agronomy, 1965. p.128-152. RIZZARDI, M.A. & FLECK, N.G. Métodos de quantificação da
cobertura foliar da infestação de plantas daninhas e da cultura de soja. Ci. Rural, 34:13-18, 2004.
ROCHA, G.C.; LIBARDI, P.L.; CARVALHO, L.A. & CRUZ, A.C.R. Estabilidade temporal da distribuição espacial da armazenagem de água em um solo cultivado com citros. R. Bras. Ci. Solo, 29:41-50, 2005.
SANTOS, T.E.M.; MONTENEGRO, A.A.A.; SILVA JUNIOR, V.P. & MONTENEGRO, S.M.G.L. Erosão hídrica e perda de carbono orgânico em diferentes tipos de cobertura do solo no semiárido, em condições de chuva simulada. R. Bras. Rec. Hidr., 13:29-34, 2008.
SARKAR, S. & SINGH, S.R. Interactive effect of tillage depth and mulch on soil temperature, productivity and water use pattern of rainfed barley (Hordiumvulgare L.). Soil Till. Res., 92:79-86, 2007.
SAS Institute. The SAS System for windows: Release version: 6.8, 3.ed. Cary, 1998. CD-ROM.
STATSOFT. Statistica: Data analysis software system; version 6. [S. L.], 2001.
VACHAUD, G.; PASSERAT DE SILANS, A.; BALABANIS, P. & VAUCLIN, M. Temporal stability of spatially measured soil water probability density function. Soil Sci. Soc. Am. J., 49:822-827, 1985.
van GENUCHTEN, M.T. A closed-form equation for predicting the hydraulic conductivity of unsaturated soils. Soil Sci. Soc. Am. J., 44:892-898, 1980.