http://www.uem.br/acta ISSN printed: 1679-9275 ISSN on-line: 1807-8621
Acta Scientiarum
Doi: 10.4025/actasciagron.v36i4.18342
Moisture content effect in the relationship between apparent
electrical conductivity and soil attributes
Marcelo Marques Costa1*, Daniel Marçal de Queiroz1, Francisco de Assis de Carvalho Pinto1, Elton Fialho dos Reis2 and Nerilson Terra Santos3
1
Departamento de Engenharia Agrícola, Universidade Federal de Viçosa, Av. P. H. Rolfs, s/n, 36570-000, Viçosa, Minas Gerais, Brazil.
2
Departamento de Engenharia Agrícola, Universidade Estadual de Goiás, Anápolis, Goiás, Brazil. 3Departamento de Estatística, Universidade Federal de Viçosa, Viçosa, Minas Gerais, Brazil. *Author for correspondence. E-mail: [email protected]
ABSTRACT. To map the spatial variability of a field to define the variable rate application, an intensive sampling of the soil-plant system is necessary. The apparent soil electrical conductivity (ECa) has been used for soil mapping because it correlates well with soil attributes, allows for dense sampling and can be obtained at low cost. However, ECa is influenced by soil moisture content, and the variability of this attribute can reduce the reliability of the ECa maps to explain the physical and chemical soil attributes. The objective of this study was to identify conditions that maximize the correlations between the ECa and the soil attributes. The results show that the mean soil moisture content of soil sampled on different dates was correlated with the mean of the ECa. The ideal time for measuring ECa occurred when the mean moisture content of the soil was higher. In this condition, the coefficient of variation for the soil moisture content was lower, there was no correlation between ECa and soil moisture content, and ECa was more correlated with other soil attributes evaluated in this work.
Keywords: precision agriculture, temporal variability, soil moisture content.
Efeito do teor de água na relação entre a condutividade elétrica aparente e atributos do solo
RESUMO. Para mapear a variabilidade espacial de um campo e definir a aplicação em taxa variável, uma amostragem intensiva do sistema solo-planta é necessária. A condutividade elétrica aparente do solo (ECa) tem sido utilizada para o mapeamento do solo, pois correlaciona-se bem com os atributos do solo, permite a amostragem densa e pode ser obtida a baixo custo. No entanto, o ECa é influenciada pelo teor de água do solo, e a variabilidade desse atributo pode reduzir a confiabilidade dos mapas de ECa para explicar os atributos físicos e químicos do solo. O objetivo deste estudo foi identificar as condições que maximizem as correlações entre a ECa e os atributos do solo. Os resultados mostram que o teor de água médio do solo amostrado em diferentes datas foi correlacionado com a média da ECa. O momento ideal para medir ECa ocorreu quando o teor de água médio do solo foi mais elevado. Nesta condição, o coeficiente de variação para o teor de água do solo foi menor, não houve correlação entre ECa e o teor de água do solo, e ECa foi mais correlacionado com outros atributos do solo avaliados nesse trabalho.
Palavras-chave: agricultura de precisão, variabilidade temporal, umidade do solo.
Introduction
Precision farming involves the management of crops in consideration of spatial variability. This spatial variability is generally represented by maps of variables associated with the soil-plant system. Generally, to obtain these maps, a large number of samples are necessary to accurately represent the variability. The cost of soil analysis limits denser sampling, which may result in less accurate maps. Therefore, researchers have been investigating indirect methods that have lower costs and present high correlation with variables of agronomic interest. For this purpose, the apparent soil electrical conductivity (ECa) has been widely accepted in precision agriculture. ECa is a geophysical method used
to characterize the physical and chemical soil variability, and it has been used to delimit management zones (HOSSAIN et al., 2010; LÜCK et al., 2009).
Ekwue and Bartholomew (2010) observed in their experiments a strong positive correlation between the ECa and the soil moisture content for three soil types evaluated in laboratory and field conditions. In the midwest of the United States, Brevik et al. (2006) monitored the ECa and volumetric moisture content of soil from June 1999 to October 2000 and concluded that ECa is strongly influenced by soil moisture content. The same authors stated that the soil moisture content should be considered in the investigation of ECa and recorded in the reports generated. This approach suggests that the spatial variability of the soil moisture content at different sampling leads to a variability in the ECa maps that is not due to soil properties, but to the variation of moisture water, which can result in a low repeatability of the measurements. Thus, the comparison of maps of ECa collected under different conditions of moisture content may not provide reliable information about the variability of soil physical and chemical attributes.
The soil moisture content varies in time and space, and this variability may be the main cause of the ECa variability. Therefore, if at ECa data acquisition the soil moisture content presents a large spatial variability, the obtained ECa values may have a low correlation with the soil properties. According to Lück et al. (2009), the soil moisture content affects both the level and the range of the variation of ECa, and to generate reliable maps, the authors suggest the use of a system of multiple sensors that can adjust the ECa measured with different levels of soil moisture.
Rhoades et al. (1989) suggested that ECa should be measured when the soil has a moisture content close to its field capacity. In this situation, the ECa value is approximate to the soil electrical conductivity of the saturation extract. The authors state that in this condition, the soil moisture content tends to be more spatially homogeneous. However, it is difficult to know whether the soil moisture content is sufficiently close to the field capacity at the time of sampling. Another problem is that corn and soybean planting in Brazil starts as soon as there is enough water content in the soil for seed germination, which is especially true in regions where the rainy season allows two crops per year and farmers need to start planting just after the ideal soil moisture content is reached. After planting, the ECa measurement equipment, which is pulled by a tractor, has restricted access due to the mechanical damage caused to plants. During crop development, the ECa can be measured with portable devices by using scouting techniques.
The hypothesis of this work is that the soil moisture content is a determining factor for ECa; however, when the mean soil moisture content is high, its variability in the field is smaller. Thus, the ECa values, measured when the soil moisture content is higher, should have a low correlation with the soil moisture content and a higher correlation with the soil attributes that define the total amount of available charges in the soil. The objective of this study is to identify the conditions in which an ECa sample is more correlated with soil physical and chemical attributes.
Material and methods
The study was performed in a 75 ha field at a farm located in Goianapolis, Goias State, midwest region of Brazil. The study area can be viewed at the coordinates 16° 27' 48" S, 48° 59' 38" W. According to the Köppen classification, the climate is tropical and is designated as Cwa. The altitude is 1017 m above sea level, and the mean annual rainfall is 1400 mm. The soil in the study area is classified as ‘Latossolo Vermelho Amarelo’ according to the Brazilian soil classification system (EMBRAPA, 2006). In the 2009/2010 crop year, the field was planted with corn, and in the 2010/2011 crop year, the field was planted with soybeans.
Data acquisition
The limits of the field were obtained using a Magellan Promark III DGPS. The differential correction was post-processed using a database of the Brazilian Institute of Geography and Statistics (IBGE), located in Brasilia. With the aid of GIS, a regular grid of points was created within the field for ECa measurement as well as for collecting samples for soil moisture content determination and for measuring soil physical and chemical attributes, as shown in Figure 1. The mesh were consisted of two points per hectare, resulting in a total of 150 points for collecting samples for determination of soil physical and chemical attribute, at the onset of the rainy season . Later, the ECa data and moisture content soil were acquired on five different days:
November 11th, 2010; November 23rd, 2010;
Moisture effect on soil electrical conductivity 397
content soil was measured in the same 30 points for five sampling dates.
Figure 1. Location of the points for ECa measurement, for collecting samples for moisture content and for physical and chemical soil attribute determination.
A Landviser LandMapper ERM 02 handheld device was used to measure the soil apparent electrical conductivity. This device uses the principle of electrical resistivity (ER), which is measured by four-electrode contact with the soil. The Wenner array configuration of the electrodes, in which the electrodes are arranged in lines and equally spaced, was used as described by Corwin and Lesch (2003). The space between each pair of electrodes was set to 0.20 m; therefore, the ECa measurements correspond to the apparent electrical conductivity of the soil for a depth of 0 to 0.20 m. For each point, five measurements were performed randomly at a distance of up to 5 m from the point. During the measurement of Eca, soil samples were collected in the layer from 0 to 0.20 m and packed in sealed container with lid, for soil moisture determination. The gravimetric moisture of soil was determined at dry basis by the standard method of greenhouse. In this method, the mass of water is obtained from the difference between the mass of soil moist and the mass of soil dried at oven, a temperature of 105°C for 48 hours. The moisture content of the soil is represented by the percentage weight of water relative to the mass of dry soil sample.
The soil samples for chemical and physical analysis were collected using an auger soil sampler for the depth from 0 to 0.20 m. Each sample was
composed of 10 sub-samples collected at a distance of up to 5 m from the point. The chemical analysis consisted of the determination of the following: pH, potential acidity (H + Al), Ca2+, Mg2+, K, P, Al3+, remaining P, organic matter content, sum of bases (SB), cation exchange capacity at pH 7 (CEC), base saturation (V) and the levels of Zn, Fe, Mn and Cu. The physical analysis consisted of the determination of clay, silt and sand content.
Data analysis
First, data related to the soil attributes were analyzed using summary statistics, not considering the spatial distribution. The following parameters were calculated: mean, standard deviation, maximum and minimum values and coefficient of variation (CV). This analysis allowed a general evaluation of the soil fertility, characterizing it according to the mean values of its physical, chemical and physico-chemical attributes.
After performing the summary statistics, a Pearson correlation analysis was used to test the hypothesis of this work. For this purpose, was used the SAS (2008) statistical software. The correlation between the mean values of ECa and the mean values of soil moisture content using the data of five sampling dates was found. To check whether the soil moisture content showed a greater variability in the field when the samples were collected under conditions of lower moisture content, a correlation analysis between the mean values of the soil moisture content and their coefficients of variation, including all five dates of collection, was performed.
For each date, a file with 30 data points of soil moisture content and ECa was generated. Therefore, it was possible to perform a correlation analysis between the ECa and the soil moisture content for each sampling date. It was then possible to test the hypothesis that a weaker correlation between the ECa and the soil moisture content occurs when the mean soil moisture content is higher. The hypothesis that ECa is more correlated with soil attributes when it is less correlated with soil moisture content was verified by the correlation between the soil properties and ECa on the different dates.
Results and discussion
Table 1. Summary statistics of soil attributes.
Variable Unit Mean
Value
Standard Deviation
Minimum Value
Maximum Value
Coefficient of Variation (%)
pH 1 6.74 0.30 5.80 7.30 4.41
P 2
mg dm
-³ 6.70 3.63 1.70 18.40 54.12
K 3 mg dm-³ 52.20 14.12 24.00 108.00 27.04
Ca2+ 4 cmolc dm-³ 3.24 0.44 1.90 4.20 13.70
Mg2+ 5
cmolc dm
-³ 0.83 0.12 0.60 1.20 15.12
Al3+ 6 cmolc dm-³ 0,00 0,00 0,00 0,00 0,00
H + Al 7
cmolc dm
-³ 1.70 0.90 0.33 5.61 52.61
SB 8 cmolc dm -³ 4.20 0.53 2.63 5.24 12.56
CEC 9 cmolc dm -³ 5.90 0.84 4.17 9.89 14.32
V 10
% 72.13 11.05 37.00 93.00 15.32
OM 11 dag kg-1 3.04 0.30 2.50 4.30 9.73
P_rem 12
mg L-1
17.45 3.37 9.50 27.40 19.30
Zn 13 mg dm-³ 3.73 2.21 1.50 19.90 59.28
Cu 14 mg dm-³ 1.33 0.60 0.80 6.70 45.02
Fe 15
mg dm
-³ 21.97 5.58 11.00 41.10 25.41
Mn 16 mg dm-³ 26.89 9.05 13.70 66.70 33.67
B 17
mg dm
-³ 0.26 0.09 0.10 0.50 34.36
S 18 mg dm-³ 11.38 2.39 6.60 25.60 21.04
Clay content % 32.97 3.28 26.00 43.00 9.95
Silt content % 10.64 2.98 6.00 20.00 28.00
Sand content % 56.38 4.40 45.00 65.00 7.81
ECe1:5 19 μ
S cm-1
72.45 11.54 49.42 106.30 15.93
1pH, active acidity in water; 2P, phosphorous; 3K, potassium; 4Ca2+, calcium; 5Mg2+, magnesium; 6Al3+, exchangeable acidity; 7H + Al, potential acidity; 8SB, exchangeable sum of bases; 9CEC, cation exchangeable capacity at pH 7; 10V, basis saturation; 11OM, organic matter; 12P-rem, remaining phosphorous; 13Zn, Zinc; 14Cu, copper; 15Fe, iron; 16Mn, manganese; 17B, boron; 18S, sulfur; 19ECe1:5, electrical conductivity of soil extract at 1:5.
Consequently, the soil presents an mean pH close to neutral. Under these conditions of low acidity, Al is fully neutralized and has zero value. High pH values reduce the availability of some micronutrients, such as Fe, Cu, Mn and Zn. Foliar fertilization is required to meet the plants’ need for these micronutrients. It can also be observed that clay and sand contents present low variability in the field, expressed by the low coefficient of variation.
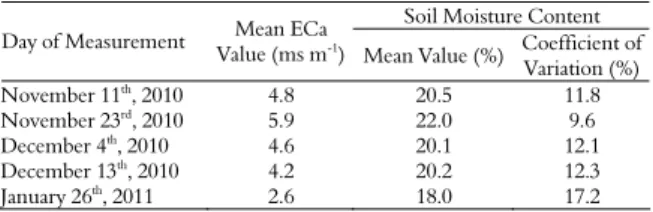
To characterize the conditions of moisture content during the ECa measurements, soil samples were collected for soil moisture content determination. The mean values of ECa and soil moisture content, as well as the coefficient of variation for the moisture content, are presented in Table 2.
Table 2. Mean values of soil moisture content and apparent soil electrical conductivity (ECa) measured on different dates.
Soil Moisture Content Day of Measurement Mean ECa
Value (ms m-1
) Mean Value (%) Coefficient of Variation (%)
November 11th, 2010 4.8 20.5 11.8
November 23rd
, 2010 5.9 22.0 9.6
December 4th, 2010 4.6 20.1 12.1
December 13th, 2010 4.2 20.2 12.3
January 26th, 2011 2.6 18.0 17.2
The correlation coefficient between the mean ECa values and the mean soil moisture content was 0.989, and the probability of correlation to be equal to zero was less than 0.001. This result shows that in the study area, higher ECa values were obtained when the mean soil moisture content was higher and that there is a strong correlation between the two attributes. Ekwue and Bartholomew (2010) obtained similar results when evaluating the
relationship between the ECa and moisture content in field and laboratory conditions for three soil types.
The correlation coefficient between the mean values of soil moisture content and their coefficient of variation was -0.985. The negative correlation indicates that when the moisture content was higher, its variability was lower in the field. Thus, the condition that resulted in a more homogenous soil moisture content occurred on November 23rd, 2010, which was the day with the highest mean moisture content value. Scherpinski et al. (2010), when analyzing the spatial variability of soil hydraulic conductivity and soil water infiltration, observed a moderate spatial dependence with a range of 96.22 and 206.32 m, respectively. Starting from an initial condition in which the soil moisture content is equivalent to the field capacity, the spatial variability of physical-hydric attributes indicates that as the soil looses water, the variability of the moisture content becomes higher.
Some regions lose water faster than others, causing a greater variability in soil moisture as the soil dries. The correlation coefficients between the soil moisture content and the ECa values are presented in Table 3. The table shows the change in the coefficient of correlation between these attributes and associations with the variability of soil moisture content.
Moisture effect on soil electrical conductivity 399
of ECa. Thus, the ECa sampling conducted on January 26th, 2011, would be more appropriate because it showed a higher correlation with the soil water content. The highest correlation coefficient between ECa and the soil moisture content was observed on this date (Table 3). This observation is justified because the soil attributes that have the greatest effect on the response of rainfed crops are those that control the soil’s ability to retain water and, therefore, its availability; these attributes include soil texture and organic matter, topography and type of vegetation cover (GUASTAFERRO et al., 2010; MORAL et al., 2010).
Table 3. Correlation coefficients between apparent soil electrical conductivity and soil moisture content for each day of measurement.
Date r p –value
November 11th, 2010 0.34 0.146
November 23rd, 2010 0.10 0.671
December 4th
, 2010 0.43 0.060
December 13th, 2010 0.56 0.010
January 26th, 2011 0.69 0.001
r – correlation coefficient; p-value – probability of accepting H0 (r = 0).
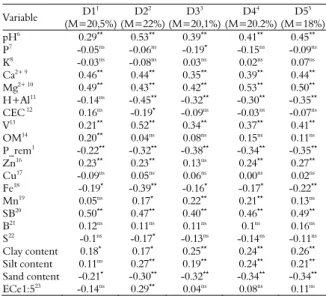
The results presented in Table 3 indicate that the lowest coefficient of correlation between soil moisture content and soil ECa was obtained on November 23rd, 2010, which had the highest mean soil moisture content (Table 2). This result implies that the ECa sampled on that day presented a higher correlation with soil properties because the variability of the moisture content did not significantly influence the variability of the ECa. The coefficients of correlation between the ECa and the physical and chemical attributes of the soil were performed using the 150 data points, and the results are presented in Table 4.
On November 23rd, 2010, the day with the
highest mean soil moisture content, there was no significant correlation between soil moisture content and ECa values. Of the 23 soil attributes evaluated, the ECa was significantly correlated with 18 of them. For the other four dates, the highest number of significant correlations between ECa and the soil attributes evaluated was 14. The highest correlation coefficient (r) was 0.53, and this value was observed
on November 23rd, 2010, for the correlation
between the ECa and the soil pH and on December 13th, 2010, between the ECa and Mg. The second highest value was 0.52, also observed on November 23rd, 2010, for the correlation between the ECa and base saturation. ECa was significantly correlated with the soil electrical conductivity of saturation extract and the total cation exchange capacity only on November 23rd, 2010, which is in agreement with the results presented by Rhoades et al. (1989).
Table 4. Correlation coefficients between apparent soil electrical conductivity and soil attributes for the five days of measurements.
Variable D1
1 (M=20,5%) D22 (M=22%) D33 (M=20,1%) D44 (M=20.2%) D55 (M=18%) pH6 0.29** 0.53** 0.39** 0.41** 0.45**
P7 -0.05ns -0.06ns -0.19* -0.15ns -0.09ns
K8 -0.03ns -0.08ns 0.03ns 0.02ns 0.07ns
Ca2+ 9
0.46**
0.44**
0.35**
0.39**
0.44**
Mg2+ 10 0.49** 0.43** 0.42** 0.53** 0.50**
H+Al11 -0.14ns -0.45** -0.32** -0.30** -0.35**
CEC 12 0.16ns -0.19* -0.09ns -0.03ns -0.07ns
V13 0.21** 0.52** 0.34** 0.37** 0.41**
OM14 0.20** 0.04ns 0.08ns 0.15ns 0.11ns
P_rem1 -0.22** -0.32** -0.38** -0.34** -0.35**
Zn16 0.23** 0.23** 0.13ns 0.24** 0.27**
Cu17 -0.09ns 0.05ns 0.06ns 0.00ns 0.02ns
Fe18 -0.19* -0.39** -0.16* -0.17* -0.22**
Mn19 0.05ns 0.17* 0.22** 0.21** 0.13ns
SB20 0.50** 0.47** 0.40** 0.46** 0.49**
B21 0.12ns 0.11ns 0.11ns 0.1ns 0.16ns
S22 -0.1ns -0.17* -0.13ns -0.14ns -0.11ns
Clay content 0.18* 0.17* 0.25** 0.24** 0.26**
Silt content 0.11ns
0.27**
0.19**
0.24**
0.21**
Sand content -0.21* -0.30** -0.32** -0.34** -0.34**
ECe1:523 -0.14ns 0.29** 0.04ns 0.08ns 0.11ns
1D1, measurements obtained on November 11th, 2010, M represents the mean soil moisture content; 2D2, November 23rd, 2010; 3D3, December 4th, 2010; 4D4, December 13th, 2010; 5D5, January 26th, 2011; 6pH, active acidity in water; 7P, Phosphorous; 8K, Potassium; 9Ca, Calcium; 10Mg, Magnesium; 11H + Al, potential acidity; 12CEC, cation exchangeable capacity at pH 7; 13V, base saturation; 14OM, Organic Matter; 15P-rem, remaining phosphorous; 16Zn, Zinc; 17Cu, Copper; 18Fe, Iron; 19Mn, Manganese; 20SB, exchangeable sum of bases; 21B, Boron; 22S, Sulfur; 23ECe1:5, electrical conductivity of soil extract at 1:5. *Significant at a 5% significance level. **Significant at a 1% significance level. nsnot significant.
When the variability of the soil texture in the field is not high, its correlation with ECa should be lower or even zero, and the soil moisture content at field capacity should be more homogeneous. The low variability of the soil moisture content in these conditions implies a lower participation of the moisture content in the ECa variability, and the map generated in this condition should be more related to the soil chemical properties. In field conditions, it is difficult to know if the moisture content at the time of sampling is high enough. To evaluate the reliability of the ECa map, it is recommended that soil samples be taken for soil moisture determination at the time of ECa measurements at representative points of the area that coincide with the ECa measurements. Subsequently, a correlation analysis between the ECa and soil moisture content should be performed. Strong correlations indicate that the generated map was influenced by soil moisture content, and the map can be different if obtained at different conditions of soil moisture content, because the soil can dry unevenly. This unevenness depends not only on the soil texture but also on the vegetation cover and soil organic matter, among other factors.
In this work, ECa measured with the highest mean soil moisture content was more correlated with the base saturation. The base saturation represents an attribute of great agronomic value as a basis of calculation for recommending corrective measures to neutralize the acidity and the exchangeable Al in the soil. A high correlation between the ECa and base saturation is a good argument for using ECa maps in the delimitation of management zones.
Conclusion
Less variability of the soil moisture content was observed when its mean value was higher.
The correlation between apparent soil electrical conductivity and soil moisture content was lowest when the soil had higher moisture. In this scenario the correlation was higher with soil properties.
The correlation analysis between the apparent soil electrical conductivity and soil moisture content is a good criterion for evaluating whether the measured apparent soil electrical conductivity values represent mainly the variability of the soil moisture content.
Acknowledgements
The authors wish to thank the Coordenação de Aperfeiçoamento de Pessoal de Nível Superior
(CAPES), the Fundação de Amparo à Pesquisa do Estado de Minas Gerais, Brazil (FAPEMIG), and the Conselho Nacional de Desenvolvimento Científico e Tecnológico (CNPq) of Brazil for financially supporting this research.
References
BERNARDO, S. Manual de irrigação. 4. Ed. Viçosa: UFV, 1987.
BREVIK, E. C.; FENTON, T. E.; LAZARI, A. Soil electrical conductivity as a function of soil water content and implications for soil mapping. Precision Agriculture,v. 7, n. 6, p. 393-404, 2006.
CORWIN, D. L.; LESCH, S. M. Application of soil electrical conductivity to precision agriculture: Theory, principles, and guidelines. Agronomy Journal, v. 95, n. 3, p. 455-471, 2003.
CORWIN, D. L.; LESCH, S. M.; OSTER, J. D.; KAFFKA, S. R. Monitoring management-induced spatio-temporal changes in soil quality through soil sampling directed by apparent electrical conductivity. Geoderma, v. 131, n. 3-4, p. 369-387, 2006.
EKWUE, E. I.; BARTHOLOMEW, J. Electrical conductivity of some soils in Trinidad as affected by density, water and peat content. Biosystems Engineering, v. 108, n. 2, p. 95-103, 2010.
EMBRAPA-Empresa Brasileira de Pesquisa Agropecuária.
Sistema brasileiro de classificação de solo. Rio de Janeiro: Embrapa, 2006.
GUASTAFERRO, F.; CASTRIGNANÒ, A.; BENEDETTO, D.; SOLLITTO, D.; TROCCOLI, A.; CAFARELLI, B. A comparison of different algorithms for the delineation of management zones. Precision Agriculture,v. 11, n. 6, p. 600-620, 2010.
HOSSAIN, M. B.; LAMB, D. W.; LOCKWOOD, P. V.; FRAZIER, P. EM38 for volumetric soil water content estimation in the root-zone of deep vertosol soils.
Computers and Electronics in Agriculture, v. 74, n. 1, p. 100-109, 2010.
LÜCK, E.; GEBBERS, R.; RUEHLMANN, J.; SPANGENBERG, U. Electrical conductivity mapping for precision farming. Near Surface Geophysics,v. 7, n. 1, p. 15-25, 2009.
MORAL, F. J.; TERRÓN, J. M.; SILVA, J. R. M. D. Delineation of management zones using mobile measurements of soil apparent electrical conductivity and multivariate geostatistical techniques. Soil and Tillage Research,v. 106, n. 2, p. 335-343, 2010.
RHOADES, J. D.; MANTEGHI, N. A.; SHOUSE, P. J.; ALVES, W. J. Soil electrical conductivity and soil salinity: new formulations and calibrations. Soil Science Society of America Journal,v. 53, n. 2, p. 433-439, 1989. SAS-Statistical Analysis System. User’s guide. Version 9.2. Cary: SAS Institute Inc., 2008.
Moisture effect on soil electrical conductivity 401
espacial da condutividade hidráulica e da infiltração da água no solo. Acta Scientiarum. Agronomy,v. 32, n. 1, p. 7-13, 2010.
SHANER, D. L.; KHOSLA, R.; BRODAHL, M. K.; BUCHLEITER, G. W.; FARAHANI, H. J. How well does zone sampling based on soil electrical conductivity maps represent soil variability?. Agronomy Journal,
v. 100, n. 5, p. 1472-1480, 2008.
Received on August 8, 2012. Accepted on October 31, 2012.