Digestible phosphorus levels for barrows from 50 to 80 kg
Viviane Maria Oliveira dos Santos Nieto1, Charles Kiefer2, Karina Márcia Ribeiro de Souza2, Liliane Maria Piano Gonçalves1, Marina de Nadai Bonin2, Tânia Mara Baptista dos Santos3,
Kelly Cristina Nunes Carvalho1, Alexandre Pereira dos Santos1
1 Universidade Federal de Mato Grosso do Sul, Programa de Pós-graduação em Ciência Animal, Campo Grande, MS, Brazil.
2 Universidade Federal de Mato Grosso do Sul, Faculdade de Medicina Veterinária e Zootecnia, Departamento de Zootecnia, Campo Grande, MS, Brazil.
3 Universidade Estadual de Mato Grosso do Sul, Faculdade de Zootecnia, Aquidauana, MS, Brazil.
ABSTRACT - This study was carried out to evaluate the levels of digestible phosphorus in diets for barrows with a high potential for lean meat deposition from 50 to 80 kg. Eighty barrows, with an initial weight of 47.93±3.43 kg, were distributed in completely randomized blocks, with each group given five levels of digestible phosphorus (1.86, 2.23, 2.61, 2.99, and 3.36 g kg−1).
There were eight replicates, and two animals per experimental unit. Phosphorus levels did not significantly influence feed intake, weight gain, or feed conversion ratio. Daily digestible phosphorus intake increased linearly as levels of phosphorus in the diet were increased. Phosphorus levels did not significantly influence muscle depth, loin eye area, backfat thickness, or the percentage and quantity of lean meat in the carcass. A linear increase was observed for feeding cost as the levels of digestible phosphorus in the diet were increased, and the level of 1.86 g kg−1 cost 29.4% less when compared with the level of 2.61 g kg−1.
The dry matter, natural matter, the coefficient of the residue, and volatile solids of the waste were not significantly influenced by phosphorus levels. Conversely, it was possible to observe an increasing linear effect for total solids, total phosphorus, and total nitrogen in the waste of animals receiving diets with increased levels of digestible phosphorus. The level of 1.86 g kg−1, which
corresponded to a daily intake of 4.77 g−1 of digestible phosphorus, meets the requirements of barrows weighing 50 to 80 kg.
Key Words: feeding cost, growth phase, mineral requirement, residue coefficient
ISSN 1806-9290
www.sbz.org.br R. Bras. Zootec., 45(5):242-249, 2016
Received August 5, 2015 and accepted January 30, 2016. Corresponding author: [email protected]
http://dx.doi.org/10.1590/S1806-92902016000500006
Copyright © 2016 Sociedade Brasileira de Zootecnia. This is an Open Access article distributed under the terms of the Creative Commons Attribution License (http://creativecommons.org/licenses/by/4.0/), which permits unrestricted use, distribution, and reproduction in any medium, provided the original work is properly cited.
Introduction
Phosphorus is the second most abundant mineral in living organisms, and among the micro minerals, it may have the largest set of functions, participating in almost every biochemical process in the organism. Along with calcium, phosphorus is present in soft tissues and plays a key role in energy metabolism in the form of ATP, ADP, and AMP; synthesis of carbohydrates; lipids and proteins; maintaining the acid-base equilibrium; phospholipid formation in cell membranes; and constitution of nucleic acids (Lehninger et al., 2002).
For swine, the phosphorus requirement comprises the amount required for maintenance and growth, as well as the type of tissue desired and the rate at which it develops. Muscle tissue possesses the second largest phosphorus reserve in the organism, whereas in adipose tissue phosphorus presence is minimal (Stahly et al., 2000).
Consequently, swine highly efficient in lean meat deposition demand the highest phosphorus requirements per unit of weight gain when compared with their counterparts of inferior performance.
The requirement to maximize performance is approximately 85% of the phosphorus for maximum bone mineralization (Stein, 2012). However, to calculate these requirements, a 77% efficiency in digestible phosphorus utilization, which is retained in the body, was assumed. Later studies have demonstrated this percentage to be closer to 100% (Stein, 2012). These data demonstrate there is a considerable margin for error on the calculations for phosphorus requirements. Currently, the digestible phosphorus levels recommended by the Brazilian Tables (Rostagno et al., 2011) and the NRC (2012) for barrows in the weight range of 50 to 75 kg are 2.68 and 2.60 g kg−1,
respectively. However, few studies have evaluated the sequential nutritional levels of digestible phosphorus.
of nutrients in the environment. Therefore, this study was carried out to evaluate the effects of digestible phosphorus levels in diets on performance, feeding costs, carcass characteristics, and the quantitative and qualitative characteristics of the waste from barrows from 50 to 80 kg.
Material and Methods
This work was carried out according to the ethical standards of and approved by the Committee of Ethics and Biosafety of Universidade Federal de Mato Grosso do Sul - UFMS (case no. 495/2013). Eighty commercial hybrid (Duroc/Pietran × Large Withe/Landrace) barrows, with an average initial weight of 47.93±3.43 kg, were used. Animals were distributed in a randomized block design comprising five levels of digestible phosphorus (1.86, 2.23, 2.61, 2.99, and 3.36 g kg−1), totaling eight
replications and two animals per experimental unit. The experimental unit was represented by the pen, and the initial weight of the animals was used as the parameter in block designation.
Animals were housed in forty pens measuring 1.15 m (width) × 2.86 m (length) and equipped with semi-automatic feeders and bite nipple drinkers, as well as a shallow water channel to transport animal waste. The pens were located in a masonry shed with ceramic roofing tiles. Temperature and relative humidity were monitored daily at nine spots inside the shed at 0.008 h and 16.00 h using a digital thermometer model ITWTG2000, which provided data for dry bulb, wet bulb, and black-globe temperatures as well as relative humidity. Recorded values were converted to globe temperature and humidity index (BGHI) values to characterize the thermal environment (Buffington et al., 1981).
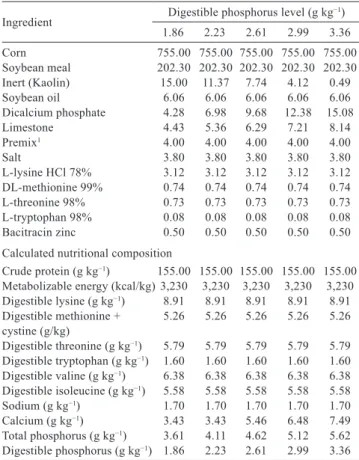
Experimental diets (Table 1), prepared with soybean meal and corn, were supplemented with amino acids, minerals, and vitamins to meet the nutritional requirements of the animals, as proposed by Rostagno et al. (2011), with the exception of digestible phosphorus and calcium levels. A constant Ca:P ratio was maintained. The different levels of calcium and phosphorus in the experimental diets were obtained by replacing kaolin with dicalcium phosphate and calcitic limestone. The ratio between lysine and the remaining amino acids was consistently maintained to attain the ideal protein pattern as recommended by Rostagno et al. (2011).
Diets were offered ad libitum to the animals throughout the experimental period. Feed leftovers on the floor were collected on a daily basis, weighed once a week, and
computed along with the feed remaining in the feeders at the end of the experimental period to determine daily feed intake. Animals were weighed in the beginning and at the end of the experimental period to determine daily weight gain and feed conversion ratio. Daily digestible phosphorus intake was determined using feed intake data (phosphorus level, % × daily feed intake)/100.
During the last weighing, an in vivo ultrasonography method was used to obtain backfat thickness (mm) and muscle depth (mm) measurements, using an Aloka SSD 500 Micrus Ultrasound (Aloka Co. Ltd, Wellingtongford, CT) equipped with a 120 mm-long linear transducer with a frequency of 3.5 MHz. A silicon adapter for the probe was used to adjust the fit between the transducer and the body of the animal. Additionally, soybean oil was used to eliminate air between the probe and the skin of the animal. The ultrasonography was carried out by placing the probe between the 12th and 13th ribs on the left side of the animal. Images from the ultrasonography were stored on a computer for later analysis.
Table 1 - Nutritional and proximate composition of experimental diets for barrows from 50 to 80 kg
Ingredient Digestible phosphorus level (g kg−1)
1.86 2.23 2.61 2.99 3.36
Corn 755.00 755.00 755.00 755.00 755.00
Soybean meal 202.30 202.30 202.30 202.30 202.30 Inert (Kaolin) 15.00 11.37 7.74 4.12 0.49
Soybean oil 6.06 6.06 6.06 6.06 6.06
Dicalcium phosphate 4.28 6.98 9.68 12.38 15.08
Limestone 4.43 5.36 6.29 7.21 8.14
Premix1 4.00 4.00 4.00 4.00 4.00
Salt 3.80 3.80 3.80 3.80 3.80
L-lysine HCl 78% 3.12 3.12 3.12 3.12 3.12 DL-methionine 99% 0.74 0.74 0.74 0.74 0.74
L-threonine 98% 0.73 0.73 0.73 0.73 0.73
L-tryptophan 98% 0.08 0.08 0.08 0.08 0.08
Bacitracin zinc 0.50 0.50 0.50 0.50 0.50
Calculated nutritional composition
Crude protein (g kg−1) 155.00 155.00 155.00 155.00 155.00 Metabolizable energy (kcal/kg) 3,230 3,230 3,230 3,230 3,230 Digestible lysine (g kg−1) 8.91 8.91 8.91 8.91 8.91 Digestible methionine + 5.26 5.26 5.26 5.26 5.26 cystine (g/kg)
Digestible threonine (g kg−1) 5.79 5.79 5.79 5.79 5.79 Digestible tryptophan (g kg−1) 1.60 1.60 1.60 1.60 1.60 Digestible valine (g kg−1) 6.38 6.38 6.38 6.38 6.38 Digestible isoleucine (g kg−1) 5.58 5.58 5.58 5.58 5.58 Sodium (g kg−1) 1.70 1.70 1.70 1.70 1.70 Calcium (g kg−1) 3.43 3.43 5.46 6.48 7.49 Total phosphorus (g kg−1) 3.61 4.11 4.62 5.12 5.62 Digestible phosphorus (g kg−1) 1.86 2.23 2.61 2.99 3.36 1 Content per kg of product: pantothenic acid - 9.2 mg; niacin - 18.0 mg; folic acid - 0.5 mg;
Carcass lean meat was calculated using the following equations from Guidoni (2000):
Lean meat (%) = 65.92 – [(0.685 × backfat thickness, mm) + (0.094 × muscle depth, mm) – (0.026 × cold carcass weight, kg)];
Lean meat quantity (kg) = ((hot carcass weight × lean meat, %)/100);
Daily lean meat deposition (g) = (final lean meat, kg – initial lean meat, kg)/experimental period.
To analyze the cost of digestible phosphorus consumed, and the cost of digestible phosphorus per weight gain, the value in Brazilian Real currency (R$) of commercialized phosphorus found in dicalcium phosphate was used, and this was in turn extrapolated to calculate the cost of the quantity of phosphorus found in corn and soybean meal. The retail price of dicalcium phosphate for Campo Grande - MS/Brazil was considered R$ 1.80 kg−1.
The amount of waste produced was quantified, and a set of analyses was performed to determine its physical (total and volatile solids) and chemical (total nitrogen and total phosphorus) characteristics. Sampling was carried out using a shovel after the shallow water channel was dried out; samples were put inside plastic bags, properly identified, and then stored in a freezer at −12 °C. Subsequently, the samples were kept at ambient temperature for analysis. Waste production, expressed as kg of total solids (TS) animal−1 day−1, was
calculated using data of waste weight (kilograms), number of animals allocated, number of days, and total solids content in the waste, according to the equation below:
Waste production (kg TS × animal−1 day−1) = ((kg of
waste/animal)/day) × TS (%).
The residue coefficient was also computed; this coefficient indicates the quantity of waste generated per kilogram of the main product. The residue coefficient was obtained by considering the total quantity of waste
produced (dry basis) in relation to the weight gain of the animals, as follows:
CR = (waste production, kg DM/weight gain, LW). The total and volatile solids contents were determined using methodologies described by APHA, AWWA, and WPCF (2012). Total nitrogen concentration was determined using the micro-Kjeldahl method, as described by Silva and Queiroz (2002), while total phosphorus concentration was determined by the colorimetric method, as described by Malavolta et al. (1991).
Data obtained for performance, carcass quantification, and characterization of waste were subjected to analysis of variance, taking into account the initial weight of the animals as a co-variable. Linear and quadratic regression analyses were also carried out, according to the best fit obtained for each variable. Statistical analysis were performed using SAS software (Statistical Analysis System, version 9.1).
Results and Discussion
The mean maximum and minimum temperatures were 31.09±2.23 ºC and 20.0±2.23 ºC, respectively, and the mean overall temperature observed throughout the experimental period was 26.21±3.54. The relative humidity and BGHI observed were 65.89±16.18 and 76.90±2.4, respectively.
The mean temperatures observed in this study were above the superior critical temperature recommended by Leal and Nããs (1992), who considered the temperature range between 18 to 12 °C as the optimal temperature for the welfare of animals in the growing and finishing phases, weighing 30 to 100 kg.
The globe temperature and humidity index value were higher than the means observed by Tinôco et al. (2007) when assessing swine in the same phase. The authors describe this value to be critical to the animals, which presented
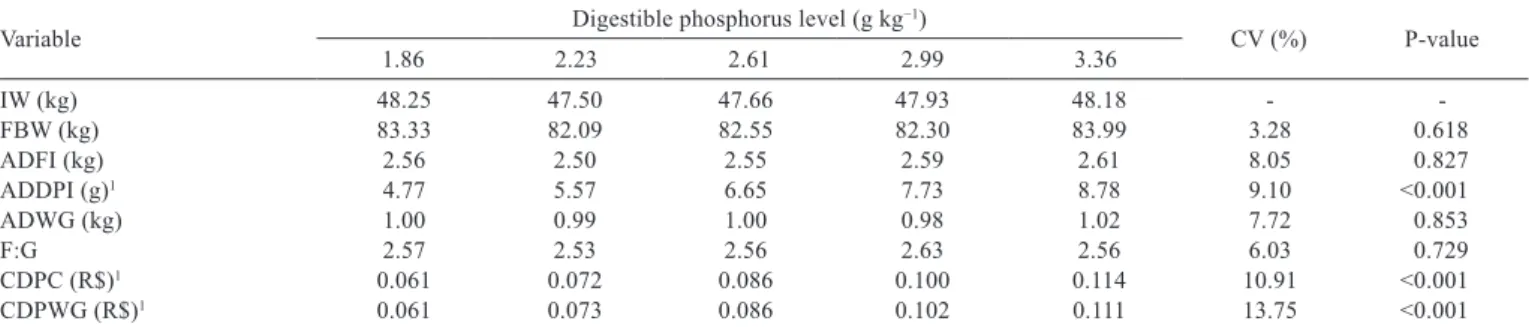
Table 2 - Performance of barrows from 50 to 80 kg fed diets with different levels of digestible phosphorus
Variable Digestible phosphorus level (g kg−1) CV (%) P-value
1.86 2.23 2.61 2.99 3.36
IW (kg) 48.25 47.50 47.66 47.93 48.18 -
-FBW (kg) 83.33 82.09 82.55 82.30 83.99 3.28 0.618
ADFI (kg) 2.56 2.50 2.55 2.59 2.61 8.05 0.827
ADDPI (g)1 4.77 5.57 6.65 7.73 8.78 9.10 <0.001
ADWG (kg) 1.00 0.99 1.00 0.98 1.02 7.72 0.853
F:G 2.57 2.53 2.56 2.63 2.56 6.03 0.729
CDPC (R$)1 0.061 0.072 0.086 0.100 0.114 10.91 <0.001
CDPWG (R$)1 0.061 0.073 0.086 0.102 0.111 13.75 <0.001
IW - initial weight; FBW - final body weight; ADFI - average daily feed intake; ADDPI - average daily digestible phosphorus intake; ADWG - average daily weight gain; F:G - feed conversion; CDPC - cost of digestible phosphorus consumed daily; CDPWG - cost of digestible phosphorus per weight gain.
acute symptoms indicative of heat stress. High temperature and BGHI values are unfavorable conditions for swine.
There was no significant effect (P>0.05) of digestible phosphorus levels on daily feed intake (Table 2). The mean daily intake value of 2.57 kg recorded in this study was lower than that observed by O’Quinn et al. (1997), who evaluated barrows of high genetic potential and superior performance from 50 to 80 kg, and by Arouca et al. (2010), for barrows from 60 to 95 kg.
According to Underwood (1981) and Shrivastat (2002), phosphorus plays a role in both appetite control and feed efficiency, and its deficiency in the diet could lead to a decreased feed intake, due to a reduction in the synthesis and liberation of growth hormones and thyroid hormones (e.g., triiodothyronine). An actual decrease in feed intake should only occur in cases of extreme phosphorus deficiency (Reinharte and Mahan, 1986), which was not observed in this study, since all of the levels assessed presented the same degree of voluntary intake.
As expected, the daily digestible phosphorus intake increased linearly (P<0.01) with the increase in levels of this mineral in the diet, as demonstrated by the equation ŷ = −0.3767 + 27.121x, r2 = 0.85.
Barrows fed the basal diet consumed 30.6 and 28.4% less digestible phosphorus than the quantity recommended by Rostagno et al. (2011) and the NRC (2012), respectively, without causing impaired body development. Since there was no increase in the daily intake at any level of digestible phosphorus, it can be inferred that this response is related to the increase in phosphorus levels in the diet. Stahly et al. (2000), Arouca et al. (2010), and Saraiva et al. (2011) also observed a linear effect of available phosphorus in the diets on daily phosphorus intake of barrows weighing 60 to 100 kg.
The final weight, daily weight gain, and feed conversion ratio were not influenced (P>0.05) by digestible phosphorus levels. According to Reinhart and Mahan (1986), low phosphorus levels in growing swine diets can negatively affect the weight gain, and the efficiency of feed utilization, for these animals. For Stahly (2007), this imbalance was found to negatively influence the relationship between protein and adipose tissue in the carcass, thus increasing body fat percentage, impairing weight gain, and reducing the feed efficiency/increasing feed conversion ratio. The data from the present study denote that the basal diet was able to meet the current nutritional requirements for the growth performance of the animals.
Phosphorus requirements affecting optimum performance have been demonstrated in other studies (O’Quinn et al., 1997) with barrows from 50 to 80 kg,
which recommended a daily intake of 5.70 g of digestible phosphorus. Saraiva et al. (2009) recommended a daily available phosphorus intake of 7.45 and 7.36 g−1 to optimize
the responses for weight gain and feed conversion ratio, respectively, for swine from 30 to 60 kg. By contrast, Arouca et al. (2009) established a daily available phosphorus intake of 9.82 and 9.11 g−1, respectively, to obtain maximal weight
gain and feed conversion ratio responses for swine from 30 to 60 kg. Bünzen et al. (2012) recommended a level of 3.10 g kg−1 and an intake of 5.87 g−1 of digestible phosphorus
to optimize the weight gain and the feed conversion ratio of swine in the same weight range.
Other studies with swine weighing 60 to 100 kg (Arouca et al., 2010; Saraiva et al., 2011) considered the intakes of 9.85 and 7.38 g−1 of available phosphorus as
adequate for daily weight gains, and the intakes of 7.36 and 9.04 g−1 for the feed conversion ratio, respectively.
The distinct performance results observed between this study and other studies in the literature might be related to the responsiveness of animals to phosphorus supplied for proper development. This individualism could also be related to their genetic potential (Wiseman and Mahan, 2010) and sanitary status (Trevisi at al., 2009), but primarily to the thermal environment in which these animals were allocated (Le Bellego et al., 2002).
The levels of digestible phosphorus evaluated influenced linearly (P<0.01) the costs of feeding as described by the cost of digestible phosphorus consumed, according to equation ŷ = −0.0003 + 0.3199x, r2 = 0.81;
and the cost of digestible phosphorus per weight gain, by equation ŷ = 0.0019 + 0.3147x, r2 = 0.92.
The cost markedly increased from the basal diet with the lowest supplementation level. With these results, it is possible to determine a reduction of 29.4% in the supplementation costs with the basal diet, without hindering the performance of the animals, comparing the intermediary with the highest phosphorus level assessed (2.61 g kg−1), which is close to the level recommended by
Rostagno et al. (2011) and the NRC (2012).
There was no influence (P>0.05) on backfat thickness, muscle depth, lean meat quantity and percentage, or daily lean meat deposition in the carcass by the digestible phosphorus levels (Table 3). Performance requirements were met with the lowest digestible phosphorus level, with no reduction in quantitative carcass traits.
could lead to a lower capacity to deposit muscular mass, and an increased proportion of fat deposited on the carcass (Stahly, 2007). Such conditions may lower the quality of the swine carcass, although this situation was not observed in the present study.
Similar to the results of this study, Traylor et al. (2005) also did not find an effect of phosphorus levels, or sources, on muscle depth when measured using an ultrasonography method in studies with barrows and gilts. However, Arouca et al. (2010) reported a quadratic effect of phosphorus levels on muscle depth, with an increase up to the level of 3.50 g kg−1, corresponding to a daily intake of 9.89 g.
The measured values for loin eye area in this study were not different among treatments, and corroborate the findings of O’Quinn et al. (1997), who evaluated four levels of digestible phosphorus for barrows from 50 to 80 kg. Animals fed the basal diet maintained a satisfactory percentage quantity, and deposition of lean meat; these results were similar among treatments. Likewise, Traylor et al. (2005) did not find any effect of phosphorus levels on lean meat percentage, or deposition, for barrows from 45 to 110 kg. The mean daily lean meat deposition value observed in the present study was higher than the 317 g and 316 g reported by O’Quinn et al. (1997) and Traylor et al. (2005), respectively. It was also higher than the 395 g recommended by the NSNG (2010).
No significant difference (P>0.05) was found for dry matter content, natural matter content, and the residue coefficient of waste production, demonstrating that the
levels of digestible phosphorus in diets for swine from 50 to 80 kg did not quantitatively alter waste production (Table 4).
Mean waste production was 0.280 and 0.770 kg of dry matter and natural matter day−1 animal−1, respectively.
These values were similar to those obtained by Miranda et al. (2012) for growing barrows.
The mean residue coefficient was 0.270 kg of waste per kg of body weight, which means that during the experimental period, animals produced 0.270 kg of waste for each kilogram of body weight. Contrasting residue coefficients were reported by Orrico Junior et al. (2011) and Miranda et al. (2012). These values were 0.230 kg of waste per kg of body weight for growing swine and 0.470 kg of waste per kg of body weight for swine from birth to slaughter, respectively. Although swine are animals which produce a large amount of waste, when this waste is analyzed in relation to meat production, the residue coefficients observed are usually lower than 1.0, an indicator of the productivity efficiency of the system.
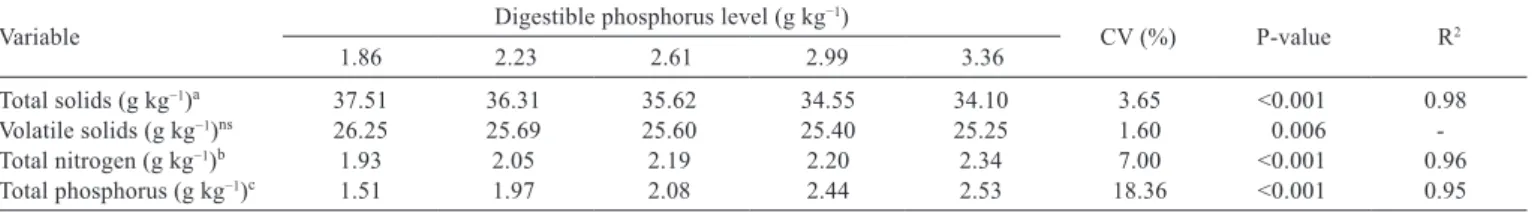
A decreasing linear effect was observed (P<0.01) for digestible phosphorus levels on the total solid content of waste, in which the increase in phosphorus in the diet reduced total waste solids production (Table 5). However, digestible phosphorous levels were not observed to affect (P>0.05) volatile solids content in waste.
The total solids content is the residue matter after water is evaporated from the waste, whereas the volatile solids content is the presence of organic matter in waste. Although the levels of digestible phosphorus interfered with total
Table 3 - Quantitative carcass characteristics of barrows from 50 to 80 kg fed diets with different levels of digestible phosphorus
Variable Digestible phosphorus level (g kg−1) CV (%) P-value
1.86 2.23 2.61 2.99 3.36
BTU (mm) 9.64 8.34 8.70 8.37 8.17 25.32 0.396
MDU (mm) 42.52 41.11 40.47 42.01 41.83 9.22 0.645
LEAU (cm2) 30.89 30.49 29.29 29.73 31.24 12.48 0.622
PLM (g kg−1) 617.30 625.00 622.00 625.50 626.50 2.33 0.441
ALM (kg) 37.70 37.68 37.47 38.03 38.67 6.93 0.753
DDLM (g day−1) 0.411 0.414 0.409 0.420 0.431 11.32 0.699
BTU - backfat thickness, measured by ultrasound; MDU - muscle depth, measured by ultrasound; LEAU - loin eye area, measured by ultrasound; PLM - percentage of lean meat; ALM - amount of lean meat; DDLM - daily deposition of lean meat.
CV - coefficient of variation.
Table 4 - Waste production and residue coefficient of barrows from 50 to 80 kg fed diets with different levels of digestible phosphorus
Variable Digestible phosphorus level (g kg
−1)
CV (%) P-value
1.86 2.23 2.61 2.99 3.36
Waste production, dry matter1 0.270 0.270 0.310 0.260 0.270 12.42 0.965
Waste production, natural matter1 0.710 0,750 0,860 0,790 0,750 13.70 0.250
Residue coefficient2 0.260 0.280 0.290 0.270 0.260 17.68 0.811
1 In kg day−1 animal−1.
solids concentrations, they did not affect the concentrations of the solids degradable fraction, which in turn, favors the use of this waste in both anaerobic and aerobic waste treatment systems.
Total solids and volatile solids contents of 290.86 and 250.98 g kg−1, respectively, were found by Miranda et al.
(2012), for the waste from growing swine. These values were similar to those found in the present study. The total phosphorus excretion increased linearly (P<0.05) as digestible phosphorus levels in the diets were increased, thus increasing phosphorus excretion to the environment.
Phosphorus absorption is proportional to its ingestion when this ingestion is within the standard values, i.e., values recommended by nutritional requirement tables for each category and production phase. Studies have demonstrated that phosphorus absorption efficiency is boosted when there is a decrease in the supply of this mineral. However, if phosphorus in the diet is offered far above what is required by the animal, there will be a reduction in its absorption capacity, thereby increasing phosphorus excretion. This adaptive response to dietary phosphorus is specific to the sodium/phosphate co-transport (Loghman-Adham, 1993).
The total nitrogen concentration in waste increased linearly (P<0.01) for the levels of digestible phosphorus assessed, in which the highest level of digestible phosphorus in the diet showed the highest nitrogen excretion in the waste.
Phosphorus is one of the most versatile elements present in animals, participating in numerous metabolic activities, with paramount importance in nutrient absorption and transport, as well as a role in the regulation of protein activity. It is probable that the highest levels of this mineral interfered with processes related to protein absorption, causing an increase in nitrogen excretion to the environment. This explanation could be supported by the findings of Berner et al. (1976), who evaluated the influence of high phosphate levels as a feeding additive on mineral absorption. These authors concluded that high phosphorus levels in the diet could not only interfere with dietary protein usage, but also with the absorption of iron,
copper, and zinc, although the effects depicted in the literature are scarce.
Phosphorus and nitrogen, along with copper and zinc, are elements with the greatest potential to become pollutants, negatively affecting environmental equilibrium (Ceretta et al., 2005; Gräber et al., 2005; Girotto et al., 2010). Therefore, it is necessary to constantly evaluate swine waste composition, as it presents high excretion levels of the aforementioned minerals. The most effective way to reduce nutrient excretion in the environment is by adjusting ingestion levels, suiting the formulation so that it meets with precision the requirements of the animals, taking into account their specificities and growth phase.
Therefore, it can be inferred that phosphorus supplementation above the level provided in the basal diet has no justification, from a technical, economical, or environmental perspective. According to Hartog and Sijtsma (2007), animal waste treatment should be considered in the production costs; thus, the total production cost of swine would be substantially reduced.
From the results provided in this study, it can be stated that the basal diet at a level of 4.77 g did not hinder growth performance or the quantitative characteristics of the carcass; it also displayed a lower excretion of total phosphorus and nitrogen. Thus, this level can be recommended to formulate swine diets for swine weighing 50 to 80 kg.
Furthermore, it is worth noticing that the estimated levels and daily intake of phosphorus were 30.6% lower than those recommended by the nutritional tables of Rostagno et al. (2011), and 19% lower than the recommendations of the NSNG (2010) for the same category of animals used in the present study. Their data established, respectively, the requirement for digestible phosphorus to be 2.68 g kg−1,
equivalent to 6.56 g for swine from 50 to 70 kg, and 2.30 g kg−1,
equivalent to 5.32 g for swine from 60 to 80 kg.
Therefore, with these new data, it is necessary to review the nutritional requirements of digestible phosphorus for swine in this category, since their requirements for performance and carcass characteristics were met at levels lower than those previously established.
Table 5 - Physical and chemical characteristics of waste of barrows from 50 to 80 kg fed diets with different levels of digestible phosphorus
Variable Digestible phosphorus level (g kg−1) CV (%) P-value R2
1.86 2.23 2.61 2.99 3.36
Total solids (g kg−1)a 37.51 36.31 35.62 34.55 34.10 3.65 <0.001 0.98
Volatile solids (g kg−1)ns 26.25 25.69 25.60 25.40 25.25 1.60 0.006
-Total nitrogen (g kg−1)b 1.93 2.05 2.19 2.20 2.34 7.00 <0.001 0.96
Total phosphorus (g kg−1)c 1.51 1.97 2.08 2.44 2.53 18.36 <0.001 0.95
ns - not significant.
Conclusions
The level of 1.86 g kg−1 of digestible phosphorus,
equivalent to a daily intake of 4.77 g of digestible phosphorus, meets the nutritional requirements for phosphorus of barrows weighing from 50 to 80 kg, and allows for a reduction in costs of both phosphorus consumed and excreted in waste.
References
Aarnink, A. J. A. and Verstegen, M. W. A. 2007. Nutrition, key factor to reduce environmental load from pig production. Livestock Science 109:194-203.
APHA.AWWA.WPCF. 2012. Standard methods for the examination of water and wastewater. 21st ed. Washington, DC.
Arouca, C. L. C.; Fontes, D. O.; Silva, F. C. O.; Ferreira, W. M.; Silva, M. A.; Vidal, T. Z. B.; Corrêa, G. S. S. and Paula, E. 2009. Exigência de fósforo disponível para suínos machos castrados selecionados para deposição de carne magra dos 30 aos 60 kg. Revista Brasileira de Zootecnia 61:1094-1103.
Arouca, C. L. C.; Fontes, D. O.; Silva, F. C. O.; Silva, M. A.; Almeida, F. R. C. L.; Corrêa, G. S. S.; Paula, E. and Haese, D. 2010. Níveis de fósforo disponível para suínos machos castrados dos 60 aos 95 kg. Revista Brasileira de Zootecnia 39:2646-2655.
Arouca, C. L. C.; Silva, F. C. O.; Fontes, D. O.; Donzele, J. L.; Oliveira, R. F. M.; Haese, D.; Kills, J. L. and Paula, E. 2012. Available phosphorus levels for 95 to 120 kg barrows genetically selected for lean gain. Revista Brasileira de Zootecnia 41:1433-1441. Berner, W.; Kinne, R. and Murer, H. 1976. Phosphate transport into
brush-border membrane vesicles isolated from rat small intestine. Biochemical Journal 160:467-474.
Buffington, D. E.; Colazzo-Arocho, A.; Canton, G. H.; Pitt, D.; Thatcher, W. W. and Collier R. J. 1981. Black globe-humidityindex (BGHI) as comfort equation for dairy cows. Transactions of the ASAE 24:711-714.
Bünzen, S.; Rostagno, H. S.; Kiefer, C.; Teixeira, A. O. and Ribeiro Junior, V. 2012. Níveis de fósforo digestível para suínos em fase de crescimento. Revista Brasileira de Zootecnia 41:320-325. Cadis, P. and Henkes, J. A. 2014. Gestão ambiental na suinocultura:
sistema de tratamento de resíduos líquidos por unidade de compostagem. Revista de Gestão e Sustentabilidade Ambiental 3:115-150.
Ceretta, C. A.; Basso, C. J.; Vieira, F. C. B.; Herbes, M. G.; Moreira, I. C. L. and Berwanger, A. L. 2005. Dejeto líquido de suínos: I - perdas de nitrogênio e fósforo na solução escoada na superfície do solo, sob plantio direto. Ciência Rural 35:1296-1304.
Girotto, E.; Ceretta, C. A.; Brunetto, G.; Santos, D. R.; Silva, L. S.; Lourenzi, C. R.; Lorensini, F.; Vieira, R. C. B. and Schmatz, R. 2010. Acúmulo e formas de cobre e zinco no solo após aplicações sucessivas de dejeto líquido de suínos. Revista Brasileira da Ciencia do Solo 34:955-965.
Gräber, I.; Hansen, J. F.; Olesen, S. E.; Hans, J. P.; Ostergaard, H. S. and Krogh, L. 2005. Accumulation of copper and zinc in danish agricultural soils in intensive pig production areas. Danish Journal of Geography 5:15-22.
Guidoni, A. L. 2000. Melhoria de processos para a tipificação e valorização de carcaças suínas no Brasil. p.221-234. In: Conferência Internacional Virtual Sobre a Qualidade de carne suína. EMBRAPA–CNSA, Concórdia.
Hartog, L. D. and Sijtsma, R. 2007. Estrategias nutricionales para reducir la contaminación ambiental en la producción porcina.
p.19-41. In: 23o Curso Especialización FEDNA: Avances
Nutrición y Alimentación Animal. Rebollar, P. G.; De Blas, C.; Mateos, G. G., eds. FEDNA, Madrid. Available at: <http:// www.fundacionfedna.org/publicaciones_2007>. Accessed on: July 18, 2014.
Leal, P. M. and Nããs I. A. 1992. Ambiência animal. p.121-135. In: Introdução à engenharia agrícola. Cortez, L. A. B. and Magalhães, P. S. G., org. Unicamp, Campinas, SP.
Le Bellego, L.; van Milgen, J. and Noblet, J. 2002. Effect of high temperature and low-protein diets on the performance of growing-finishing pigs. Journal of Animal Science 80:691-701.
Lehninger, A. L.; Nelson, D. L. and Cox, M. M. 2002. Princípios de bioquímica. 3.ed. Sarvier, São Paulo.
Loghman-Adham, M. 1993. Renal and intestinal Pi tranport adaptation to low phosphorus dietin uremic rats. Journal of the American Society of Nephrology 3:1930-1937.
Malavolta, E.; Boaretto, A. E. and Paulino, V. T. 1991. Micronutrientes, uma visão geral. p.1-33. In: Micronutrientes na agricultura. Ferreira, M. E.; Cruz, M. C., eds. POTAFOS/CNPq, Piracicaba. Miranda, A. P.; Lucas Júnior, J.; Thomaz, M. C.; Pereira, G. T. and
Fukayama, E. H. 2012. Anaerobic biodigestion of pigs feces in the initial, growing and finishing stages fed with diets formulated with corn or sorghum. Engenharia Agrícola de Jaboticabal 32:47-59. NRC - National Research Council. 2012. Nutrient requirements of
swine. 11th rev. ed. National Academy Press, Washington, DC. NSNG - National Swine Nutrition Guide. 2010. Tables on nutrient
recommendations. Ingredient composition and use rates. U.S. Pork Center of Excellence, Ames, IA, USA.
O’Quinn, P. R.; Knabe, D. A. and Gregg, E. J. 1997. Digestible phosphorus needs of terminal-cross growing-finishing pigs. Journal of Animal Science 75:1308-1318.
Orrico Junior, M. A. P.; Orrico, A. C. A. and Lucas Junior, J. 2011. Produção animal e o meio ambiente: uma comparação entre potencial de emissão de metano dos dejetos e a quantidade de alimento produzido. Engenharia Agrícola 31:399-410.
Reinhart, G. A. and Mahan, D. C. 1986. Effect of various calcium: phosphorus ratios at low and high dietary phosphorus for starter, grower and finishing swine. Journal of Animal Science 63:457-466. Rostagno, H. S.; Albino, L. F. T.; Donzele, J. L.; Gomes, P. C.;
Oliveira, R. F. M.; Lopes, D. C.; Ferreira, A. S.; Barreto, S. L. T. and Euclides, R. F. 2011. Tabelas brasileiras para aves e suínos. 3.ed. UFV-DZO, Viçosa, MG.
Saraiva, A.; Donzele, J. L.; Oliveira, R. F. M.; Abreu, M. L. T.; Silva, F. C. O. and Haese, D. 2009. Níveis de fósforo disponível em rações para suínos de alto potencial genético para deposição de carne dos 30 aos 60 kg. Revista Brasileira de Zootecnia 38:1279-1285. Saraiva, A.; Donzele, J. L.; Oliveira, R. F. M.; Abreu, M. L. T.;
Silva, F. C. O.; Vianna, R. A. and Lazarini, A. L. 2011. Available phosphorus levels in diets for 30 to 60 kg female pigs selected for meat deposition by maintaining calcium and available phosphorus ratio. Revista Brasileira de Zootecnia 40:587-592.
Shrivastav, A. K. 2002. Recentes avanços na nutrição de codornas japonesas. p.116-117. In: Anais do 1o Simpósio Internacional
de Coturnicultura Novos Conceitos Aplicados à Produção de Codornas, Lavras.
Silva, D. J. and Queiroz, A. C. 2002. Análise de alimentos: métodos químicos e biológicos. 3.ed. Imprensa Universitária da UFV, Viçosa, MG.
Stahly, T. S. 2007. Nutrient needs for high lean pigs. Manitoba agriculture, food and rural initiatives. Available at: <http://www. gov.mb.ca/agriculture/livestock/pork/swine/bab10s13.html>. Accessed on: Mar. 1, 2014.
weight” (2001). Swine Research Report. Paper 4. Available at: <http://lib.dr.iastate.edu/swinereports_2000/4>. Accessed on: Feb. 5, 2014.
Stein, H. H. 2012. El Nuevo NRC Del ganado porcino. p.17-30. In: 28o Curso Especialización FEDNA: Avances Nutrición y
Alimentación Animal. Rebollar, P. G.; De Blas, C.; Mateos, G. G., eds. FEDNA, Madrid. Available at: <http://www.fundacionfedna.org/ publicaciones_2012>. Accessed on: July 18, 2014.
Traylor, S. L.; Cromwell, G. L. and Lindemann, M. D. 2005. Bioavailability of phosphorus in meat and bone meal for swine. Journal of Animal Science 83:1054-1061.
Tinôco, I. F. F.; Souza, C. F.; Oliveira, P. A. V.; De Paulo, R. M.; Campos, J. A.; Carvalho, C. C. S. and Cordeiro, M. B. 2007. Avaliação do índice de temperatura de globo negro e umidade
e desempenho de suínos nas fases de crescimento e terminação criados em sistemas em camas sobrepostas em condições de verão. Revista Brasileira de Zootecnia 36:1624-1629.
Trevisi, P.; Melchior, D.; Mazzoni, M.; Casini, L.; De Filippi, S.; Minieri, L.; Lalatta-Costerbosa, G. and Bosi, P. 2009. A tryptophan-enriched diet improves feed intake and growth performance of susceptible weanling pigs orally challenged with Escherichia coli K88. Journal of Animal Science 87:148-156.
Underwood, E. J. 1981. Los minerales en la nutrición del ganado. Acribia, Zaragoza.