www.sbz.org.br
Received May 4, 2011 and accepted December 9, 2011. Corresponding author: anatonn4@hotmail.com
Digestible tryptophan requirements of meat quails in the growth phase
Ana Paula Silva Ton1, Antonio Claudio Furlan2, Elias Nunes Martins2, Eliany Batista1, Tiago Junior Pasquetti1, Juliana Beatriz Toledo1, Carina Scherer1,Lígia Melani Saraiva3
1Programa de Pós-graduação em Zootecnia – UEM, Maringá, PR. 2Departamento de Zootecnia – UEM, Maringá, PR.
3Curso de Zootecnia – UEM, Maringá, PR.
ABSTRACT - The objective of this experiment was to estimate the digestible tryptophan (DTrp) requirements for growing meat quails. In the first experiment (1-14 days of age), 1,950 quails were distributed in a completely randomized design, with six levels of DTrp (0.27; 0.30; 0.33; 0.36; 0.39 and 0.42% of diet), five replications and 65 quails per experimental unit. There was a linear increase of feed intake, tryptophan intake, weight gain and body weight with the DTrp levels increase. In the second experiment (15-35 days of age), 1,350 quails were distributed in a completely randomized design, with six levels of DTrp (0.22; 0.25; 0.28; 0.31; 0.34 and 0.37% of diet), five replications and 45 quails per experimental unit. There was a linear increase for tryptophan intake, carcass yield, ash levels and protein deposition rate with the DTrp levels increase. In the third experiment (28-35 days of age), conducted to determine the nitrogen balance, 150 males were housed in galvanized wire cages featuring drinker, feeder and individual metal tray lined with plastic to collect the excreta. The design was completely randomized, with six levels of DTrp (0.22; 0.25; 0.28; 0.31; 0.34 and 0.37% of diet), five replicates and five quails per experimental unit. Linear decrease was observed on the nitrogen balance and metabolization coefficient with the DTrp levels increase. The nutritional requirement of digestible tryptophan for maximum growing of meat quail, in the period from 1 to 14 days of age, is higher or equal to 0.42%; in the period from 15 to 35 days, it is 0.22%.
Key Words: body composition, nitrogen balance, synthetic amino acids
Introduction
The determination of nutrient requirements has great importance for all bird species, since the provision of adequate levels of a nutrient is an important factor which determines whether or not birds express their genetic potential (Corrêa et al., 2007). Quail raising is a consolidated activity in the food production chain, which produces high-quality animal protein under low costs (Moura et al., 2010).
Among the factors that influence the production cost of quail husbandry, feed may represent more than 70% of the total cost. Therefore, animal nutritionists are concerned to provide a diet with adequate levels, allowing better performance and, consequently, higher economic return (Freitas et al., 2006).
For many years, the poultry diets were formulated to meet the crude protein requirements of animals. With the growing development of the synthetic amino acid industry, animal nutritionists began to formulate poultry diets in order to meet the specific needs of essential amino acids (Araújo et al., 2004).
The use of synthetic amino acids allows the diet formulation with levels of crude protein lower than the
recommended on the tables of nutrients requirement. This maximizes the use of amino acids to protein synthesis and minimizes its use as energy source, promoting the attainment of maximum animal performance (Corrêa et al., 2006).
Tryptophan is an essential amino acid and must be supplemented on poultry diets since its synthesis cannot be performed by animals at sufficient quantities to meet their needs. L-tryptophan has 99.3% of digestibility for birds and is commercially available. Tryptophan is involved in the synthesis of niacin and serotonin, which is a key-molecule which controls the appetite and behavior. Thus, tryptophan is an essential amino acid required for maximum gain and feed efficiency (Fraiha, 2002).
Duo to the lack of research on digestible tryptophan requirement on growing meat quails, the objective of this study was to estimate the optimal level of digestible tryptophan for maximum performance, carcass composition, protein deposition, fat and energy retained in the carcass, carcass yield, nitrogen balance and economic analysis of diets for growing meat quails (Coturnix coturnix sp)
Material and Methods
The experiments were carried out at Fazenda Experimental de Iguatemi of Universidade Estadual de Maringá - UEM.
In the first experiment (1-14 days) 1,950 non-sexed quails (Coturnix coturnix sp), of one day of age and
initial body weight of 8.82 g were distributed in a completely randomized design with six levels of digestible tryptophan with five replicates and 65 birds per experimental unit.
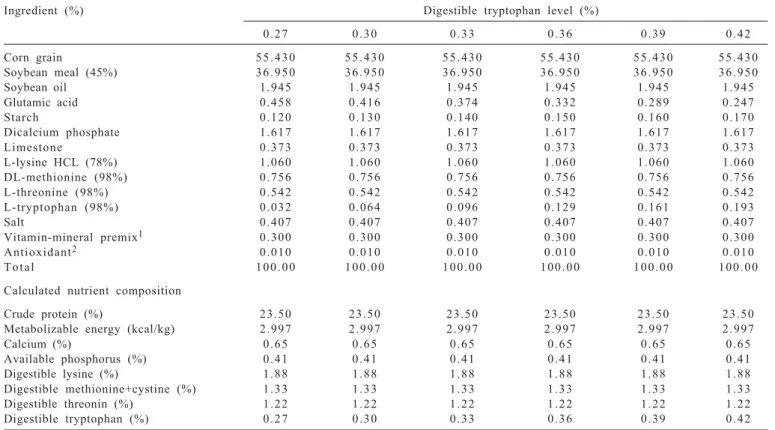
The experimental diet consisted of six levels of digestible tryptophan (0.27; 0.30; 0.33; 0.36; 0.39 and 0.42%); diets were isoprotein, isoenergetic, isocalcic and isophosphoric formulated based on corn and soybean meal (Table 1).
In the second experiment (15-35 days), 1,350 non-sexed quails (Coturnix coturnix sp), of 15 days of age
and average weight of 65.13 g were distributed in a completely randomized design with six levels of digestible t r y p t o p h a n , f i v e r e p l i c a t i o n s a n d 4 5 b i r d s p e r experimental unit. On the 15th day, birds were weighed and distributed as described by Sakomura & Rostagno (2007), for standardization of the average weights of the experimental units, so all units had similar weights. At
the end of the experiment, counting and male/female ratio determination were conducted in each pen.
The experimental diets consisted of six levels of digestible tryptophan (0.22; 0.25; 0.28; 0.31; 0.34 and 0.37%); diets were isoprotein, isoenergetic, isocalcic and isophosphoric formulated based on corn and soybean meal (Table 2).
The energy content and chemical composition of the diet were obtained from Rostagno et al. (2005). The differences between the protein equivalent of tryptophan and glutamic acid at different levels of tryptophan used in the evaluation were offset by the corn starch.
Birds were housed in a conventional warehouse covered with asbestos fiber roof and divided into 30 pens of 2.5 m2 with dirt floor, using rice husk as bedding, lined with corrugated cardboard during the first week. The lighting program used was 24 hours per day (natural+artificial light) throughout the experimental period.
Maximum and minimum temperatures were monitored throughout the experimental period; their values were recorded at 08 h and 16 h, using a dry bulb thermometer. The maximum and minimum average temperatures were, respectively, 36 and 26 ºC in the morning and 36 and 27 ºC in the afternoon.
Table 1 - Ingredient and nutrient composition of experimental diets for meat quails in the growth phase (1 to 14 days)
Ingredient (%) Digestible tryptophan level (%)
0 . 2 7 0 . 3 0 0 . 3 3 0 . 3 6 0 . 3 9 0 . 4 2
Corn grain 5 5 . 4 3 0 5 5 . 4 3 0 5 5 . 4 3 0 5 5 . 4 3 0 5 5 . 4 3 0 5 5 . 4 3 0
Soybean meal (45%) 3 6 . 9 5 0 3 6 . 9 5 0 3 6 . 9 5 0 3 6 . 9 5 0 3 6 . 9 5 0 3 6 . 9 5 0
Soybean oil 1 . 9 4 5 1 . 9 4 5 1 . 9 4 5 1 . 9 4 5 1 . 9 4 5 1 . 9 4 5
Glutamic acid 0 . 4 5 8 0 . 4 1 6 0 . 3 7 4 0 . 3 3 2 0 . 2 8 9 0 . 2 4 7
Starch 0 . 1 2 0 0 . 1 3 0 0 . 1 4 0 0 . 1 5 0 0 . 1 6 0 0 . 1 7 0
Dicalcium phosphate 1 . 6 1 7 1 . 6 1 7 1 . 6 1 7 1 . 6 1 7 1 . 6 1 7 1 . 6 1 7
Limestone 0 . 3 7 3 0 . 3 7 3 0 . 3 7 3 0 . 3 7 3 0 . 3 7 3 0 . 3 7 3
L-lysine HCL (78%) 1 . 0 6 0 1 . 0 6 0 1 . 0 6 0 1 . 0 6 0 1 . 0 6 0 1 . 0 6 0
DL-methionine (98%) 0 . 7 5 6 0 . 7 5 6 0 . 7 5 6 0 . 7 5 6 0 . 7 5 6 0 . 7 5 6
L-threonine (98%) 0 . 5 4 2 0 . 5 4 2 0 . 5 4 2 0 . 5 4 2 0 . 5 4 2 0 . 5 4 2
L-tryptophan (98%) 0 . 0 3 2 0 . 0 6 4 0 . 0 9 6 0 . 1 2 9 0 . 1 6 1 0 . 1 9 3
Salt 0 . 4 0 7 0 . 4 0 7 0 . 4 0 7 0 . 4 0 7 0 . 4 0 7 0 . 4 0 7
Vitamin-mineral premix1 0 . 3 0 0 0 . 3 0 0 0 . 3 0 0 0 . 3 0 0 0 . 3 0 0 0 . 3 0 0
Antioxidant2 0 . 0 1 0 0 . 0 1 0 0 . 0 1 0 0 . 0 1 0 0 . 0 1 0 0 . 0 1 0
T o t a l 1 0 0 . 0 0 1 0 0 . 0 0 1 0 0 . 0 0 1 0 0 . 0 0 1 0 0 . 0 0 1 0 0 . 0 0
Calculated nutrient composition
Crude protein (%) 2 3 . 5 0 2 3 . 5 0 2 3 . 5 0 2 3 . 5 0 2 3 . 5 0 2 3 . 5 0
Metabolizable energy (kcal/kg) 2 . 9 9 7 2 . 9 9 7 2 . 9 9 7 2 . 9 9 7 2 . 9 9 7 2 . 9 9 7
Calcium (%) 0 . 6 5 0 . 6 5 0 . 6 5 0 . 6 5 0 . 6 5 0 . 6 5
Available phosphorus (%) 0 . 4 1 0 . 4 1 0 . 4 1 0 . 4 1 0 . 4 1 0 . 4 1
Digestible lysine (%) 1 . 8 8 1 . 8 8 1 . 8 8 1 . 8 8 1 . 8 8 1 . 8 8
Digestible methionine+cystine (%) 1 . 3 3 1 . 3 3 1 . 3 3 1 . 3 3 1 . 3 3 1 . 3 3
Digestible threonin (%) 1 . 2 2 1 . 2 2 1 . 2 2 1 . 2 2 1 . 2 2 1 . 2 2
Digestible tryptophan (%) 0 . 2 7 0 . 3 0 0 . 3 3 0 . 3 6 0 . 3 9 0 . 4 2
1Mineralvitamin premix (minimal content per kg); vit. A 4,500,000 UI; vit. D3 1,250,000 UI; vit. E 4,000 mg; vit. B1 278 mg; vit. B2 2,000 mg; vit. B6
-525 mg; vit. B12 - 5,000 μcg; vit. K3 - 1,007 mg; Ca-pantothenate - 4,000 mg; niacin - 10,000 mg; choline - 140,000 mg; antioxidant - 5,000 mg; Zn - 31,500 mg; Fe - 24,500 mg; Mn - 38,750 mg; Cu - 7,656 mg; cobalt - 100 mg; I - 484 mg; Se - 127 mg;
To meet quails nutritional requirements, the recommendations by Scherer (2009) were adopted for the requirements of lysine and metabolizable energy and Silva et al. (2009), for the requirements of calcium and phosphorus in the diet.
The digestible methionine+cystine and threonine content of the diets were calculated according to the relation proposed by Rostagno et al. (2005) for broilers in the growth phase, 1 to 21 days, corresponding the ratio of digestible lysine:digestible methionine+cystine and threonine of 71 and 65, respectively. All diets were supplemented with synthetic amino acids in sufficient amount to obtain the desired relation between the amino acids.
Quails were weekly weighed and the weighings of experimental diets were carried simultaneously to determinate: feed intake (g/bird), tryptophan intake (g/bird), weight gain (g), body weight (g) and feed convertion (g/g). The chemical composition of the carcass was achieved by comparative slaughter, from an additional group of 50 quails with 1 day of age compared with the quails slaughtered at the end of the first experiment and an additional group of six quails on the 15th day of age, compared with the quails slaughtered at the end of the second experiment.
To study the chemical composition of the carcass, eviscerated carcasses (with skin) of five quails selected by average weigh (±10%) of each experimental unit (25 quails/ treatment) at the end of the experiments were used. These quails were slaughtered by decapitation between the occipital and atlas bones with scissors, according to the standards proposed by the Ethics Committee on Animal Experiments of the Universidade Estadual de Maringá.
Birds were bled and scalded for 20 to 40 seconds at 53 to 55 ºC and manually plucked. After eviscerated by abdominal cutting and having feet and head removed, the carcasses were frozen in plastic bags properly identified for treatment and replication and then ground in an industrial meat grinder.
The ground carcasses were weighed, homogenized and put into forced-ventilation oven at 55 ºC for 72 hours for pre-drying. After the pre-drying, the material was ground in a hammer mill type and sent to analytical determinations in the Laboratório de Nutrição Animal (LANA) of the Departamento de Zootecnia of Universidade Estadual de Maringá.
Dry matter, moisture content, crude protein, ether extract and ash content of the carcasses were determined
Table 2 - Ingredient and nutrient composition of experimental diets for meat quails in the growth phase (15 to 35 days)
Ingredient (%) Digestible tryptophan level (%)
0 . 2 2 0 . 2 5 0 . 2 8 0 . 3 1 0 . 3 4 0 . 3 7
Corn grain 6 6 . 8 5 3 6 6 . 8 5 3 6 6 . 8 5 3 6 6 . 8 5 3 6 6 . 8 5 3 6 6 . 8 5 3
Soybean meal (45%) 2 6 . 7 8 9 2 6 . 7 8 9 2 6 . 7 8 9 2 6 . 7 8 9 2 6 . 7 8 9 2 6 . 7 8 9
Soybean oil 0 . 5 1 1 0 . 5 1 1 0 . 5 1 1 0 . 5 1 1 0 . 5 1 1 0 . 5 1 1
Glutamic acid 0 . 5 0 0 0 . 4 5 8 0 . 4 1 6 0 . 3 7 4 0 . 3 3 2 0 . 2 8 9
Starch 0 . 1 1 0 0 . 1 2 0 0 . 1 3 0 0 . 1 4 0 0 . 1 5 0 0 . 1 6 0
Dicalcium phosphate 1 . 6 6 6 1 . 6 6 6 1 . 6 6 6 1 . 6 6 6 1 . 6 6 6 1 . 6 6 6
Limestone 0 . 2 9 3 0 . 2 9 3 0 . 2 9 3 0 . 2 9 3 0 . 2 9 3 0 . 2 9 3
L-lysine HCL (78%) 1 . 1 9 8 1 . 1 9 8 1 . 1 9 8 1 . 1 9 8 1 . 1 9 8 1 . 1 9 8
DL-methionin (99%) 0 . 7 4 0 0 . 7 4 0 0 . 7 4 0 0 . 7 4 0 0 . 7 4 0 0 . 7 4 0
L-threonine (98%) 0 . 5 9 2 0 . 5 9 2 0 . 5 9 2 0 . 5 9 2 0 . 5 9 2 0 . 5 9 2
L-tryptophan (98%) 0 . 0 3 2 0 . 0 6 4 0 . 0 9 6 0 . 1 2 8 0 . 1 6 0 0 . 1 9 3
Salt 0 . 4 0 6 0 . 4 0 6 0 . 4 0 6 0 . 4 0 6 0 . 4 0 6 0 . 4 0 6
Mineral-vitamim premix1 0 . 3 0 0 0 . 3 0 0 0 . 3 0 0 0 . 3 0 0 0 . 3 0 0 0 . 3 0 0
Antioxidant2 0 . 0 1 0 0 . 0 1 0 0 . 0 1 0 0 . 0 1 0 0 . 0 1 0 0 . 0 1 0
T o t a l 1 0 0 . 0 0 1 0 0 . 0 0 1 0 0 . 0 0 1 0 0 . 0 0 1 0 0 . 0 0 1 0 0 . 0 0
Calculated nutrient composition
Crude protein (%) 2 0 . 0 0 2 0 . 0 0 2 0 . 0 0 2 0 . 0 0 2 0 . 0 0 2 0 . 0 0
Metabolizable energy (kcal/kg) 3 . 0 3 6 3 . 0 3 6 3 . 0 3 6 3 . 0 3 6 3 . 0 3 6 3 . 0 3 6
Calcium (%) 0 . 6 1 0 . 6 1 0 . 6 1 0 . 6 1 0 . 6 1 0 . 6 1
Available phosphorus (%) 0 . 4 1 0 . 4 1 0 . 4 1 0 . 4 1 0 . 4 1 0 . 4 1
Digestible lysine (%) 1 . 7 3 1 . 7 3 1 . 7 3 1 . 7 3 1 . 7 3 1 . 7 3
Digestiblw methionin+cystine (%) 1 . 2 4 1 . 2 4 1 . 2 4 1 . 2 4 1 . 2 4 1 . 2 4
Digestible threonin (%) 1 . 1 4 1 . 1 4 1 . 1 4 1 . 1 4 1 . 1 4 1 . 1 4
Digestible tryptophan (%) 0 . 2 2 0 . 2 5 0 . 2 8 0 . 3 1 0 . 3 4 0 . 3 7
1Mineralvitamin premix (minimal content per kg); vit. A 4,500,000 UI; vit. D3 1,250,000 UI; vit. E 4,000 mg; vit. B1 278 mg; vit. B2 2,000 mg; vit. B6
-525 mg; vit. B12 - 5,000 μcg; vit. K3 1,007 mg; Capantothenate 4,000 mg; niacin 10,000 mg; choline 140,000 mg; antioxidant 5,000 mg; Zn 31,500 mg; Fe -24,500 mg; Mn - 38,750 mg; Cu - 7,656 mg; cobalt - 100 mg; I - 484 mg; Se - 127 mg.
as described by Silva & Queiróz (2004), and rates of protein and fat deposition and energy retained in the carcass were calculated following methodologies described by Fraga et al. (2008).
To determinate the carcass yield, four quails (two males and two females) per experimental unit, with 35 days old, were selected by average weigh (±10%) of each experimental unit (a total of 20 birds per treatment) and subjected to four hours of fasting, then slaughtered by decapitation by scissors between the occipital and atlas bone.
The birds were bled on an adapted cone for 2 minutes and scalded for 20 to 40 seconds at 53 to 55 ºC. Plucking was made manually and the birds were eviscerated by abdomen cut. To calculate the carcass yield, the weight of eviscerated carcass without feet and head in relation to body weight was calculated and obtained individually before slaughter. In the 3rd experiment (28 to 32-day-old quails), a digestibility assay was carried out to determine the nitrogen balance, which used 150 28-day-old males, taken from the respective experimental unit from experiment 2 and housed in galvanized wire cages featuring nipple drinker, individual feeder and individual metal tray lined with plastic, for excreta collection.
The experimental design used was completely randomized with same levels of digestible tryptophan used in experiment 2, totaling six treatment groups, with five replicates of five birds each. The experimental diets were weighed at the beginning and end of the nitrogen balance assay, and ferric oxide (2%) was added to the diet as a marker of beginning and end of excreta collection. The collection period was five days, and the excreta were collected in the morning.
After collection, excreta were placed in plastic bags, properly identified for treatment group and replicate, then stored in a freezer. At the end of the digestibility assay, excreta were thawed, homogenized, weighed and oven-dried (55 ºC, 72 hours) as pre-drying.
After pre-drying, the excreta were ground in hammer mill and sent to nitrogen quantification. The nitrogen contents of test diets and excreta were obtained by Kjeldahl, according to Silva & Queiroz (2004).
The nitrogen balance (g/day) was calculated by the difference between nitrogen intake and excretion and metabolization coefficient (%) of nitrogen of the test diets. Economic analysis was performed, determining the cost of experimental diets per kilogram of weight gain, described by Bellaver et al. (1985).
The statistical analysis was performed using the statistical analysis system – SAEG (Sistema de Análises
Estatísticas, version 5.0). The degrees of freedom regarding the levels of digestible tryptophan were broken into polynomials. The estimated requirement of digestible tryptophan was obtained by the application of quadratic model.
Results and Discussion
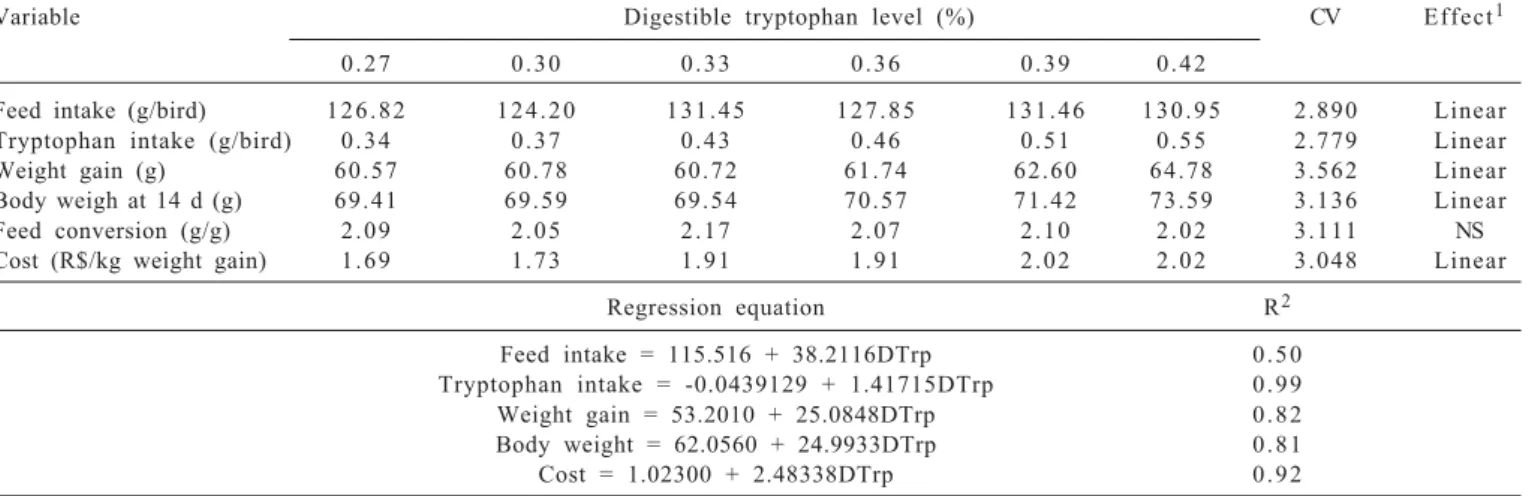
Feed intake, tryptophan intake, weight gain and body weight of quails during 1 to 14 days of age showed a linear increase (P<0.05) according to the levels of digestible tryptophan (Table 3).
Castro et al. (2000), evaluating broilers performance of broilers from 1 to 21 days of age fed different levels of total tryptophan (0.18 to 0.24%) and observed a quadratic effect on weight gain and feed conversion ratio, estimating the requirements on 0.212 and 0.208% of total tryptophan.
In a study conducted with laying Japanese quails fed with different levels of digestible tryptophan (0.12 to 0.28%), Pinheiro et al. (2008) found no effects on birds performance, except for tryptophan intake which increased linearly on levels of digestible tryptophan of the diet. This effect was justified as the birds were not exposed to stressful situations where tryptophan could be more required to promote well-being of birds. One of the possible mechanisms that explain the role of amino acids on feed intake control is that an unbalanced plasma level of amino acids impairs the synthesis of neurotransmitters such as serotonin.
It is well known that bird age has strong influence on the morphology of the intestinal mucosa and digestive enzymes activity. Some studies have reported that supplementation of some essential and non-essential amino acids such as glutamine and threonine improve the development and integrity of the intestinal flora, improving the performance of the birds, but no studies were not found in the literature reporting that these changes were promoted by digestible tryptophan in the diets.
Different results were reported by Rizzo et al. (2008), which showed no effect on any performance variable on different levels of tryptophan to Japanese quails on growth (0.27 to 1.02%) and laying (0.23 to 0.98%). The authors concluded that diets containing same amount of protein and energy could be used 0.27 for growing phase and 0.23% of tryptophan for laying stage.
The accelerated growth rate of the quails in the present study exceeded the results obtained by Silva & Ribeiro (2001), increasing their initial body weight (8.82 g) by nine times, reaching the maximum body weight of 73.59 g with diets containing 0.42% DTrp. It should be noted that the requirement for maximum performance could be higher than the level studied.
In order to evaluate the performance of broilers (1-21 days) fed different levels of total tryptophan, Castro et al. (2000) reported that deficiency or excess of tryptophan negatively affect weight gain of broilers of both sexes. According to the authors, the difference observed in body weight gain of males compared with females makes it feasible to work with separate sexes, since males had higher weight gain. There were no similar studies to this on growing quails.
At the beginning of animal growth, there is more development of the anabolic rate, resulting in growth of the muscle tissue; however, over the time, the difference between anabolic and catabolic processes decrease until it reaches the full tissue development, when it stops growing. There is evidence that, in birds, some areas of the brain are sensitive to changes in the plasma levels of amino acids. When in excess, the sensitive areas would be in the center of hypothalamic control of appetite and when there is a deficiency, in the piriform cortex (Gonzáles, 2002). But it is unlikely that for each amino acid there are specific sensors that regulate feed intake.
Serotonin is directly proportional to plasmatic tryptophan, related to the dietary supply and regulates all kinds of neurobehavioral effects such as humor, pain perception, appetite and satiety. The production of serotonin by dietary manipulation seems possible using low protein
and high levels of tryptophan in the diet (Van Cauwenberghe & Relandeau (2000).
The feed conversion ratio did not differ significantly (P>0.05) between DTrp levels in the period of 1 to 14 days. These results suggest that FI and WG increased linearly as DTrp levels increase, not reaching the nutritional requirement. These results are in agreement with reports of Pinheiro et al. (2008), who found no effect of feed for Japanese quails fed with different levels of digestible tryptophan (0.12 to 0.28%).
The feed cost per kg of weight gain increased linearly (P<0.05) according to the digestible tryptophan level on diet (Table 3). According to regression equation cost = 1.023 + 2.48338 DTrp, for each 1% of DTrp added to diet, there was an increase in feed cost of US$ 2.48/kg weight gain.
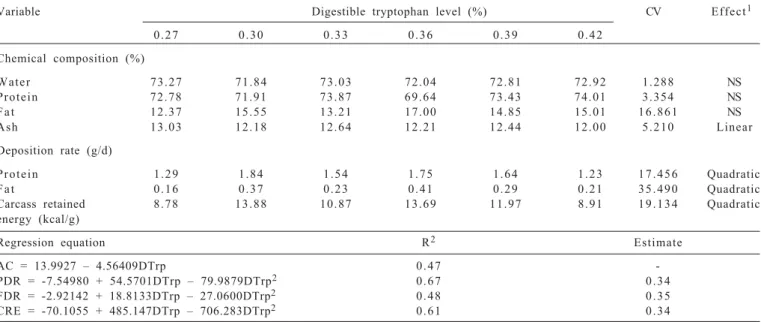
The levels of water, protein and fat in the carcass of quails were not affected (P>0.05) by digestible tryptophan levels (Table 4).
The carcass ash content decreased linearly (P<0.05) as levels of digestible tryptophan in the diet increased. The ash deposition and body mass ratio reduced due to increased levels of digestible tryptophan. There are no studies in the literature showing a direct relationship between the amino acid tryptophan and mineral deposition.
The protein and fat deposition rates and carcass retained energy showed a quadratic effect (P<0.05) according to digestible tryptophan levels (Table 4).
The maximum value of protein deposition rate (1.76 g/d), fat deposition rate (0.35 g/d) and carcass retained energy (13.20 kcal/g) were obtained with diets containing 0.34, 0.35 and 0.34% of digestible tryptophan, corresponding to a DL:DTrp ratio of 18.05, 18.62 and 18.09, respectively.
Table 3 - Mean values of performance, diet prices and diet cost per kilogram of weight gain of 1 to 14-day-old meat quails as a function of digestible tryptophan levels
Variable Digestible tryptophan level (%) CV Effect1
0 . 2 7 0 . 3 0 0 . 3 3 0 . 3 6 0 . 3 9 0 . 4 2
Feed intake (g/bird) 1 2 6 . 8 2 1 2 4 . 2 0 1 3 1 . 4 5 1 2 7 . 8 5 1 3 1 . 4 6 1 3 0 . 9 5 2 . 8 9 0 Linear Tryptophan intake (g/bird) 0 . 3 4 0 . 3 7 0 . 4 3 0 . 4 6 0 . 5 1 0 . 5 5 2 . 7 7 9 Linear Weight gain (g) 6 0 . 5 7 6 0 . 7 8 6 0 . 7 2 6 1 . 7 4 6 2 . 6 0 6 4 . 7 8 3 . 5 6 2 Linear Body weigh at 14 d (g) 6 9 . 4 1 6 9 . 5 9 6 9 . 5 4 7 0 . 5 7 7 1 . 4 2 7 3 . 5 9 3 . 1 3 6 Linear
Feed conversion (g/g) 2 . 0 9 2 . 0 5 2 . 1 7 2 . 0 7 2 . 1 0 2 . 0 2 3 . 1 1 1 NS
Cost (R$/kg weight gain) 1 . 6 9 1 . 7 3 1 . 9 1 1 . 9 1 2 . 0 2 2 . 0 2 3 . 0 4 8 Linear
Regression equation R2
Feed intake = 115.516 + 38.2116DTrp 0 . 5 0
Tryptophan intake = -0.0439129 + 1.41715DTrp 0 . 9 9
Weight gain = 53.2010 + 25.0848DTrp 0 . 8 2
Body weight = 62.0560 + 24.9933DTrp 0 . 8 1
Cost = 1.02300 + 2.48338DTrp 0 . 9 2
CV - coefficient of variation; DTrp - digestible tryptophan; NS - non-significant.
The values of protein and fat deposition rates can be explained as a function of higher FI, which allowed an ideal ratio of amino acids provided by the optimal level of digestible tryptophan (0.34%). Below this level, the protein deposition rate could be lower and this is also true for fat deposition. It is important to note that tryptophan is required at low levels in diet and is not directly related to protein deposition, as in the case of lysine.
According to Leeson (1995),quoted by Nascimento (2004), protein deposition is predetermined by the genetics of the bird. There is a limit to daily protein deposition, which cannot be compensated, regardless the feed intake. However, the variations in whole protein deposition may be a nutrition plan response. The amount of fat, on any day, is directly proportional to the energy amount available for synthesis.
The results of this study confirm those reported in Leeson (1995), quoted by Nascimento (2004): both lack and excess of amino acids cause imbalance, limiting the lean tissue deposition, increasing the amount of fat, as a result of deamination of proteins, resulting in energy. Therefore, the imbalance in amino acids supply may increase the fat deposition, but only for the amino acid in excess above the requirement.
As carcass energy retained is highly dependent on protein and fat deposition rates, as well the energetic value of protein and fat (5.66 and 9.37), it is expected that this parameter follow the same behavior of the related variables, corroborating the results of this study, although the
coefficients of variation are higher than 10%, showing a large data dispersion.
The weight gain improvement is a response of the increased feed intake, and consequently tryptophan intake, promoting better protein and fat deposition rates and carcass retained energy. The extra energy available for synthesis probably might have influenced the fat deposition rate.
The accelerated growth rate of quails demonstrate the importance of amino acids intake for muscle protein deposition, protein synthesis and maintenance of body protein turnover, besides the calcium and phosphorus needed for bone tissue development during the initial growth phase. Thus, the intake of nutrients below the requirements may impair the growth of the birds.
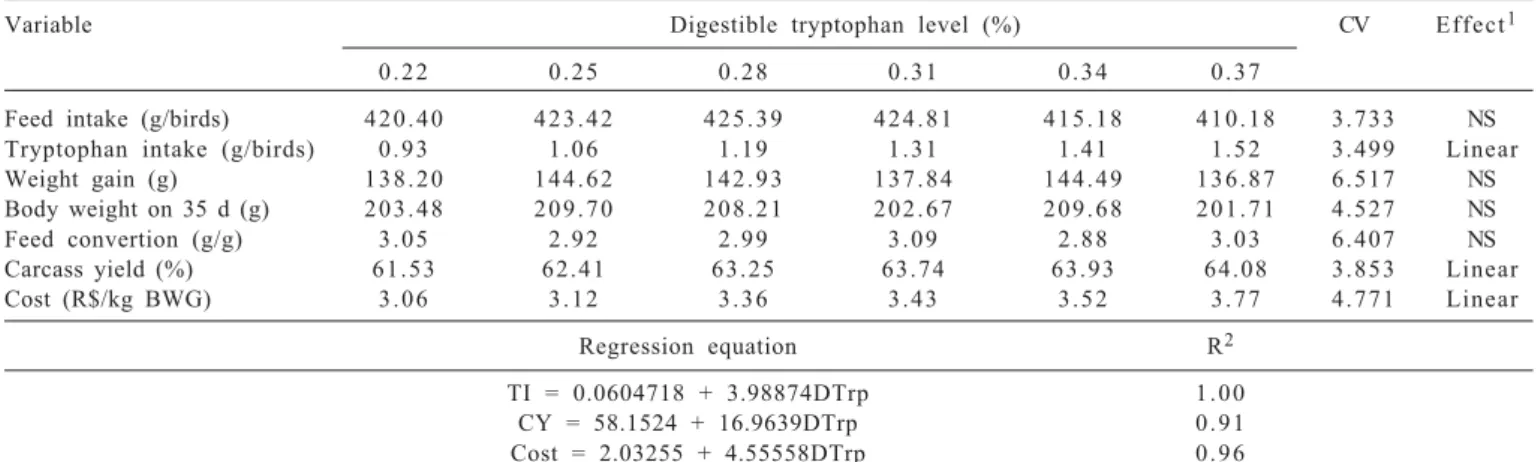
Tryptophan levels did not influence significantly (P>0.05) feed intake, weight gain, body weight or feed conversion ratio of 15 to-35-dayold quails (Table 5).
Meat quails have accelerated growth rate in their initial phase as a function of muscle tissue development. With time, the anabolic and catabolic processes slow down and the tissues stop growing. The tryptophan levels used in this study probably were not sufficient to improve bird performance, since this amino acid is required at a low concentrations in the diet.
In addition, there is a hierarchy between tissue growth, which implies that each developmental stage of the animal has a specific need for nutrients; in this experimemnt, the tryptophan levels failed to show any improvement on birds performance.
Table 4 - Mean values of carcass chemical composition, protein deposition rate, fat deposition rate, carcass retained energy of 14-day-old meat quails as a function of digestible tryptophan levels
Variable Digestible tryptophan level (%) CV Effect1
0 . 2 7 0 . 3 0 0 . 3 3 0 . 3 6 0 . 3 9 0 . 4 2
Chemical composition (%)
W a t e r 7 3 . 2 7 7 1 . 8 4 7 3 . 0 3 7 2 . 0 4 7 2 . 8 1 7 2 . 9 2 1 . 2 8 8 NS
P r o t e i n 7 2 . 7 8 7 1 . 9 1 7 3 . 8 7 6 9 . 6 4 7 3 . 4 3 7 4 . 0 1 3 . 3 5 4 NS
F a t 1 2 . 3 7 1 5 . 5 5 1 3 . 2 1 1 7 . 0 0 1 4 . 8 5 1 5 . 0 1 1 6 . 8 6 1 NS
Ash 1 3 . 0 3 1 2 . 1 8 1 2 . 6 4 1 2 . 2 1 1 2 . 4 4 1 2 . 0 0 5 . 2 1 0 Linear
Deposition rate (g/d)
P r o t e i n 1 . 2 9 1 . 8 4 1 . 5 4 1 . 7 5 1 . 6 4 1 . 2 3 1 7 . 4 5 6 Quadratic
F a t 0 . 1 6 0 . 3 7 0 . 2 3 0 . 4 1 0 . 2 9 0 . 2 1 3 5 . 4 9 0 Quadratic
Carcass retained 8 . 7 8 1 3 . 8 8 1 0 . 8 7 1 3 . 6 9 1 1 . 9 7 8 . 9 1 1 9 . 1 3 4 Quadratic energy (kcal/g)
Regression equation R2 Estimate
AC = 13.9927 – 4.56409DTrp 0 . 4 7
-PDR = -7.54980 + 54.5701DTrp – 79.9879DTrp2 0 . 6 7 0 . 3 4
FDR = -2.92142 + 18.8133DTrp – 27.0600DTrp2 0 . 4 8 0 . 3 5
CRE = -70.1055 + 485.147DTrp – 706.283DTrp2 0 . 6 1 0 . 3 4
CV -coefficient of variation; AC ash content; PDR protein deposition rate; FDR fat deposition rate; CRE carcass retained energy; NS nonsignificant; DTrp -digestible tryptophan.
Rizzo et al. (2008), evaluating the levels of digestible tryptophan (0.27 to 1.02%) in Japanese quails in the growth phase (30 to 44 days old), reported no significant effects on performance, which is in agreement with the present study.
The tryptophan intake showed a linear effect (P<0.05) as digestible tryptophan increased, ranging from 0.92 to 1.52 g/bird. According to the regression equation TI = 0.0604718 + 3.98874 DTrp, for every 1% more tryptophan added to diet, there was an increase in tryptophan intake of 3.99 g/bird of 15 to 35 days of age. The tryptophan intake value variations were achieved by the higher concentration of diet tryptophan, since feed intake did not show response to the treatments. Therefore, the lowest level of DTrp studied (0.22%) was sufficient to meet the nutritional requirement of birds, without compromising performance. In general, feed intake decreases when low tryptophan diets are available. However, even the lowest level of tryptophan in this experiment was not sufficient to reduce the feed intake.
Although feed intake did not take any effect (P>0.05), the values are slightly close to those reported by Albino & Barreto (2003), where the average daily feed intake for Japanese quails ranged from 23 to 26 g per bird. Similar responses were reported by Deponti et al. (2007), who found no effect on feed intake and feed efficiency with increased levels of tryptophan (0.13 to 0.21) for laying hen diets. The authors concluded that the lowest level (0.13%) was not low enough to suppress feed intake.
The regulation of feed intake by dietary protein occurs by activation of the control system in the central nervous system, and is based on detection of plasmatic levels of amino acids, especially those nutritionally essential (Gonzáles, 2002).
The carcass yield increased linearly (P<0.05) as levels of DTrp increase (Table 5). According to the regression equation (CY = 58.1524 + 16.9639 DTrp, R2 = 0.91) for each 1% more DTrp in the feed, there was increase of 16.96% the carcass yield of 35-day-old quails. This response is attributed mainly to accelerated growth rate of quails, and to hypertrophy of muscle fibers, especially the breast muscle and bones (Silva & Ribeiro, 2001).
Working with 49-day-old broilers fed different dietary levels of DTrp (0.14 to 0.20%), Castro et al. (2000) reported a quadratic effect on the weight of eviscerated carcass, thigh and drumstick weight and boneless breast weight, with estimates of 0.170, 0.173 and 0.167% of total tryptophan. The feed cost per kg of live weight gain increased linearly (P<0.05) following the diet levels of digestible tryptophan (Table 5). The high inclusion of synthetic amino acids in test diets increase the feed cost. According to the regression equation Cost = 2.03255 + 4.55558 DTrp, for each 1% more digestible tryptophan in the diet, there was an increase of US$ 4.56/kg body weight gain in feed cost.
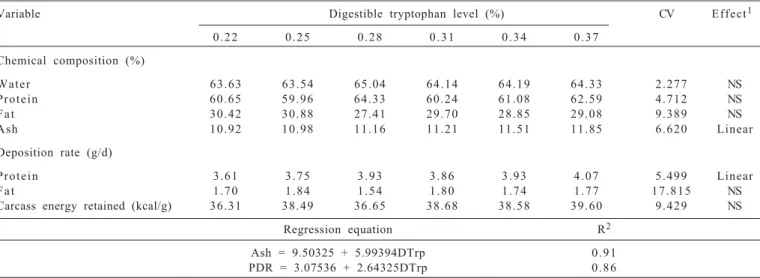
The water content, crude protein, fat, fat deposition rate and carcass energy retained showed no response (P>0.05) on increasing levels of digestible tryptophan in the diet (Table 6).
The carcass ash content (AC) increased linearly (P<0.05) as diet levels of digestible tryptophan increased (Table 6). According to regression equation (AC = 9.50325 + 5.99394 DTrp, R2 = 0.91) , for each 1% more DTrp in the diet, there is an improvement of 5.99% in ash content value at 35 days of age, indicating that quails had higher bone growth from 15 to 35 days.
According to Gonzáles & Sartori (2002), the bone tissue development is faster than muscle tissue, which, in turn, is
Table 5 - Average performance and carcass yield values of 15 to 35-days-old meat quails as a function of digestible tryptophan levels
Variable Digestible tryptophan level (%) CV Effect1
0 . 2 2 0 . 2 5 0 . 2 8 0 . 3 1 0 . 3 4 0 . 3 7
Feed intake (g/birds) 4 2 0 . 4 0 4 2 3 . 4 2 4 2 5 . 3 9 4 2 4 . 8 1 4 1 5 . 1 8 4 1 0 . 1 8 3 . 7 3 3 NS Tryptophan intake (g/birds) 0 . 9 3 1 . 0 6 1 . 1 9 1 . 3 1 1 . 4 1 1 . 5 2 3 . 4 9 9 Linear Weight gain (g) 1 3 8 . 2 0 1 4 4 . 6 2 1 4 2 . 9 3 1 3 7 . 8 4 1 4 4 . 4 9 1 3 6 . 8 7 6 . 5 1 7 NS Body weight on 35 d (g) 2 0 3 . 4 8 2 0 9 . 7 0 2 0 8 . 2 1 2 0 2 . 6 7 2 0 9 . 6 8 2 0 1 . 7 1 4 . 5 2 7 NS
Feed convertion (g/g) 3 . 0 5 2 . 9 2 2 . 9 9 3 . 0 9 2 . 8 8 3 . 0 3 6 . 4 0 7 NS
Carcass yield (%) 6 1 . 5 3 6 2 . 4 1 6 3 . 2 5 6 3 . 7 4 6 3 . 9 3 6 4 . 0 8 3 . 8 5 3 Linear
Cost (R$/kg BWG) 3 . 0 6 3 . 1 2 3 . 3 6 3 . 4 3 3 . 5 2 3 . 7 7 4 . 7 7 1 Linear
Regression equation R2
TI = 0.0604718 + 3.98874DTrp 1 . 0 0
CY = 58.1524 + 16.9639DTrp 0 . 9 1
Cost = 2.03255 + 4.55558DTrp 0 . 9 6
CV - coefficient of variation; TI - tryptophan intake; CY - carcass yield; DTrp - digestible tryptophan; BWG - body weight gain; NS - non-significant.
faster than adipose tissue. There is a hierarchy of growth between the tissues, and for each growth phase there is an influx of specific nutrients for tissue growth.
The carcass protein deposition rate (PDR) increased linearly (P<0.05) as levels of digestible tryptophan increased. According to regression equation (PDR = 3.07536 + 2.64325 DTrp, R2 = 0.86), for each 1% more digestible tryptophan in the diet, there was increase of 2.64% in the carcass protein deposition rate.
The nitrogen balance (NB) and nitrogen metabolization coefficient (MC) showed a linear decrease (P<0.05) as levels of digestible tryptophan on diet increased. According to the regression equation (NB = 1.93798 – 2.78146 DTrp, R2 = 0.49 and MC = 55.8046 – 68.8419 DTrp, R2 = 0.53) for each 1% more DTrp in the diet, NB dropped 2.78 g/day and MC, 68.84 % the. This response in this experiment indicates that when low levels of digestible tryptophan are added to diet, nitrogen retention increases, reducing the nitrogen excretion to environment, preventing nitrogen pollution.
According Rutz (2002), when an organism cannot obtain sufficient amounts of an essential amino acid through diet, it catabolizes body proteins for this amino acid. This process naturally leads to increased nitrogen excretion in birds, mainly in the form of uric acid. When the dietary limiting amino acid levels increase, the excretion of uric acid reduces, until a plateau is reached and the requirements are fulfilled. Low crude protein diets supplemented with synthetic amino acids, as well as better amino acid profile, are aimed at reducing the nitrogen excretion. The nitrogen excreted comes mainly from the exceeding diet amino acids, microbial protein, proteins non-digsted by the birds and, in minor proportion, endogenous nitrogen (Pénz Junior et al., 1999). The requirement for maximum protein deposition is linked to the requirements for maximum feed intake. L-tryptophan supplementation allows fixing the L-tryptophan content regardless of which ingredients may be supplemented. It helps maintain an appropriate balance of amino acids when low-protein diets are formulated, both in
Table 6 - Mean values of carcass chemical composition, protein deposition rate, fat deposition rate and carcass energy retained (CRE) of 35-day-old meat quails as a function of digestible tryptophan levels
Variable Digestible tryptophan level (%) CV Effect1
0 . 2 2 0 . 2 5 0 . 2 8 0 . 3 1 0 . 3 4 0 . 3 7
Chemical composition (%)
W a t e r 6 3 . 6 3 6 3 . 5 4 6 5 . 0 4 6 4 . 1 4 6 4 . 1 9 6 4 . 3 3 2 . 2 7 7 NS
P r o t e i n 6 0 . 6 5 5 9 . 9 6 6 4 . 3 3 6 0 . 2 4 6 1 . 0 8 6 2 . 5 9 4 . 7 1 2 NS
F a t 3 0 . 4 2 3 0 . 8 8 2 7 . 4 1 2 9 . 7 0 2 8 . 8 5 2 9 . 0 8 9 . 3 8 9 NS
Ash 1 0 . 9 2 1 0 . 9 8 1 1 . 1 6 1 1 . 2 1 1 1 . 5 1 1 1 . 8 5 6 . 6 2 0 Linear
Deposition rate (g/d)
P r o t e i n 3 . 6 1 3 . 7 5 3 . 9 3 3 . 8 6 3 . 9 3 4 . 0 7 5 . 4 9 9 Linear
F a t 1 . 7 0 1 . 8 4 1 . 5 4 1 . 8 0 1 . 7 4 1 . 7 7 1 7 . 8 1 5 NS
Carcass energy retained (kcal/g) 3 6 . 3 1 38 . 4 9 3 6 . 6 5 3 8 . 6 8 3 8 . 5 8 3 9 . 6 0 9 . 4 2 9 NS
Regression equation R2
Ash = 9.50325 + 5.99394DTrp 0 . 9 1
PDR = 3.07536 + 2.64325DTrp 0 . 8 6
CV -coefficient of variation; NS - non-significant; DTrp - digestible tryptophan.
1 Regression analysis.
Table 7 - Mean values of nitrogen balance and metabolization coefficient of 28 to 35-day-old meat quails as a function of digestible tryptophan levels
Variable Digestible tryptophan level (%) CV Effect1
0 . 2 2 0 . 2 5 0 . 2 8 0 . 3 1 0 . 3 4 0 . 3 7
NB (g/day) 1 . 4 5 0 . 9 5 1 . 2 9 1 . 1 7 0 . 9 5 0 . 8 9 2 1 . 5 3 3 Linear
MC (%) 4 2 . 8 5 3 2 . 1 2 4 0 . 3 3 3 6 . 5 8 3 1 . 7 4 2 9 . 3 7 1 8 . 2 9 0 Linear
Regression equation R2
NB = 1.93798 – 2.78146DTrp 0 . 4 9
MC = 55.8046 – 68.8419DTrp 0 . 5 3
CV -coefficient of variation.
the sanitary and environmental aspects, in addition to promoting feed intake increase, promoting better performance on low protein diets (Van Cauwenberghe & Relandeau (2000).
Conclusions
The digestible tryptophan requirement for maximum growth of meat quails from 1 to 14 days of age, is higher or equal to 0.42%, corresponding to a DL:DTrp ratio of 22.34 and from 15 to 35 days old is 0.22% corresponding to a DL:DTrp ratio of 12.72.
Acknowledgments
The research was financially supported by Fundação de Apoio ao Desenvolvimento do Ensino, Ciência e Tecnologia do Estado de Mato Grosso do Sul (FUNDECT) and Coordenação de Aperfeiçoamento de Pessoal de Nível Superior (CAPES). The research group of non-ruminant nutrition of Universidade Estadual de Maringá and everyone who contributed directly or indirectly to this study is gratefully acknowledged.
References
ALBINO, L.F.T.; BARRETO, S.L.T. Codornas: criação de codornas para produção de ovos e carne. Viçosa, MG: Aprenda Fácil, 2003. 2 8 9 p .
ARAÚJO, L.F.; JUNQUEIRA, O.M.; ARAÚJO, C.S.S. Redução do nível protéico da dieta, através da formulação baseada em aminoácidos digestíveis. Ciência Rural, v.34, n.4, p.1197-1201, 2 0 0 4 .
BELLAVER, C.; FIALHO, E.T.; PROTAS, J.F.S. et al. Radícula de malte na alimentação de suínos em crescimento e terminação.
Pesquisa Agropecuária Brasileira, v.20, n.8, p.969-74, 1 9 8 5 .
CASTRO, A.J.; GOMES, P.C.; PUPA, J.M.R. et al. Exigência de triptofano para frangos de corte de 1 a a21 dias de idade. Revista Brasileira de Zootecnia, v.29, n.6, p.1743-1749, 2000. CORRÊA, G.S.S.; SILVA, M.A.; CORRÊA, A.B. et al. Exigência de
metionina + cistina total para codornas de corte em crescimento.
Arquivo Brasileiro de Medicina Veterinária e Zootecnia, v.58, n.3, p.414-420, 2006.
CORRÊA, G.S.S.; SILVA, M.A.; CORRÊA, A.B. et al. Exigência de proteína bruta e energia metabolizável para codornas de corte EV1 em crescimento. Arquivo Brasileiro de Medicina Veterinária e Zootecnia, v.59, n.5, p.1278-1286, 2007. DEPONTI, B.J.; FARIA, D.E.; FARIA FILHO, D.E. et al Exigência
de triptofano e padrão de recuperação do desempenho de poedeiras comerciais após alimentação com rações deficientes em triptofano. Revista Brasileira de Zootecnia, v.36, n.5, p.1324-1330, 2007.
FRAIHA, M. Atualização em nutrição protéica para frangos de corte, 2002. Available at: <www.lisina.com.br/nutrição/palestra.asp>. Accessed on: Nov. 20, 2003.
FRAGA, A.L.; MOREIRA, I.; FURLAN, A.C. et al. Lysine requirement of starting barrows from two genetic groups fed on low crude protein diets. Brazilian Archives of Biology and Technology, v.51, n.1, p.49-56, 2008.
FREITAS, A.C.; FUENTES, M.F.F.; FREITAS, E.R. et al. Níveis de proteína bruta e energia metabolizável na ração para codornas de corte. Revista Brasileira de Zootecnia, v.35, n.4, p.1705-1710, 2006 (supl.).
GONZÁLES, E. Ingestão de alimentos: mecanismos regulatórios. In: MACARI, M.; FURLAN, R.L.; GONZÁLES, E. (Eds.)
F i s i o l o g i a a v i á r i a a p l i c a d a a f r a n g o s d e c o r t e. 2 . e d . Jaboticabal: FUNEP/UNESP, 2002. 375p.
GONZÁLES, E.; SARTORI, J.R. Crescimento e metabolismo muscular. In: MACARI, M.; FURLAN, R.L.; GONZÁLES, E. (Eds.) Fisiologia aviária aplicada a frangos de corte. 2.ed. Jaboticabal: FUNEP/UNESP, 2002. 375p.
M O U R A , A . M . A . ; F O N S E C A , J . B . ; TA K ATA , F. N . e t a l . Determinação da energia metabolizável de alimentos para c o d o r n a s j a p o n e s a s e m p o s t u r a . A rq u i v o B r a s i l e i ro d e Medicina Veterinária e Zootecnia, v.62, n.1, p.178-183, 2 0 1 0 .
NASCIMENTO, A. Deposição de proteína na carcaça de frango de corte. Ave Word, v.2, n.9, p.64-65, 2004.
PENZ JUNIOR, A.M.; MEINERZ, C.E.; MAGRO, N. Efeito da nutrição na quantidade e na qualidade dos dejetos de suínos. In: REUNIÃO ANUAL DA SOCIEDADE BRASILEIRA DE Z O O T E C N I A , 3 6 . , 1 9 9 9 , P o r t o A l e g r e . A n a i s . . . P o r t o Alegre: UFRGS, 1999. p.281-294.
PINHEIRO, S.R.F.; BARRETO, S.L.T.; ALBINO, L.F.T. et al Efeito dos níveis de triptofano digestível em dietas para codornas japonesas em postura. Revista Brasileira de Zootecnia, v.37, n . 6 , p . 1 0 1 2 - 1 0 1 6 , 2 0 0 8 .
R I Z Z O , P. V. ; G U A N D O L I N I , G. C . ; A M O R O S O , L . e t a l . Triptofano na alimentação de codornas japonesas nas fases de recria e postura. Revista Brasileira de Zootecnia, v.37, n.6, p.1017-1022, 2 0 0 8 .
ROSTAGNO, H.S.; ALBINO, L.F.T.; DONZELE, J.L. et al. Tabelas brasileiras para aves e suínos: composição de alimentos e exigências nutricionais. 2.ed. Viçosa, MG: UFV, Departamento de Zootecnia, 2005. 186p.
RUTZ, F. Metabolismo intermediário. In: MACARI, M.; FURLAN, R.L.; GONZÁLES, E. (Eds.) Fisiologia aviária aplicada a frangos de corte. 2.ed. Jaboticabal: FUNEP/UNESP, 2002. 3 7 5 p .
SAKOMURA, N.K.; ROSTAGNO, H.S. Métodos de pesquisa em nutrição para monogástricos. Jaboticabal: Funep, 2007. 2 8 3 p .
SCHERER, C. Exigência nutricional de energia metabolizável, l i s i n a d i g e s t í v e l e m e t i o n i n a + c i s t i n a d i g e s t í v e l p a r a codornas de corte em fase de crescimento. 2009. 118f. Tese (Doutorado em Zootecnia) – Universidade Estadual de Maringá, Maringá.
SILVA, J.H.V.; RIBEIRO, M.L.G. Tabela nacional de exigência nutricional de codornas (C o t u r n i x c o t u r n i x j a p o n i c a). Bananeiras: DAP/UFPB/Campus IV, 2001. 19p.
SILVA, D.J.; QUEIROZ, A.C.D. Análises de alimentos: métodos químicos e biológicos. 3.ed. Viçosa, MG: UFV, 2004. 235p. SILVA, R.M.; FURLAN, A.C.; TON, A.P.S. et al. Exigências nutricionais de cálcio e fósforo de codornas de corte em crescimento. Revista Brasileira de Zootecnia, v.38, n.8, p.1509-1517, 2009.