(Annals of the Brazilian Academy of Sciences)
Printed version ISSN 0001-3765 / Online version ISSN 1678-2690 www.scielo.br/aabc
http://dx.doi.org/10.1590/0001-3765201520140121
Diet of the chola guitarfish,
Rhinobatos percellens
(Rhinobatidae), in the Paranaguá Estuarine complex
WANESSA P.D. DO CARMO1, HUGO BORNATOWSKI2, ELTON C. OLIVEIRA1,3 and LUÍS L. FÁVARO1 1Universidade Federal do Paraná, Setor de Ciências Biológicas,
Laboratório de Reprodução e Comunidade de Peixes, Departamento de Biologia Celular, Centro Politécnico, s/n, Jardim das Américas, Caixa Postal 19031, 81531-990 Curitiba, PR, Brasil
2
Instituto de Pesca, Divisão de Pesca Marítima, Avenida Bartolomeu de Gusmão, 192, Ponta da Praia, 11030-906 Santos, SP, Brasil
3Universidade Tecnológica Federal do Paraná, Campus Dois Vizinhos, Estrada para Boa Esperança, Km 04, 85660-000 Dois Vizinhos, PR, Brasil
Manuscript received on June 25, 2014; accepted for publication on September 5, 2014
ABSTRACT
The chola guitarfish, Rhinobatos percellens, is one of the most-captured batoids on the Brazilian coast, and an important predator of benthic community. Stomachs from R. percellens were sampled in the Paranaguá estuarine complex (March/2006 to March/2007 and October/2008 to September/2009). The stomachs obtained were used for describing the diet of R. percellens, and verifying if there are seasonal and ontogenetic differences in theirfeeding into the estuarine area. The general analysis showed a specialized diet with a predominance of three species in food contents: Leptochela serratorbita, Caridea remains and
Ogyrides alphaerostris. Ontogenetic and seasonal analysis did not reveal significant differences in the food
consumption. These data reveal that R. percellens is a specialist predator of L. serratorbita, and this food component is consumed by all size classes.
Key words: Elasmobranchii, Rhinobatidae, diet, especialist, Caridea, estuary.
Correspondence to: Wanessa P.D. do Carmo E-mail: wancarmo@yahoo.com.br
INTRODUCTION
Predators and mesopredators can have a
funda-mental influence on the structure and function of
marine communities. Elasmobranchs can affect
populations of invertebrates and fishes, representing
an important role in the transfer of energy among marine trophic levels (Heithaus et al. 2008, Ferretti et al. 2010). The study of the diet and feeding habits
of fishes, through the analysis of stomach contents,
has been standard practice for understanding basic biological aspects and the establishment of trophic
relationships in an ecosystem (Gerking 1994, Braga et al. 2012, Bornatowski et al. 2014a).
Batoid fish regularly occupy intermediate trophic
levels (trophic level <4.0) in their communities (e.g. Navia et al. 2007, Vaudo and Heithaus 2011, Bornatowski et al. 2014b). Therefore, batoids can be considered mesopredators that provide an important link between top predators and lower trophic levels in the marine ecosystem, and play an important role in marine ecosystem dynamics (Vaudo and Heithaus 2011).
length. It is found in coastal waters up to 110 meters deep (McEachran and Carvalho 2002), from the Gulf of Mexico to northern Argentina (Figueiredo 1977). It is one of the most-captured rays on the Brazilian coast (Chaves and Robert 2003, Costa and Chaves 2006, Bornatowski et al. 2009), and an important component of the
coastal benthic ecosystem and fisheries around
the world, as others rhinobatids (Blanco-Parra et al. 2012). Studies show that the species has been
overexploited by fisheries, particularly on the
Brazilian continental shelf (De-Franco et al. 2010). Meneses et al. (2005) report that R. percellens has no commercial value in some states of northeastern Brazil, while Costa and Chaves (2006) and Bornatowski et al. (2010) report commercialization in the south. Based on preliminary investigations in the Paranaguá Estuarine Complex (a subtropical estuary in southern Brazil), R.percellens of several size classes can be found throughout the year (E.C. Oliveira and L.F. Fávaro, unpublished data).
There are few studies about feeding ecology of R. percellens, and all of them have been carried out on the continental shelf (e.g. Shibuya et al. 2005, Bornatowski et al. 2010, Grijalba-Bendeck et al. 2012). The lack of studies of R. percellens in estuaries and the lack of data about feeding biology of elasmobranchs in these environments in Brazil are factors that triggered this work, which showed that R. percellens use the estuary for feeding purpose. The aims of the present study were to: (i) describe the feeding of R. percellens in the Paranaguá Bay; (ii) assess ontogenetic and seasonal variations in diet; and iii) verify if this specie is a generalist or a specialist feeder.
MATERIALS AND METHODS
STUDY AREA
The Paranaguá Complex (between 25° 15´ S – 48° 45´ W and 25° 35´ S – 48° 10´ W), covering 551.8 km2 (Noernberg et al. 2004), is the largest estuary of the Brazilian Southern coast (Bigarella et al.1978),
formed by Guaraqueçaba, Pinheiros, Laranjeiras, Paranaguá and Antonina bays. It is connected to the ocean by narrow channels (relative to the total
extent of the estuary, but sufficient to allow great influence from the adjacent ocean) (Fig. 1). The
inland areas, with truly estuarine characteristics, are less than 5 m deep, while the regions with
greater oceanic influence are up to 30 m deep
(Iapardes 2001). The bottom sediment in the funnel
zone is composed of fine sand and silt, while in the lower zone, it is composed of well-sorted fine to very fine sand (Soares et al. 1997). The tidal
regime is semi-diurnal with diurnal inequalities. Mean neap and spring tidal heights are 1.3 and 1.7 m respectively at the bay mouth, and 2.0 and 2.7 m at Antonina Bay (Marone and Jamiyanaa 1997). Mean freshwater inputs of 41 m3 s−1 (1997 winter) and 182 m3 s−1 (1998 summer) were quantified for the drainage area upstream of the Paranaguá Harbour (Mantovanelli 1999).
The climate is Mesothermal Humid Subtropical (Cfa), with hot summers and a dry season that is not
well defined (Maack 1981). Lana et al. (2001) reported
a rainy period during the summer and a dry period during the winter. For the region, average annual precipitation is 2500 mm and average humidity is 85% (Lana et al. 2001). The salinity inside the estuary, on the sites where samples were obtained, varied from 25 to 31 (Oliveira and Fávaro 2011), and outside the estuary it was 34 (SEMA 2006).
DATA COLLECTION
the international practices for animal use and care under the control of an internal committee of the Universidade Federal do Paraná, Brazil.
After collecting, specimens were anesthetized with benzocaine, and had their spinal cord quickly sectioned, before being transported to the laboratory. Sex and morphometric data (total length - TL - in millimeters, total weight in grams) were determined. The digestive tract was removed, and the degree of fullness (DF) was determined macroscopically, according to the classes: DF 1 = 0 (empty stomach), DF 2 = 1-25%, DF 3 = 26-50%, DF 4 = 51-75%, DF 5 = 76-100%. Stomach contents were examined under a stereoscopic
microscope. The identification of food items was
done to the lowest possible taxonomic level. On this study, the pattern used for season was: Spring, from October to December; Summer, from January to March; Autumn, from April to June and Winter from July to September.
DATA ANALYSIS
Frequency of occurrence (%), numerical (%) and weight (%) were obtained to compute the Index of Relative Importance (IRI). Frequency of occurrence (%FO), numerical (%N) and weight (%W), were represented by the respective formulas: %FO = (ei / E) x 100, where %FO = percent frequency of occurrence of the sampled item, ei = quantity of stomachs containing item i, E = total number of stomachs containing prey, %N = (ni / N) x 100, where %N = percent numerical frequency of the sampled item, ni = number of items i ingested, N = total number of ingested items, %W = (wi / W) x 100, where %W = percent weight frequency of the sampled item, wi = weight of item i, W = total weight of the sampled items (Hyslop 1980, Hacunda 1981). For stomach contents analysis, only 56 stomachs (of 62) were used, and stomachs with material completely digested or an empty stomach were excluded from the analysis.
To assess the importance of various prey taxa in the R. percellens diets, the Index of Relative
Impor-tance (IRI, Pinkas et al. 1971, modified by Hacunda
1981) was calculated: IRI = (%N+%W)*%FO. The values of IRI were standardized in percentage values according to Cortés (1997).
For the ontogenetic analysis, specimens were divided into four size classes from: 1) 15.0 to 30.9 cm, 2) 31.0 to 45.9 cm, 3) 46.0 to 60.9 cm and 4) 61.0 to 75 cm. To test ontogenetic variation in diets and seasons, a similarity matrix was calculated using
Bray-Curtis similarity coefficient, produced from
percentage values of the IRI of each food item. Diet similarity was analyzed with Non-Metric Multidimensional Scaling Analysis (NMDS) and analyse of similarity (ANOSIM) were used to test the null hypothesis of no differences in the diet composition between factors. Analyses of percentage of similarity (SIMPER) were used to estimate the contribution of each prey category to ontogenetic variation in diets. The analyses were performed using PRIMER v6 software (Clarke and Gorley 2006). The NMDS analysis was selected over other ordination methods because it makes fewer assumptions about the nature of the data, allows the use of any distance measure of the samples, and also seeks to preserve the distance relationships among the samples in the low-dimensional ordination space (Clarke 1993). A cluster analysis was produced using the Bray-Curtis measure to verify similarity between
seasons. Seasons were defined as: Spring (October
to December), Summer (January to March), Autumn (April to June), Winter (July to September).
Diet niche breath was estimated using Levin’s (Bi): Bi = 1/ΣP2
j, where Pj is the fraction by weight
of each food in the diet j(ΣPj=1) (Krebs 1999). The
values were standardized (BA) so that it ranged
from 0 to 1 by using the equation BA= (Bi-1)/(N-1),
where N was the number of classes (Krebs 1999). Low values indicate diets dominated by few preys items (specialist predators) while higher values indicate generalist diets.
RESULTS
The 62 specimens of R. percellens caught, ranged from 17.2 cm TL to 72.6 cm TL. Regarding the degree of fullness (DF) for the 62 specimens analyzed in the study, the results are shown in Table I. Seasonal analysis of the DF showed only empty stomach (DF = 1) was observed during the summer. Individuals with stomach contents were found in all seasons, with different degrees of fullness. Stomachs with DF = 2 (containing little food) predominated, followed by those with DF = 4 (almost full) (Table I and Fig. 2).
TABLE I
Degree of Fullness (DF) for the 62
specimens analyzed in the study period.
Degree Fullness n
%
1 1 1.6
2 26 41.9
3 13 21.0
4 15 24.2
5 7 11.3
Rhinobatos percellens had a specialized diet (BA = 0.06), and according to %IRI, the main
food items were: Leptochela serratorbita Bate, 1888 (combclaw shrimp), Ogyrides alphaerostris (Kingsley, 1880) (estuarine long eye shrimp) and Caridea remains (including L. serratorbita and O. alphaerostris) (Table II). In relation to frequency of occurrence (%), Caridea remains and L. serratorbita were most frequently observed, respectively in that order, followed by Brachyura remains.
The size classes for the NMDS analysis ranged from: 1) 15.0 to 30.9 cm (n=16), 2) 31.0 to 45.9 cm (n=7), 3) 46.0 to 60.9 cm (n=23) and 4) 61.0 to 75.0 cm (n=16), carried out using Bray-Curtis similarity, did not result in separation of size classes (Fig. 3). Using ANOSIM, no
significant difference was detected between class
Figure 2 - Distribution of the seasonal percentage frequency of the degree of fullness of R.percellens. The numbers over the bars indicate the absolute frequency.
Taxonomic group %N %FO %W %IRI Food items %N %FO %W %IRI
Brachyura 9 87.6 33.4 8.4
Callinectes ornatus 0.7 8.9 8.7 1.2
Callinectes sp. 2.8 16.1 13.3 3.7
Hepatus pudibundus 5.0 14.3 5.6 2.2
Ocypodidae 0.1 1.8 0.9 <0.01
Panopeus sp. 0.3 3.6 0.3 <0.01 Brachyura´s remains <0.1 23.2 1.7 0.6 Portunidae´s remains <0.1 17.9 2.8 0.7
Uca sp. 0.1 1.8 0.1 <0.01
Dendrobranchiata 2.8 26.9 13.2 1.3
Acetes sp. 0.1 1.8 <0.1 <0.01
Litopenaeus schmitti 0.4 3.6 9.5 0.5
Lucifer sp. 0.1 1.8 <0.1 <0.01
Pleoticus muelleri 1.4 12.5 2.5 0.7
Rimapenaeus constrictus 0.7 5.4 1.0 0.1
Sicyonia dorsalis 0.1 1.8 0.2 <0.01
Pleocyemata 75.9 185.7 36.8 86.6
Alpheus heterochaelis 0.1 3.6 0.5 <0.01
Exhippolysmata oplophoroides 0.1 1.8 <0.1 <0.01
Leptochela serratorbita 37.5 64.3 10.1 44.1
Ogyrides alphaerostris 34.3 10.7 2.7 5.7
Palaemonetes sp. 0.7 7.1 0.1 0.1 Caridea´s remains 3.1 96.4 23.3 36.7
Thalassinidea 0.1 1.8 0.1 <0.01
Amphipoda 0.5 3.6 0.2 0 Unidentified 0.4 1.8 0.1 <0.01
Gamaridae 0.1 1.8 0.1 <0.01
Mysidaceae 0.1 1.8 0.1 <0.01 Mysidaceae 0.1 1.8 0.1 <0.01
Mollusca 7.6 3.6 0.2 0.4 Bivalve 7.6 3.6 0.2 0.4
Polychaeta <0.1 1.8 0.1 <0.01 Polychaeta <0.1 1.8 0.1 <0.01
TABLE II
Percentage frequency of number of specimens (%N), percentage frequency of occurrence (%FO), percentage frequency of weight (%W) and percentage
TABLE II (continuation)
Taxonomic group %N %FO %W %IRI Food items %N %FO %W %IRI
Teleostei 3.7 23.2 15.6 3
Pomadasys corvinaeformis 0.1 1.8 9.2 0.2
Synodus foetens 0.1 1.8 0.1 <0.01 Teleostei´s remains 3.5 19.6 6.3 2.8
Figure 3 - MDS of diet of different size classes of R. percellens, based on Bray-Curtis similarity of transformed IRI values. Four classes range from: 1) 15 to 30 cm (n=16), 2) 31 to 45 cm (n=7), 3) 46 to 60 cm (n=23) and 4) 61 to 75 cm (n=16).
Taxonomic group Food items Sum Aut Win Spr
Brachyura
C. ornatus 2.7 0.4 2.0 0.9
Callinectes sp. 9.1 10.8 1.5
H. pudibundus 18.1 0.6 0.5 1.4
Ocypodidae 1.1
Panopeus sp. 0.3
Brachyura´s remains 0.6 0.5 0.3
Portunidae´s remains 3.5 0.3 4.5
Uca sp. 0.4
Dendrobranchiata
Acetes sp. <0.01
L. schmitti 1.3 1.1
Lucifer sp. 0.3
P. muelleri 4.7 0.6 0.2
R. constrictus 0.1 0.1 0.8
S. dorsalis 0.5
TABLE III
Percentage of the seasonal IRI of the food items of R. percellens in the Paranaguá Estuarine Complex. Sum = summer, Aut =
Seasonal analysis of food item occurrence
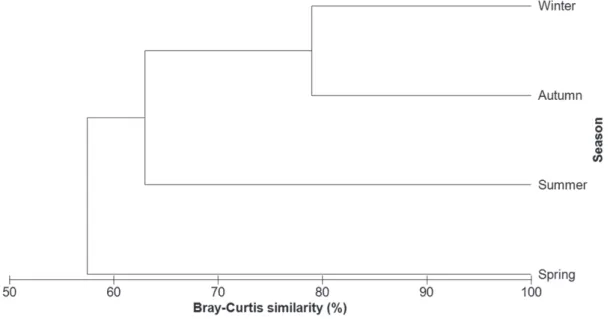
verified that the 2 main prey of R. percellens occurred in all seasons (Table III). Seasonal analysis of Bray-Curtis similarity, carried out on 29 food items, using the percentage of the Index of Relative Importance (%IRI), showed greater similarity between autumn and winter. Spring had the lowest similarity to the others seasons in both analyses (Fig. 4).
DISCUSSION
The occurrence of the species was verified through
the catches in the estuarine areas of Laranjeiras and Paranaguá bays, which have a greater marine
influence, according to the environmental analysis
carried out by Lana et al. (2001). The sample size is low because the study occurred in an estuary, where the abundance of this species is in fact low (Fávaro and Oliveira personal communication), and also contrasts with the very low numbers or absence of any species of elasmobranch in estuarine studies of Lenanton (1977), Loneragan et al. (1989), Potter et al. (1983) and Potter and Hyndes (1994). According to Espinoza et
al. (2011), the patterns of site fidelity and inter-annual
use remain uncertain for many coastal elasmobranchs
due to the lack of quantitative behavioral data. The specimens of R. percellens caught in the estuary were smaller (< 73.0 cm - TL) than the specimens obtained by Bornatowski et al. (2010), who used gillnets on the continental shelf in Southern Brazil (between the coasts of Paraná and Santa Catarina). The difference
in length could be related to the fishing method,
associated with environment characteristics (estuary x continental shelf).
The only specimen with an empty stomach was caught during the summer and was the smallest individual in the study (172 mm TL). This total length was close to size-at-birth reported in the literature (Rocha and Gadig 2013). Therefore, the specimen with empty stomach could be explained by the fact that this individual still had a yolk reserve that could supply all necessities during
the first days of life, according to the description of Brazilian Guitarfish Rhinobatos horkelii Müller and Henle, 1841 carried out by Rosângela Lessa (personal communication).
Most elasmobranchs are exclusively marine, but some species have the ability to tolerate low salinities, thus being able to live in estuaries, rivers and lakes (Wosnick and Freire 2013). Rhinobatos TABLE III (continuation)
Taxonomic group Food items Sum Aut Win Spr
Amphipoda Unidentified 0.2
Gammaridae 0.1
Mysidaceae Mysidaceae <0.01
Pleocyemata
A. heterochaelis <0.01 0.3
E. oplophoroides 0.1
L. serratorbita 24.0 52.1 66.0 17.8
O. alphaerostris 0.3 1.0 23.0
Palaemonetes sp. 0.3 0.2 0.1 0.1 Caridea´s remains 28.4 27.0 26.0 44.3
Thalassinidea 0.1
Mollusca Bivalve 1.4 0.6
Polychaeta Polychaetas <0.01
Teleostei
P. corvinaeformis 2.3
Teleostei´s remains 6.0 1.4 1.4 6.3
Figure 4 - Cluster of the seasonal analysis of the Bray-Curtis similarity carried out for the 29 food items consumed by R. percellens in the Paranaguá Estuarine Complex.
percellens is sometimes caught in estuarine regions, and probably use this area to feeding. This fact is further supported by low catch in this paper and the high predominance of stomach fullness.
The food items found in this study pertained to diets of different species of the family Rhinobatidae. In general, decapod crustaceans tended to be the most important prey of rhinobatid species (e.g. Talent 1982, Kyne and Bennett 2002, White et al. 2004, Bornatowski et al. 2010, 2014b). The importance of Polychaeta and Amphipoda was reduced in R. percellens feeding, which agreed with the results obtained on the continental shelf for the same species (Bornatowski et al. 2010, 2014b). Other food items, such as the squid Lolliguncula brevis (Blainville, 1823), was one of the food items of R. percellens on the continental shelf of Southern Brazil (Bornatowski et al. 2010, 2014b), but it did not appear on this study in estuarine waters.
Rhinobatos percellens is considered a specialist feeder; even though it makes use of 29 food items, few are predominant. The relative abundance of a particular prey item in elasmobranchs’ diets may be related to its abundance in the environment,
escape probability, foraging habitats or competition between predator species (Wetherbee and Cortés 2004, Heithaus 2004). The primary items found in the diet of the R. percellens (i.e. L. serratorbita and O. alphaerostris) are abundant crustaceans in estuarine areas (Calil 2005). Therefore, prey abundance appears to play an important role in determining the consistency of these items in all length classes and seasons. On the other hand, R. percellens, has a relatively larger mouth, allowing the consumption of elusive larger prey such as blue
crabs and flatfishes (Dean et al. 2007). This fact was
observed in the continental shelf by Bornatowski et al. (2010, 2014b), but not in the present study. So, we hypothesized that 1) R. percellens feed on the most abundant preys in the environment or, 2) large individuals >75 cm - TL (see Bornatowski et al. 2010, 2014b) feed on elusive larger preys.
remains) was consumed by all classes and during all seasons. A hypothesis to be tested is the occupation of R. percellens between smaller (<70 cm TL) and larger individuals (>70 cm) in different environments: estuarine and continental shelf waters. These results are not determinants to the knowledge on the feeding habits of R. percellens in this area, because the sample size was very low, but
these results are important as a first sample about
feeding of R. percellens in this estuarine area.
ACKNOWLEDGMENTS
We thank Natascha Wosnick and Bianca Possamai for reviewing the manuscript, and two anonymous reviewers for helpful comments on the paper. We thank the Araucaria Foundation for the scholarship to WPDC, and the Conselho Nacional de
Desenvolvimento Científico e Tecnológico (CNPq)
for the scholarship to HB. This work was performed with IBAMA license number 14683-1.
RESUMO
A raia viola, Rhinobatos percellens, é um dos batoídeos mais capturados na costa brasileira, e é um importante predador da comunidade bêntica. Estômagos de R. percellens foram amostrados no complexo estuarino de Paranaguá (Março/2006 a Março/2007 e Outubro/2008 a Setembro/2009). Os estômagos obtidos foram utilizados para descrever a dieta de R. percellens, e verificar se há
diferenças sazonais e ontogenéticas em sua alimentação nesta área estuarina. A análise geral mostrou uma dieta especializada com a predominância de três espécies em seu conteúdo alimentar: Leptochela serratorbita, restos de Caridea e Ogyrides alphaerostris. Análises ontogenéticas e sazonais não revelaram diferenças significantes no consumo de alimento. Estes dados revelam que R. percellens é um predador especialista em
L. serratorbita, e este alimento é consumido por todas as classes de tamanho.
Palavras-chave: Elasmobranchii, Rhinobatidae, dieta, especialista, Caridea, estuário.
REFERENCES
BIGARELLA JJ, BECKER RD, MATOS DJ AND WERNER A.
1978. A Serra do Mar e a porção oriental do Estado do Paraná – um problema de segurança ambiental e nacional (contribuição à geografia, geologia e ecologia regional). Curitiba, Governo do Estado do Paraná, Secretaria de Estado do Planejamento/Associação de Defesa e Educação Ambiental (ADEA).
BLANCO-PARRA M, GALVÁN-MAGAÑA F, MÁRQUEZ-FARÍAS J AND NIÑO-TORRES C. 2012. Feeding ecology and trophic level of the banded guitarfish, Zapteryx exasperata, inferred from stable isotopes and stomach contents analysis. Environ Biol Fish 95(1): 65.
BORNATOWSKI H, ABILHOA V AND CHARVET-ALMEIDA P. 2009. Elasmobranchs of the Paraná coast, southern Brazil, south-western Atlantic. Mar Bio Rec 2(158): 1-6.
BORNATOWSKI H, NAVIA AF, BRAGA RR, ABILHOA V AND CORRÊA MFM. 2014a. Ecological importance of sharks and rays in a structural foodweb analysis in southern Brazil. ICES J of Mar Sci 7(71): 1586-1592.
BORNATOWSKI H, ROBERT MC AND COSTA L. 2010. Feeding of guitarfish Rhinobatos percellens (Walbaum, 1972) (elasmobranchii, Rhinobatidae), the target of Artisanal fishery in southern Brazil. Braz J Oceanogr 58(1): 45-52. BORNATOWSKI H, WOSNICK N, CARMO WPD, CORRÊA MFM
AND ABILHOA V. 2014b. Feeding comparisons of four batoids (Elasmobranchii) in coastal waters of southern Brazil. J Mar Biol Assoc UK 94: 1491-1499.
BRAGA RR, BORNATOWSKI H AND VITULE JRS. 2012. Feeding ecology of fishes: an overview of worldwide publications. Rev Fish Biol Fisher 22(4): 915-929.
CALIL MS. 2005. Distribuição espacial dos crustáceos decápodes e anfípodes de substratos não consolidados sublitorais da Baía de Sepetiba, Rio de Janeiro, RJ (Brasil). Master dissertation – Universidade Federal Fluminense, Rio de Janeiro, 145 p. (Unpublished).
CHAVES PT AND ROBERT MC. 2003. Embarcações, arte, e procedimentos da pesca artesanal no litoral sul do Estado do Paraná, Brasil. Atlântica (Rio Grande) 25(1): 53-59. CLARKE KR. 1993. Non-parametric multivariate analysis of
changes in community structure. Aust J Ecol 18: 117-143. CLARKE KR AND GORLEY RN. 2006. User Manual/Tutorial.
PRIMER-E, v. 6, Plymouth.
CORTÉS E. 1997. A critical review of methods of studying fish feeding based on analysis of stomach contents: application to elasmobranch fishes. Can J Fish Aquatic Sci 54: 726-738. COSTA L AND CHAVES PTC. 2006. Elasmobranchs caught by
artisanal fishing in the south cost of Paraná State and north cost of Santa Catarina State, Brazil. Biota Neot 6(3): Avaliable at http://www.biotaneotropica.org.br/v6n3/pt/ abstract?article+bn02706032006.
DE-FRANCO B, MENDONÇA FF, HASHIMOTO DT, P ORTO-FORESTI F, OLIVEIRA C AND FORESTI F. 2010. Forensic identification of the guitarfish species Rhinobatos horkelli, R. percellens and Zapteryx brevirostris using multiplex-PCR. Mol Ecol Res 10: 197-199.
ESPINOZA M, FARRUGIA TJ AND LOWE CG. 2011. Habitat use, movements and site fidelity of the gray smooth-hound shark (Mustelus californicus Gill 1863) in a newly restored southern California estuary. J Exp Mar Biol Ecology 401(1): 63-64.
FERRETTI F, WORM B, BRITTEN GL, HEITHAUS MR AND LOTZE HK. 2010. Patterns and ecosystem consequences of shark declines in the ocean. Ecol Lett 13: 1055-1071.
FIGUEIREDO JL. 1977. Manual de Peixes Marinhos do Sudeste do Brasil – Introdução. Cações, Raias e Quimeras. Museu de Zoologia da Universidade de São Paulo.
GERKING SD. 1994. Feeding ecology of fish. California: Academic Press, 416 p.
GRIJALBA-BENDECK M, POLO-SILVA CJ, ACEVEDO K, MORENO F AND MOJICA D. 2012. Aspectos tróficos y reproductivos de algunos batoideos capturados en Santa Marta, Mar Caribe de Colombia. Lat Am J Aquat Res 40(2): 300-315. HACUNDA JS. 1981. Trophic relationships among demersal
fishes in a coastal area of the Gulf of Maine. Fish Bull 79(4): 775-788.
HEITHAUS MR. 2004. Predator–prey interactions. Biology of Sharks and their Relatives (Carrier JC, Musick JA and Heithaus MR (Eds)), p. 487-521. CRC Press, Boca Raton, FL, USA.
HEITHAUS MR, FRID A, WIRSING AJ AND WORM B. 2008. Predicting ecological consequences of marine top predator declines. Trends in Ecol Evol 23: 202-210.
HYSLOP EJ. 1980. Stomach contents analysis - a review of methods and their application. J Fish Biology 17: 411-429. IAPARDES. 2001. Zoneamento da Área de Proteção Ambiental
de Guaraqueçaba. Instituto Paranaense de Desenvolvimento Econômico e Social. Curitiba: IAPARDES, 150 p.
KREBS CJ. 1999. Ecological Methodology. Menlo Park, CA: Addison Wesley.
KYNE PM AND BENNETT MB. 2002. Diet of the eastern shovelnose ray, Aptychotrema rostrata (Shaw e Nodder, 1794), from Moreton Bay, Queensland, Australia. Mar Fresh Res 53: 679-686.
LANA PC, MARONE E, LOPES RM AND MACHADO EC. 2001. The subtropical estuarine complex of Paranaguá bay, Brazil. In: Seeliger U and Kjerfve B (Eds), Coastal marine ecosystems of Latin America ecological studies: Berlin: Springer-Verlag, p. 131-145.
LENANTON RCJ. 1977. Aspects of the ecology of fish and commercial crustaceans of the Blackwood River Estuary, Western Australia. Fish Res Bull Western Aust 19: 1-72. LONERAGAN NR, POTTER IC AND LENANTON RCJ. 1989.
Influence of site, season and year on contributions made by marine, estuarine, diadromous and freshwater species to the fish fauna of a temperate Australian estuary. Mar Biol 103: 461-479.
MAACK R. 1981. Geografia Física do Estado do Paraná. BDT/ UFPR/IBPT, Curitiba, 350 p.
MANTOVANELLI A. 1999. Caracterização da dinâmica hídrica e do material particulado em suspensão na Baía de Paranaguá e em sua bacia de drenagem. Master Thesis of Universidade Federal do Paraná, Curitiba, 152 p. (Unpublished).
MARONE E AND JAMIYANAA D. 1997. Tidal characteristics and a numerical model for the M2 tide at the estuarine complex of the Bay of Paranaguá, Paraná, Brazil. Nerítica: 11: 95-107. MCEACHRAN JD AND CARVALHO MR. 2002. Batoids Fishes.
In: Niem VH (Ed), FAO species identification guide for fishery purposes. The living marine resources of the Western Central Pacific, Volume 1 – Introduction, Molluscs, Crustaceans, Hagfishes, Sharks, Batoid fishes and Chimaeras. Rome: FAO, p. 507-589.
MENESES TS, SANTOS FN AND PEREIRA CW. 2005. Fauna de Elasmobrânquios do litoral do estado de Sergipe, Brasil. Arquivo de Ciências do Mar, Fortaleza 38: 79-83. NAVIA AF, MEJÍA-FALLA PA AND GIRALDO A. 2007. Feeding
ecology of elasmobranch fishes in coastal waters of the Colombian Eastern Tropical Pacific. BMC Ecology 7: 8. NOERNBERG MA, LAUTERT LFC, ARAÚJO AD, MARONE
E, ANGELOTTI R, NETTO JR JPB AND KRUG LA. 2004. Remote Sensing and GIS Integration for Modelling the Paranaguá Estuarine Complex – Brazil. J Coastal Res Brazil Special Issue 39: 1627-1631.
OLIVEIRA EC AND FÁVARO LF. 2011. Reproductive biology of the flatfish Etropus crossotus (Pleuronectiformes: Paralichthyidae) in the Paranaguá Estuarine Complex, Paraná State, subtropical region of Brazil. Neotrop Ichthyol 9(4): 795-805.
PINKAS L, OLIPHANT MS AND IVERSON ILK. 1971. Food habits of albacore, bluefin tuna and bonito in Californian waters. Calif Fish Game 152: 1-105.
POTTER IC AND HYNDES GA. 1994. Composition of the fish fauna of a permanently open estuary on the southern coast of Australia, and comparisons with a nearby seasonally closed estuary. Mar Biol 121: 199-209.
POTTER IC, LONERAGAN NR, LENANTON RCJ, CHRYSTAL PJ AND GRANT CJ. 1983. Abundance, distribution and age structure of fish populations in a Western Australian estuary. J Zool Lond 200: 21-50.
ROCHA F AND GADIG OBF. 2013. Reproductive biology of the guitarfish Rhinobatos percellens (Chondrichthyes, Rhinobatidae) from the São Paulo Coast, Brazil, western South Atlantic Ocean. J Fish Biology 82(1): 306-317. SEMA. 2006. Secretaria de Estado do Meio Ambiente e
Recursos Hídricos. Mar e Costa: subsídios ao ordenamento das áreas estuarina e costeira do Paraná. Projeto Gestão Integrada da Zona Costeira do Paraná com ênfase na Área Marinha. Programa Nacional de Meio Ambiente – PNMA II. Curitiba, Paraná, 125 p.
SOARES CR, ÂNGULO RJ AND LESSA GC. 1997. VI Congresso da Associação Brasileira de estudos do quaternário (ABEQUA) e reunião sobre o quaternário da América do Sul. In: Publicação Especial Número 2 Roteiro da Excursão ao Litoral do Estado do Paraná: morfodinâmica de ambientes atuais, evolução da planície durante o quaternário e problemas de erosão costeira. Curitiba, Brasil, 125 p.
TALENT LG. 1982. Food habits of gray smoothhound, Mustelus californicus, the brownsmoothhound, Mustelus henlei, the shovelnose guitarfish, Rhinobatos productus, and the tat ray Myliobatus californica in Elkhorn Slough. California. Calif Fish Game 68: 224-234.
VAUDO JJ AND HEITHAUS MR. 2011. Dietary niche overlap in a nearshore elasmobranch mesopredator community. Mar Ecol Prog Ser 425: 247-260.
WETHERBEE BM AND CORTÉS E. 2004. Food consumption and feeding habits. In: Carrier JC, Musick JA and Heithaus MR (Eds), Biology of Sharks and their Relatives, Chapter 8, p. 223-244.
WHITE WT, PLATELL ME AND POTTER IC. 2004. Comparisons between the diets of four abundant species of elasmobranchs in a subtropical embayment: implications for resource partitioning. Mar Biol 144: 439-448. WOSNICK N AND FREIRE CAO. 2013. Some euryhalinity may