Analysis of the influence of gully erosion in the flow pattern of
catchment streams, Southeastern Brazil
Fernanda Martineli Costa, Luis de Almeida Prado Bacellar
⁎
Departamento de Geologia/ Escola de Minas da Universidade Federal de Ouro Preto- 35400-000 Ouro Preto, Brazil
Received 11 November 2005; received in revised form 23 May 2006; accepted 30 May 2006
Abstract
The baseflow of tributaries to the Velhas River in the northwest region of Ouro Preto County (São Francisco Basin, Brazil) has been declining in the last years, without a simultaneous decrease in the water input. This can only be attributed to badly planned human activities, which result in soil crusting or compaction, erosion, among other types of impact, such as groundwater overexploitation and wetland drainage. Almost all of the study area has been eroded by hundreds of large-size gullies. In order to analyze the influence of erosion in the hydrological behavior of small streams, two similar and contiguous catchments were selected. The only remarkable difference between them is a gully that occupies circa 42% of one of the catchments (“eroded catchment”). Rainfall, flow rates and chemical data were obtained
throughout a hydrological year and the results showed that the eroded catchment presented smaller baseflow rates and bigger but short-lived stormflows. This contrasting flow regime is attributed to the gully, which is causing the partial withdraw of the regolith and the exposure of weathered rock. As the regolith has smaller hydraulic conductivities and higher storage coefficients, the exposure of weathered rock on the gully floor explains the odd flow behavior of the eroded catchment. Other studies in the same region confirm the impact caused by the gullies. Thus, the superposition of many gullies can cause decrease of the baseflow and increase of the stormflow. As gullies are very common erosion features in Brazil, they should be much more studied in order to better understand this and other similar types of environmental impact.
© 2006 Elsevier B.V. All rights reserved.
Keywords:Gully; Catchment streams; Baseflow; Flow pattern
1. Introduction
The flow pattern of a stream results from certain characteristics of its catchments that are controlled by climate, geology, geomorphology, soil and vegetation. Besides these natural factors, the stream flow pattern can be changed by badly planned human activities, such as groundwater over-exploitation, drainage of wetlands, defor-estation, soil erosion and compaction.
In recent years, several reports have been made on the progressive reduction of the baseflow of some rivers in Brazil, which does not always correspond to a simultaneous
reduction of water input (precipitation–evapotranspiration
balance) in the basin (e.g.Bacellar et al., 2002). In this case, the baseflow reduction can only be attributed to badly planned human activities. Although reduction of the base-flow can cause environmental and socio-economical pro-blems, quantitative data about its relation to human activities are still rare in Brazil.
Gully erosion, which is usually a consequence of human activities (Bacellar, 2000), is considered one of the worst environmental problems in Brazil, since it can modify the catchment dynamics, causing large soil losses, silting of river channels and valley floors, among other types of impact (Luk et al., 1997). Some Brazilian catchments are currently being eroded by a great number of large gullies, some of them up to 400 m long, 150 m wide and 50 m deep (Bacellar, 2000; Bacellar et al., 2005). Such erosional features usually scour
www.elsevier.com/locate/catena
⁎ Corresponding author. Fax: +55 31 3559 1606.
E-mail addresses:femartineli@yahoo.com.br(F. Martineli Costa),
bacellar@degeo.ufop.br(L. de Almeida Prado Bacellar).
the other is affected by a large gully. Both catchments were simultaneously monitored throughout a hydrological year. Rainfall, stream flow and hydrochemical data were system-atically collected. The monitoring method is simple and cheap and can be easily applied in other areas. This study is part of an extensive monitoring program implemented in 2002.
2. The study area
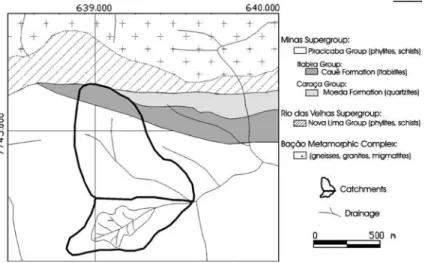
The study area lies between 638,500 and 640,000 longitude and between 7,744,000 and 7,745,500 latitude, in the northwest region of Ouro Preto County, in Minas Gerais state, Southeastern Brazil (Fig. 1). It has been having serious problems of water shortage in the last decades.
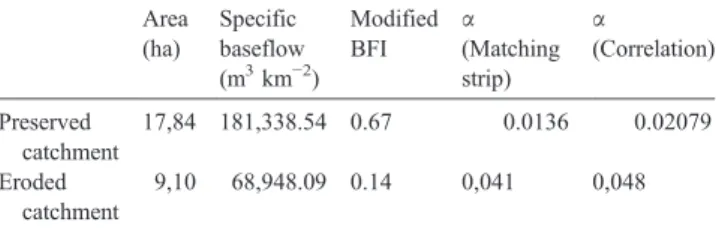
The chosen catchments have similar physical character-istics (geology, geomorphology, soils, vegetation and climate). One catchment, with an area of 17.84 ha, is preserved from channel erosion (“preserved catchment”),
whereas the other (the“eroded catchment”), with an area of
9.10 ha, has been cut by a 250 m-long, 150 m-wide and 25 m-deep gully, thus affecting almost 42% (3.8 ha) of the eroded catchment (Figs. 1 and 2). This gully stopped its incision when the channel reached the weathered bedrock, but it is still retreating towards the interfluve.
The regional climate is CWb, according to the Köppen classification. The annual average rainfall is 2100 mm (Freiberg, 1934, inJohnson, 1962), with a rainy season from October through March and a drier season in the winter. The interpolation of regional data shows that the evapotranspira-tion rate it is about 963 mm a year (Amorim et al., 1999). As these catchments are small and contiguous, their climates can be considered alike.
The study area lies totally within the Minas Supergroup, constituted by the Caraça, the Itabira and the Piracicaba groups (Fig. 3). The Caraça Group is mainly composed of quartzites, whereas the Itabira group is locally composed of iron-rich rocks (itabirites) and ferruginous quartzites. The Piracicaba group is composed of phyllites, sericite–schists
and quartz–schists (Door, 1969). Both catchments lie in the
Piracicaba Group; near the north border of the preserved catchment, the Itabira Group crops out, occupying 13% of the area (Fig. 3).
Clayey inceptisols and ultisols prevail in the catchments (Bacellar, 2000), with A and B horizons respectively of 0.3 and 2.0 m in thickness. Less developed entisols only appear in a small portion in the north of the preserved catchment, corresponding to the Itabira Group. So, despite some local changes, soil distribution can be considered relatively homogeneous in the area. The C horizon (saprolite) is composed of homogeneous silty sands or sandy silts, its thickness reaching 30 m on the hilltop and 5 m on the bottom of the valley. This horizon overlies the heterogeneous weathered rock zone.
The water table, which seasonally fluctuates 1–2 m,
occurs at the base of the saprolite, where intergranular porosity predominates. The top of the weathered rock is characterized by fractured porosity. No hydrogeological data are available for the Minas Group saprolites in the area, but lower values of hydraulic conductivity than those for the weathered rock zone can be expected, as usually happens with metamorphic rocks (Deere and Patton, 1971).
The Piracicaba Group usually has bad aquifer properties (Boechat, 2001), with average storage coefficients (Sy) of 0.05 and hydraulic conductivities of 10−3 cm s−1. The
available hydrogeological data for the Itabira Group come
from iron ore areas, where this unit is considered a good aquifer. This happens because porosity and hydraulic conductivity were increased after strong quartz leaching throughout geological time. As iron ore does not occur in the study area and the Itabira Group is badly fractured, we assume lower values for hydraulic conductivity and storage coefficient. Moreover, the stream channels of the preserved catchment cut the Piracicaba Group only, once the Itabira Group crops out more than 150 m away (Fig. 3). Having these factors in mind, the rock hydrodynamical parameters may be considered alike in both catchments.
The relief is equally homogeneous in the area, with the predominance of highly sloping mountains (15° to 30°) and incised valleys (Bacellar, 2000). The preserved and eroded catchments show an amplitude of about 140 m and 90 m and Gravelius compactness index (Kc) of 1.18 and 1.28, respectively.
The primary vegetation was the semidecidual forest (Bacellar, 2000), which is now restricted to only 10% of the area of the eroded catchment. On the other hand, a riparian forest only occurs in 20% of the preserved catchment. Grasses on mismanaged pastures for cattle grazing cover a great part of the area.
There is no evidence of either intense sheet or splash erosion or of strong soil compaction or crusting in both catchments, despite their current land use as pastures. Therefore, the most remarkable difference between them is the gully in the eroded catchment. So, as both catchments are physically (geology, geomorphology, soil and vegetation) similar, it was previously assumed that any odd behavior of the stream flow pattern of the eroded catchment would be due to the gully.
3. Methods
Firstly, a large area was investigated in order to select two similar catchments, differing only in the degree of channel erosion. Some catchments were selected and field studies
were carried out in order to analyze their accessibility and characteristics. Those in which significant human interfer-ence (small reservoirs, irrigation works, etc.) caused extraneous influence in the flow pattern were immediately eliminated.
A thin-wall steel and portable triangular (V-notch) weir (Rantz, 1982) allowed the determination of the stream flow in the preserved and the eroded catchment outlets from July 2003 through July 2004. The triangular weir type was chosen, since it usually gives good accurate data for low flow streams. The flow rate (Q) was then obtained through the Gourley–Crimp equation (e.g.:Custódio and Llamas, 1976;
Rantz, 1982):
Q¼1:32dtanb 2dh
2:47 ð1Þ
where h represents the measured water level above the
bottom of the notch (m) andβthe notch angle (in degrees).
During the dry season just one flow measure was made a day, but the acquisition frequency was increased to three times a day during the rainiest season, when the flow changes a little more. In this season daily flow was obtained by an average of the three measurements. A continuous record of flow would have been better, but manually operated weirs were chosen, since they are simpler and cheaper and can be easily replicated in other areas, specially in developing countries, where there are not enough resources to monitor small streams. A trained monitor measured the water level. Further, these data were submitted to a consistency analysis in the office, before the calculation of the flow rates. In order to calibrate the weir flow data, direct flow measurements by the volumetric method (Rantz, 1982) were also taken at several stage levels.
Some common hydrological parameters were obtained, such as recession constant (α) and the baseflow volume, in
order to compare the flow pattern of both catchments. The recession coefficient (α) can be associated with
mor-phological characteristics of the catchment and with its
coefficient determined by these methods represents an average of three values obtained by three different operators. If we consider that the aquifer recession is linear, we can use the following analytical solution of Boussinesq introdu-cing some simplifying assumptions (Dewandel et al., 2003):
a¼k
2 dKdH
4dSydL2
ð3Þ
whereKis the hydraulic conductivity (m d−1);H(m) is the
depth of the aquifer in the outlet; Sy is the storage coefficient; andL(m) is the width of the aquifer.
Thus,αis proportional to the hydraulic conductivity and indirectly proportional to the storage coefficient. As the hydraulic conductivity varies more significantly than the storage coefficient in the saprolite/weathered rock interface, that propriety seems to control more effectively the recession constant of catchments. Thus, catchments that have more regolith are expected to have lowerα, because this unit usually
presents lower hydraulic conductivity and higher storage coefficient than weathered rock (Deere and Patton, 1971).
Baseflow separation in hydrograms was done with the smoothed minima technique (Nathan and McMahon, 1990; Wahl and Wahl, 1995), which allowed the quantification of the specific baseflow (baseflow volume/catchment area).
Daily rainfall amount was measured every morning in a rain gauge installed near the catchment outlets. Chemical water analyses were performed monthly or bimonthly in
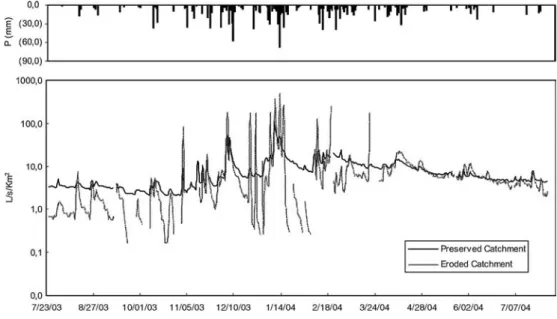
The precipitation rate on these catchments throughout the monitoring period (July/2003 to July/2004) was 1455.9 mm.
4.1. Channel characteristics
There are marked differences in the channel morphology and the characteristics of the two catchments. In the preserved catchment the running water is clear, almost devoid of suspended sediments, even in the more rainy periods. The channel is relatively stable throughout the year, because the banks are mainly composed of clay rich soil (A and B horizons), stabilized by the riparian vegetation. The channel is 0.7 m wide and 0.4 m deep at the catchment outlet. On the other hand, in the eroded catchment, the water carries a great amount of suspended sediments, especially in the rainy months. During these months, the stream capacity greatly increases, since it can transport up to 40 cm-long boulders. The channel at the catchment outlet is quite unstable, since it has frequently shifted its course during the monitoring period, especially soon after strong storms. The channel banks at the outlet are composed of previously eroded sediments that came from the upstream gully. Because most of these sediments came from the silt-to fine sand-grained schist saprolite (Bacellar, 2000), they are devoid of natural cohesion and are therefore unstable. As the riparian vegetation is not well developed in these relatively poorer
soils, the cohesion due to the root system is insignificant. Consequently, fluvial erosion and slumps usually destroy its channel banks, provoking channel shifts and increasing the amount of available sediments to the stream. Because of this, the eroded catchment channel undergoes silting and is wider (up to 1.20 m) than the preserved catchment channel.
4.2. Flow data treatment
In order to verify the flow data, weir measurements were plotted against flow measurements, determined by the volumetric method on some days throughout the year (Fig. 4). A good fit linear correlation was found, which demonstrates that the acquired weir data was very reliable. As the volumetric method presents better accuracy (Rantz, 1982), all the weir flow data were corrected with the calibration equations.
Daily hydrograms were constructed with such calibrated data (Fig. 5). Specific flow (flow rate/catchment area) was used in order to make correlations between these catchments easier. It is important to note that the maximum flow rate measuring capacity of the weirs is 183.0 and 517.0 L s−1
km−2for the preserved and eroded catchment, respectively.
So, during storms water frequently spilled over the weirs, especially in the eroded catchment, hampering flow measurements on some days. Similarly, during the dry season, there might not be any flow in this catchment or it was too low to be measured. Therefore, the missing parts in the hydrograms correspond to the days when no measure-ments could be taken (Fig. 5).
4.3. Flow data analysis
As it can be seen in Figs. 5 and 6, the flow pattern is very different for these contiguous catchments. In the preserved catchment, baseflow is larger and rain provokes smaller stormflows and lower but wider peakflows than in the eroded catchment, where flash floods are common. On the other hand, the average annual flow rates are higher in the eroded catchment.
A computer-based routine in EXCEL software was applied to separate automatically the baseflow component from total flow on the hydrograms through the smooth-average technique (Nathan and McMahon, 1990; Wahl and
Fig. 5. Hydrograms for the study catchments.
maxima in February; for the eroded catchment, it is a little delayed (Fig. 6). Despite these differences, the annual specific baseflow is almost three times greater in the preserved catchment (Fig. 6andTable 1).
It was impossible to calculate the BFI index, which is the ratio of baseflow to total flow (Smakhtin, 2000), because some data are missing. Nevertheless, an approx-imate calculation was made on the BFI index, using only valid values of flow during the monitored period (Table 1).
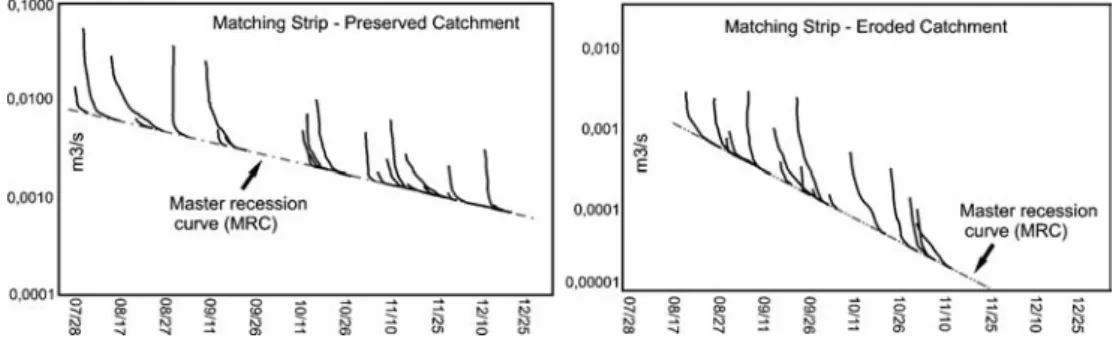
The recession coefficient (α) was determined through a
master recession curve, using the matching strip method (Snyder, 1939; Nathan and McMahon, 1990) and the correlation method (Langbein, 1938; Knisel, 1963; Nathan and McMahon, 1990; Smakhtin, 2001). The recession coefficients obtained with both methods are similar and consistently higher in the eroded catchment (Figs. 7 and 8
and Table 1).
4.4. Hydrochemical data
The stream water chemical parameters (Table 2) and ICP analysis show low concentrations of chemical elements (usually a little above the detection limit of the analytical methods) and similar chemical signatures in both catchments. Water has a relatively homogeneous composi-tion (calcium or sodium bicarbonate, in the Piper diagram), without remarkable variations throughout the year.
kilometers away have shown that the water table can lower several meters when adjacent to a deep gully, creating an expressive depression cone. As the average infiltration rate in the region is slow (Morais and Bacellar, 2005), the aquifer recharge in the gully surroundings can be severely delayed. Because the aquifer is shallow in the preserved catchment, its baseflow rises as soon as the rainy period begins, while in the eroded catchment the baseflow rises begins only in February, when the saturation front reaches the aquifer.
In the same way, the recession coefficient (α) of the
eroded catchment calculated with both methods is higher than in the preserved one. As both catchments are physically similar, the contrasting flow regime was attributed to the gully that affects 42% of the area of the eroded catchment, partially depriving it of the soil mantle and exposing the weathered rock. In fact, this behavior can be explained by the nature of the water bearing unit in the weathering profile. As some auger borings show in the preserved catchment the water table is placed in the saprolite, while in great part of the eroded catchment the water table was lowered until the weathered rock zone because of the gully. The soil mantle, which supposedly has smaller hydraulic conductivity and greater storage coefficient (Deere and Patton, 1971), was partially eroded. According to Eq. (3), the exposition of the more permeable weathered rock on the gully floor could explain its greater recession coefficient and the odd flow behavior
of the eroded catchment. In the same way, the outcrop of the weathered rock on the gully bottom causes an expressive overland flow and lower infiltration rates.
On the other hand, the eroded catchment presents higher values of average annual flow. This can be explained by its lower detention capacity due to the partial loss of the soil mantle and lower evapotranspiration rate, since in the gully area the vegetation is scarce.
Both streams display low values of total dissolved salts (TDS ranging from 5.1 to 12.2 mg l−1) and of electrical
conductivity (EC ranging from 7.7 to 18.7μs), even in the drier period (Table 2), which demonstrates that the flow routes are neither deep nor excessively delayed. These results are expected for first-order streams in mountainous regions. However, TDS and EC values are a little higher in the preserved catchment, demonstrating that its stream flow comes preferentially from longer subsurface paths. The water in this catchment has a little more acidity (average pH = 6.7) and is less oxidized (average Eh = 72.4 mV) than in the eroded one (pH = 6.8 and Eh = 78.4), which supports this interpretation.
The eroded catchment exhibits higher and faster storm-flows, which greatly increase the possibility of floods, sediment transportation and the erosion of channel banks. The existence of flash floods adds to the possibility of channel shifts and the downstream silting of channels and reservoirs. On the other hand, this catchment can show a significant reduction or even the cessation of baseflow in the driest months.
Monitoring data from other two catchments placed some kilometers away show the same hydrological impact of gullies. As this region has more than 300 large-size gullies (Bacellar, 2000; Costa and Sobreira, 2001), the combined effects of these erosional features can explain some of the environmental problems that is being recorded in the region, such as the progressive reduction of low flows in the main rivers, frequent floods and a severe silting of reservoirs.
In the region, environmentalists and government authorities used to blame mining companies, industries and large scale agricultural and forestry projects for these environmental impacts. However, as proven in this work,
Fig. 8. Mater recessions curves obtained with the matching strip method.
Table 2
Physicochemical data obtained in the field and with tritation and turbidimetric analysis
Anion (mg/L) Parameter
Cl− SO
4
−2 HCO3− T(oC) CE (
μS) TDS (mgL−1) pH Eh (mV)
Well preserved catchment
May/03 2.3 1.3 9.39 16.1 12.8 8.53 6.56 153
June/03 1.8 2.3 11.00 14.0 15.8 10.61 6.80 50
July/03 3.3 <1.0 12.36 14.5 15.8 9.69 6.85 73
Aug/03 2.5 <1.0 14.46 16.4 10.5 10.45 6.49 79
Sept–Oct/03 4.0 <1.0 16.16 20.5 17.1 11.10 6.40 52
Nov–03 3.5 <1.0 14.36 20.3 18.7 12.20 6.80 38
Dec/03–Jan/04 3.5 <1.0 13.34 20.1 14.1 9.40 6.70 78
Feb–Mar–Apr/04 1.5 <1.0 14.25 17.1 16.4 10.73 6.70 56
Average 2.8 <1.2 13.2 17.4 15.1 10.3 6.70 72.4
Eroded catchment
May/03 2.5 <1.0 6.1 16.7 8.4 5.62 6.71 189
June/03 1.8 <1.0 8.0 14.9 7.7 5.12 6.97 87
July/03 2.5 <1.0 10.0 18.4 11.6 7.10 6.87 54
Aug/03 2.8 <1.0 11.5 19.1 13.4 8.68 6.80 61
Sept–Oct/03 3.0 <1.0 13.5 27.7 18.4 11.80 6.60 35
Nov–03 3.8 <1.0 10.9 23.1 12.2 7.90 6.80 52
Dec/03–Jan/04 3.5 <1.0 11.0 21.6 12.5 8.30 6.80 82
Feb–Mar–Apr/04 3.0 <1.0 13.6 20.0 14.62 9.50 7.07 68
either rainfall reduction or evapotranspiration increase. Therefore, baseflow reduction can only be explained by badly planned human interference in the catchments, which can cause the decrease of the aquifer recharge. The study area is severely degraded by man, but the worst problem is the great number of large gullies that cut the landscape.
The hydrological monitoring of a preserved and an eroded catchment of the study area during a hydrological year shows for the eroded catchment:
✓ smaller baseflow and higher recession coefficients; ✓ larger stormflow, with higher but short-lived peak
flows;
✓ lower Eh, lower total dissolved salt contents, lower electrical conductivity, and higher pH waters;
✓ higher annual total flow.
This odd behavior of the eroded catchment can be explained by the presence of the gully, which affects 42% of the area by soil mantle removal and weathered rock exposure.
Because weathered rock crops out on the bottom of the gully, most of the rainfall will run as overland flow, with low time lag, causing high and short-lived peak flows. On the other hand, the recharge will be less effective, reducing the amount of baseflow. The soil mantle usually has lower hydraulic conductivity and higher storage coefficients than the weathered rock zone, which explains the higher recession coefficient values in the eroded catchment. Geochemical data confirms that runoff occurs by more superficial routes. The annual runoff is higher in the eroded catchment; this probably happens because the superficial detention and the evapotranspiration are less effective.
Additional studies are being carried out in order to better understand the spatial and temporal variations of the flow routes in the area. However, monitoring data from other two catchments placed some kilometers away show the same hydrological impact of gullies. As this region has more than 300 large-size gullies (Bacellar, 2000; Costa and Sobreira, 2001), the combined effects of these erosional features can explain the baseflow reduction in the study region.
Bacellar, L.A.P., 2000 Condicionantes geológicos, geomorfológicos e geotécnicos dos mecanismos de voçorocamento na bacia do Rio Maracujá. D.Sc. Thesis, Rio de Janeiro Federal University, Rio de Janeiro, Brazil. Bacellar, L.A.P., Leite, M.G.P., Murta, C.R., 2002. Artificial recharge to
increase base flow in a small catchment, eastern Brazil. In: Dillon, P.J. (Ed.), Management of Aquifer Recharge for Sustainability. A.A. Balkema Publishers, Adelaide, pp. 357–360.
Bacellar, L.A.P., Coelho Netto, A.L., Lacerda, W.A., 2005. Controlling factors of gullying in the Maracujá Catchment, southeastern Brazil. Earth Surface Processes and Landforms 30, 1369–1385.
Boechat, E.C.B., 2001. Avaliação das interferências ambientais da mineração nos recursos hídricos na bacia do alto rio das Velhas. Belo Horizonte, Brazil. Technical Report. InGolder Associates Brazil, Belo Horizonte, Brazil.
Castany, G., 1971. Tratado Practico de las Aguas Subterraneas. Ediciones Omega, Barcelona.
Costa, F.M., Sobreira, F.G., 2001. Estudo Preliminar das Voçorocas da Bacia do Rio Carioca, Quadrilátero Ferrífero - MG. In: VII Simpósio Nacional de Controle de Erosão, Goiânia, Anais, vol. 1, pp. 74–80.
Custódio, E., Llamas, M.R., 1976. Hidrología subterrânea. Ed Omega, Barcelona.
Deere, D.U., Patton, F.D., 1971. Slope stability in residual soils. Proc. IV Pan-American Conference on Soil Mechanics and Foundation Engineer-ing: Puerto Rico, vol. 1, pp. 87–168.
Dewandel, B., Lachassagne, P., Bakalowicz, M., Weng, Ph., Al-Malki, A., 2003. Evaluation of aquifer thickness by analyzing recession hydro-graphs. Application to the Oman ophiolite hard-rock aquifer. Journal Hydrology 274, 248–269.
Door, J.N., 1969. Physiographic, stratigraphic, and structural development of the Quadrilátero Ferrífero, Minas Gerais. U.S. Geological Survey Professional Paper 641-A, 110S.
Hem, J.D., 1985. Study and interpretation of the chemical characteristics of natural water. U.S. Geological Survey Water-Supply 2254.
Johnson, R.F., 1962. Geology and ore deposits of the Cachoeira do Campo, Dom Bosco e Ouro Branco Quadrangles, Minas Gerais, Brazil. Geological Survey Professional Paper 41-B, 39.
KniselJ Jr., W.G., 1963. Baseflow recession analysis for comparison of drainage basins and geology. Journal of Geophysical Research 68 (12), 3649–3653.
Langbein, W.B., 1938. Some channel storage studies and their application to the determination of infiltration. Eos Trans. Reports and Papers, Hydrology AGU, vol. 19, pp. 435–447.
Luk, S., di Cenzo, P.D., Liu, Z.X., 1997. Water and sediment yield from a small catchment in the hilly granitic region, South China. Catena 29, 177–189. Morais, F., Bacellar, L.A.P., 2005. Influência do método na predição das
propriedades hídricas do solo. XII Congresso Latinoamericano de Geologia, Publisher, Quito, Ecuador. In CDRom.
Rantz, S.E., 1982. Measurement and computation of streamflow: volume 1. Measurement of stage and discharge. Geological Survey Water-Supply Paper (Washington, D.C.) 2175.
Smakhtin, V.U., 2001. Low flow hydrology: a review. Journal of Hydrology 240, 147–186.
Snyder, F.F., 1939. A concept of runoff-phenomena. Eos, Transactions AGU 20, 725–738.
USAE, 1999. Engineering and Design- Groundwater Hydrology. Depart-ment of the Army, US Army corps of Engineers, Washington. Wahl, K.L., Wahl, T.L., 1995. Determining the flow of Comal Springs at