Vol.54, n. 3: pp. 577-588, May-June 2011
ISSN 1516-8913 Printed in Brazil BRAZILIAN ARCHIVES OF
BIOLOGY AND TECHNOLOGY
A N I N T E R N A T I O N A L J O U R N A L
Modeling of Drying and Adsorption Isotherms of the Fish
Feed
Ana Claudia Werner Pacheco, Gianini Regina Luz, Paulo Eduardo Polon, Luiz Mário de
Matos Jorge and Paulo Roberto Paraíso
*Departamento de Engenharia Química; Universidade Estadual de Maringá; Av. Colombo, 5790; 87020-900; Maringá - PR - Brasil
ABSTRACT
The aim of this work was to study the drying curves and equilibrium isotherms of extruded fish feed. The drying curves were determined at air temperatures of 50, 60, 70 and 80°C and airflow velocities of 1.5, 2.5 and 3.5 m/s). The equilibrium isotherms of relative humidity of air were obtained between 10 and 80% at 30, 40, 50, and 70°C. The experimental data were fitted for non-linear regression by using STATISTICA® to the models reported in the literature. The results showed that the drying curves and the equilibrium isotherms were significantly influenced by variations of the air temperature in a similar way to solid materials as described in the literature. The statistical results for models of Page and Peleg showed that the fitting of the experimental drying curve and isotherm data were satisfactory.
Key words: extruded fish feed, adsorption isotherms, equilibrium moisture
*Author for correspondence: [email protected]
INTRODUCTION
Aquaculture is becoming an important productive component of the food safety in animal protein. It has been well developed in Brazil and in the world in the last decades. Factors such as the decrease of the natural fishing, environmental restrictions, governmental incentives, and medical recommendations for a healthier diet have contributed to an increase in the demand of fish meat. The success of the aquaculture depends on the quality and final product cost to the consumers. According to Magliano (2007), the feed cost may correspond up to 70% of the fish meat production cost of a fish breeding station. With an aim to make aquaculture an economically and environmentally sustainable activity, attempts
water, reducing the nutrient leaching causing environmental impact (FAPEAM, 2009; Botaro, 2007).
After the extrusion, the feed is dried to a moisture level that prevents the proliferation of microorganisms to ensure its quality during handling and transportation. Drying requires large amount of energy and may increase the production costs, especially if the equipment operating conditions are not appropriate. Nevertheless, drying must be optimized for the production of a good quality product at an accessible cost to the consumer. This requires knowledge of the drying kinetics of feed, because it influences the design, operation, and efficient control of the dryer. The drying kinetics describes the moisture variation profile of the material with time. Models that represent the drying curves have been proposed based on the variables that may interfere on product drying. According to Brooker et al.
(1992), empirical and semi-empirical models are the best options to estimate the moisture variation of materials. Some examples of application of these models were identified in the analyses of drying of urucum (Bixa orellana L.) using the Lewis, Page, Thompson, Overhults, Brooker, Henderson and Motta Lima (Guedes and Faria, 2000), of beans (Phaseolus vulgaris L.) using the correlations of Wangh and Singh, Verna, Thompson, Page, Midilli, Logarithmic, Henderson and Pabis, Henderson and modified Pabis, two-term exponential (Corrêa et al., 2007) and of fertilizers using the Lewis, Brooker, Page, Overhults, Henderson and Henderson (Arruda, 2008) models. The utilization of these models requires the knowledge of the drying data and system operation conditions. When these data are not available, dimensionless moisture data of the product are experimentally obtained as a function of time.
The concern with feed quality and cost reduction is fundamental for the production and commercialization of the feed. Therefore, both the feed producer and consumer need to know the adsorption behavior in several ambient conditions to prevent losses during the storage and supply of the feed of acceptable quality to the market. The moisture adsorption by the product on the shelf or after opening its package is related to the
equilibrium moisture defined as the amount of corresponding moisture to the equilibrium between the water vapor pressure in the material and in the ambient. The correlation between the equilibrium moisture and water activity at a given temperature is called equilibrium isotherm (Karathanos et al., 1996). The equilibrium isotherms of certain products may be determined by using experimental data or estimated data by non-linear models found in the literature. As such, the BET, GAB, and Oswin models are the most common ones for accuracy and large application (Fadini et al., 2006). Recently, these and other models have been investigated by Gomes et al. (2002) in a study of adsorptions isotherms of acerola pulp applying BET, GAB, Oswin, and Smith, by Ascheri et al. (2007) in a study of the moisture adsorption of pre-gelatinized jabuticaba bagasse and rice applying Chung-Pfost, Halsey, GAB, BET, Oswin and modified Henderson, and by Alexandre et al. (2007) in the study of the adsorption isotherms of powdered pitanga applying GAB, Oswin, and Peleg correlations. However, the use of these models depends on the knowledge of the water activity or relative humidity of air, the drying temperature, and material-specific parameters. In the absence of these data, the equilibrium moisture data must be obtained in laboratory by gravimetry or hygrometry (Barrozo et al., 2000; Mujumdar, 1987).
Tithed aim of this work was to investigate the drying kinetics and adsorption moisture, and their fittings for mathematical models as tools for the design and simulation of industrial feed dryers.
MATERIALS AND METHODS
The feed samples were provided by a company in northern Paraná with spherical pellets (diameter 6 to 8 mm; initial moisture 0.30 (d.b.) The moisture was determined by drying at 105°C ± 2ºC for 24 h.
Drying kinetics data of feed
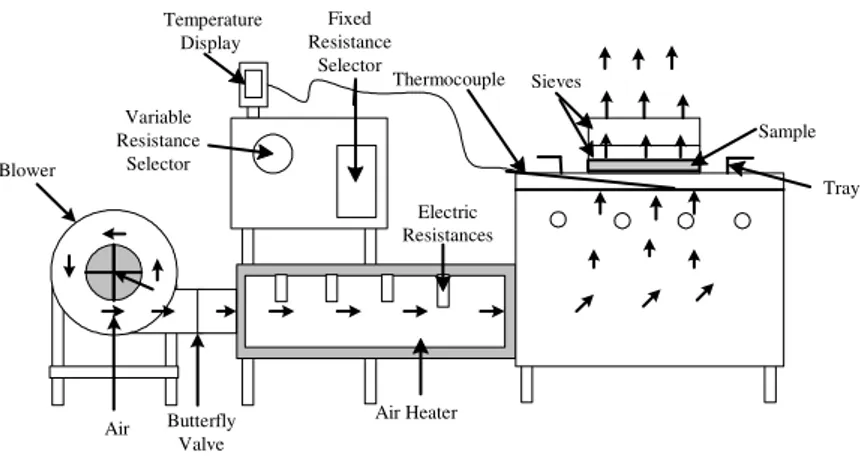
Figure 1 - Convective dryer scheme.
In this dryer, each assay was carried out with approximately 80 g of feed, amount sufficient to cover the drying bed constituted by two sieves with meshes of 200 and 270. Thermocouples were distributed under the dryer tray. The flow and air temperature were monitored by using an anemometer and a psychrometer, respectively. The stabilized drying conditions were registered with the ambient air data. Afterwards, the sieves with sample were set on the dryer tray and the drying was started. The sample-sieves set was weighed in an analytical balance every 30 s during the first 6 min due to the high evaporation in the beginning. Later, data were collected every minute until it completed the first hour of processing. In the next hour, the data were collected every 2 min, due to the low moisture variation in this period. The drying conditions were reregistered with the ambient air data. At the end, the feed dry mass was determined in the oven at 105ºC ±2 ºC for 24h.
Equation 1 was used to determine the solid moisture profile.
ss ss s
m
m
m
X
=
−
(1)Where Xs is the solid moisture (d.b.), m is the
feed mass at each drying time (g) and mss is the
feed sample mass in the oven (g).
The drying rate, N, was determined by Equation 2.
t X
N s
∆ ∆
= (2)
Where N is drying rate (1/s), ∆Xs is the variation
of the solid moisture (d.b.) and ∆t is the time variation.
The previous procedures were repeated at 50, 60, 70, and 80°C under airflow velocities of 1.5, 2.5, and 3.5 m/s.
The dimensionless moisture ratio of the extruded feed, MR, at the different drying conditions was calculated by using Equation 3.
e i
e s
X X
X X MR
− − =
(3)
Where Xs is the solid moisture (d.b.), Xe is the solid equilibrium moisture (d.b.) and Xi is the solid initial moisture (d.b.).
Fitting of the extruded feed drying curves
The extruded feed drying curves were fitted to the mathematical models of Wang and Singh, Thompson and Page as follow.
- Wang and Singh (Wang and Singh, 1978)
2 bt at 1
MR= + + (4)
- Thompson (Thompson et al., 1968)
) b 2 / ) ) bt 4 a ( a exp((
MR
=
−
−
2+
0,5 (5)- Page (Page, 1949)
) kt exp(
MR
=
−
n (6)Where a, b, c, n are model constants, k is the drying constant, t is the drying time (s), and MR is the dimensionless product moisture ratio.
Blower
Tray Temperature
Display
Air Heater Fixed Resistance
Selector
Variable Resistance
Selector
Air
Sample Sieves
Electric Resistances Thermocouple
The regression analysis was performed using computer software, namely, STATISTICA® version 5.0. Regression work was done based on the Quasi-Newton method and convergence criterion of 0.0001.
The parameters used to evaluate the curve fittings were the coefficient of determination (R2), the relative mean deviation, P, and the estimated error, EE. Values of P and EE were calculated by Equations 7 and 8, respectively.
∑
=−
= n
1
i exp
calc exp
MR MR MR
n 100
P (7)
(
)
DOF 2
EE=
∑
MRexp−MRcalc (8)Where MRexp is the experimental feed moisture
ratio, MRcalc is the calculated feed moisture ration
is the number of experimental observations, and DOF is the number of degrees of freedom (number of observations minus the number of observed parameters of the model).
Equilibrium isotherms
The classical gravimetric method was used to obtain the solid adsorption equilibrium isotherms, as follow.
The feed samples were initially dried in an oven for 24 h at 105°C ± 2°C to determine the dry mass and guarantee the moisture adsorption by using salt solutions. The samples were stored in basket-like recipients that were weighed empty and with sample in an analytical balance. The determination of the mass of the empty recipient facilitated the weighting of the samples in the following steps. Afterwards, saturated samples were prepared and warmed, resulting relative humidity of air between 10 and 80%, as reported by Arnosti Jr. (1997) for LiCl, CH3CO2K, MgCl2.6H2O, NaNO2, NaCl, and
KCl. The solutions were prepared in duplicate with the salt and water masses informed by Perry and Chilton (1980). The samples and saline solutions were kept in closed jars to prevent their direct contact as shown in Figure 2.
Sample
Salt Solution Support Basket
Figure 2 - Experimental jar
After storing the samples and solutions, the jars were kept in the oven at 50°C. The samples were weighed in the baskets at regular intervals until that the mass was constant, indicating that hygroscopic equilibrium was reached. The equilibrium moisture (d.b.), Xe, was calculated by
Equation (1).
These procedures were repeated for new feed samples at 30, 40, and 70°C.
Fitting of the equilibrium isotherms
The extruded feed equilibrium isotherms were fitted to the mathematical models of Peleg, Henderson–Thompson and Keey, as follow.
- Peleg model (Peleg, 1993)
d w b w
e aa ca
X = + (9)
- Henderson -Thompson model (Thompson et al., 1968)
b / 1
w e
) c T ( a
) a 1 ln(
X
+ −
−
= (10)
+ =
w 3 e
a 1 ln bT 1
a X
(11)
Where a, b, c, d are model parameters, aw is the
water activity, and T is the feed drying temperature (K).
The regression analysis was performed using computer software STATISTICA® version 5.0. Regression work was done based on the Rosenbrook and Quasi-Newton and convergence criterion of 0.0001.
The parameters used to evaluate the model fitting were the coefficient of determination, R2, the test F, F, and the relative mean deviation, P. As such, the test F was calculated by Equation 12.
(
)
− =
mean 2 calc exp
mean 2 calc
MR MR
) MR (
F (12)
RESULTS AND DISCUSSION
Extruded fish feed drying curves
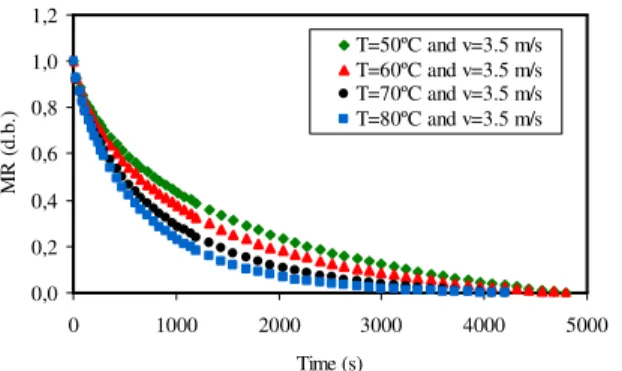
Figures 3 and 4 show the solid drying curves at different air temperatures and constant airflow velocity.
The profiles of the feed drying curves shown in Figures 3, 4, and 5 are characteristic of solid materials. It was also observed that the increase of the air temperature resulted in larger sample drying rates, which were less pronounced in the beginning of drying.
0,0 0,2 0,4 0,6 0,8 1,0 1,2
0 1000 2000 3000 4000 5000
Time (s)
M
R
(
d
.b
.)
T=50ºC and v=1.5 m/s T=60ºC and v=1.5 m/s T=70ºC and v=1.5 m/s T=80ºC and v=1.5 m/s
Figure 3 - Influence of air temperature (v=1.5 m/s) on fish feed drying.
0,0 0,2 0,4 0,6 0,8 1,0 1,2
0 1000 2000 3000 4000 5000
Time (s)
M
R
(
d
.b
.)
T=50ºC and v=2.5 m/s T=60ºC and v=2.5 m/s T=70ºC and v=2.5 m/s T=80ºC and v=2.5 m/s
0,0 0,2 0,4 0,6 0,8 1,0 1,2
0 1000 2000 3000 4000 5000
Time (s)
M
R
(
d
.b
.)
T=50ºC and v=3.5 m/s T=60ºC and v=3.5 m/s T=70ºC and v=3.5 m/s T=80ºC and v=3.5 m/s
Figure 5 - Influence of air temperature (v=3.5 m/s) on fish feed drying.
Figures 6 and 7 show the solid drying curves at different airflows velocities and constant air temperature.
The feed drying curves shown in Figures 6 and 7 were slightly influenced by the airflow velocity and more pronounced at higher temperatures. At 50°C, the curves practically overlapped, while at
80°C, the influence of the temperature was more pronounced.
The feed drying curves shown in Figures 3 to 7 were as reported by Mrkic et al. (2007) for the drying of broccoli and by Luz et al. (2009) for the drying of soybean meal.
0,0 0,2 0,4 0,6 0,8 1,0 1,2
0 1000 2000 3000 4000 5000
Time (s)
M
R
(
d
.b
.)
T=50ºC and v=1.5 m/s T=50ºC and v=2.5 m/s T=50ºC and v=3.5 m/s
Figure 6 - Influence of airflow velocity (T=50ºC) on fish feed drying.
0,0 0,2 0,4 0,6 0,8 1,0 1,2
0 1000 2000 3000 4000 5000
Time (s)
M
R
(
d
.b
.)
T=80ºC and v=1.5 m/s T=80ºC and v=2.5 m/s T=80ºC and v=3.5 m/s
Figure 7 - Influence of airflow velocity (T=80ºC) on fish feed drying.
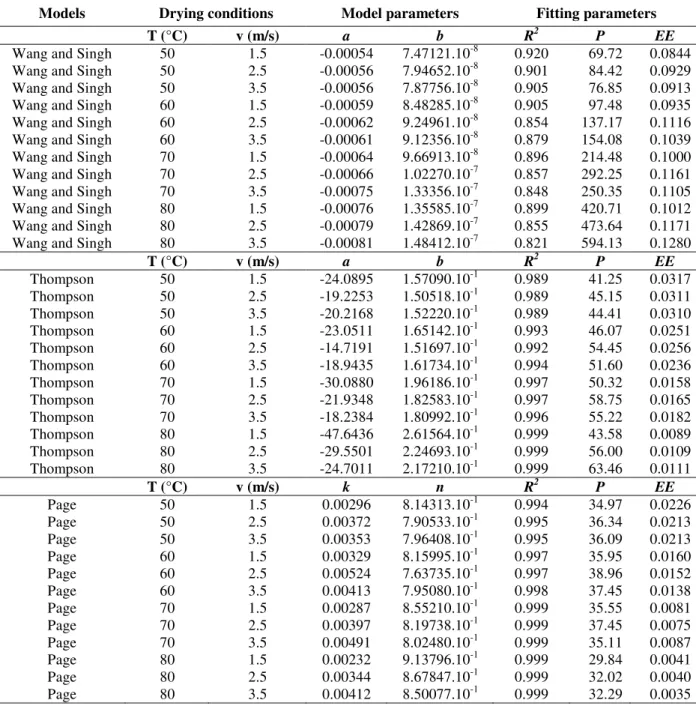
Considering the effect of the air temperature and airflow velocity on feed drying, the model parameters of Equations 4 to 6 were estimated and related by statistical parameters (R2, P, and EE)
that were analyzed for the different drying conditions.
statistical fitting values. However, the Page model stands out for its greatest R2 and lowest P and EE values, demonstrating to be the most suitable one
to estimate the extruded feed drying curve. The fitting results of this model are shown in Figures 8, 9 and 10.
Table 1 - Estimated parameters of the models of the drying curves of extruded fish feed.
Models Drying conditions Model parameters Fitting parameters
T (°C) v (m/s) a b R2 P EE
Wang and Singh 50 1.5 -0.00054 7.47121.10-8 0.920 69.72 0.0844 Wang and Singh 50 2.5 -0.00056 7.94652.10-8 0.901 84.42 0.0929 Wang and Singh 50 3.5 -0.00056 7.87756.10-8 0.905 76.85 0.0913 Wang and Singh 60 1.5 -0.00059 8.48285.10-8 0.905 97.48 0.0935 Wang and Singh 60 2.5 -0.00062 9.24961.10-8 0.854 137.17 0.1116 Wang and Singh 60 3.5 -0.00061 9.12356.10-8 0.879 154.08 0.1039 Wang and Singh 70 1.5 -0.00064 9.66913.10-8 0.896 214.48 0.1000 Wang and Singh 70 2.5 -0.00066 1.02270.10-7 0.857 292.25 0.1161 Wang and Singh 70 3.5 -0.00075 1.33356.10-7 0.848 250.35 0.1105 Wang and Singh 80 1.5 -0.00076 1.35585.10-7 0.899 420.71 0.1012 Wang and Singh 80 2.5 -0.00079 1.42869.10-7 0.855 473.64 0.1171 Wang and Singh 80 3.5 -0.00081 1.48412.10-7 0.821 594.13 0.1280
T (°C) v (m/s) a b R2 P EE
Thompson 50 1.5 -24.0895 1.57090.10-1 0.989 41.25 0.0317
Thompson 50 2.5 -19.2253 1.50518.10-1 0.989 45.15 0.0311
Thompson 50 3.5 -20.2168 1.52220.10-1 0.989 44.41 0.0310
Thompson 60 1.5 -23.0511 1.65142.10-1 0.993 46.07 0.0251
Thompson 60 2.5 -14.7191 1.51697.10-1 0.992 54.45 0.0256
Thompson 60 3.5 -18.9435 1.61734.10-1 0.994 51.60 0.0236
Thompson 70 1.5 -30.0880 1.96186.10-1 0.997 50.32 0.0158
Thompson 70 2.5 -21.9348 1.82583.10-1 0.997 58.75 0.0165
Thompson 70 3.5 -18.2384 1.80992.10-1 0.996 55.22 0.0182
Thompson 80 1.5 -47.6436 2.61564.10-1 0.999 43.58 0.0089
Thompson 80 2.5 -29.5501 2.24693.10-1 0.999 56.00 0.0109
Thompson 80 3.5 -24.7011 2.17210.10-1 0.999 63.46 0.0111
T (°C) v (m/s) k n R2 P EE
Page 50 1.5 0.00296 8.14313.10-1 0.994 34.97 0.0226
Page 50 2.5 0.00372 7.90533.10-1 0.995 36.34 0.0213
Page 50 3.5 0.00353 7.96408.10-1 0.995 36.09 0.0213
Page 60 1.5 0.00329 8.15995.10-1 0.997 35.95 0.0160
Page 60 2.5 0.00524 7.63735.10-1 0.997 38.96 0.0152
Page 60 3.5 0.00413 7.95080.10-1 0.998 37.45 0.0138
Page 70 1.5 0.00287 8.55210.10-1 0.999 35.55 0.0081
Page 70 2.5 0.00397 8.19738.10-1 0.999 37.45 0.0075
Page 70 3.5 0.00491 8.02480.10-1 0.999 35.11 0.0087
Page 80 1.5 0.00232 9.13796.10-1 0.999 29.84 0.0041
Page 80 2.5 0.00344 8.67847.10-1 0.999 32.02 0.0040
Page 80 3.5 0.00412 8.50077.10-1 0.999 32.29 0.0035
The Page model has been largely used to represent the drying curves of food and agricultural product, as shown in Figures 8, 9 and 10. These studies include the drying of urucum by Guedes and Faria
Figure 8 - Experimental and predicted dimensionless moisture of fish feed drying at airflow velocity of 1.5 m/s.
0,0 0,2 0,4 0,6 0,8 1,0 1,2
0 1000 2000 3000 4000 5000
Time (s)
M
R
(
d
.b
.)
T=50ºC and v=2.5 m/s T=60ºC and v=2.5 m/s T=70ºC and v=2.5 m/s T=80ºC and v=2.5 m/s Page (T=50ºC and v=2.5 m/s) Page (T=60ºC and v=2.5 m/s) Page (T=70ºC and v=2.5 m/s) Page (T=80ºC and v=2.5 m/s)
Figure 9 - Experimental and predicted dimensionless moisture of fish feed drying at airflow velocity of 2.5 m/s.
0,0 0,2 0,4 0,6 0,8 1,0 1,2
0 1000 2000 3000 4000 5000
Time (s)
M
R
(
d
.b
.)
T=50ºC and v=3.5 m/s T=60ºC and v=3.5 m/s T=70ºC and v=3.5 m/s T=80ºC and v=3.5 m/s Page (T=50ºC and v=3.5 m/s) Page (T=60ºC and v=3.5 m/s) Page (T=70ºC and v=3.5 m/s) Page (T=80ºC and v=3.5 m/s)
Figure 10 - Experimental and predicted dimensionless moisture of fish feed drying at airflow velocity of 3.5 m/s.
Adsorption equilibrium isotherms of extruded fish feed
The mean experimental results of water activity (aw) and the respective equilibrium moisture
values (Xe) of extruded fish feed at 30, 40, 50, and
70ºC are shown in Table 2 and in Figure 11.
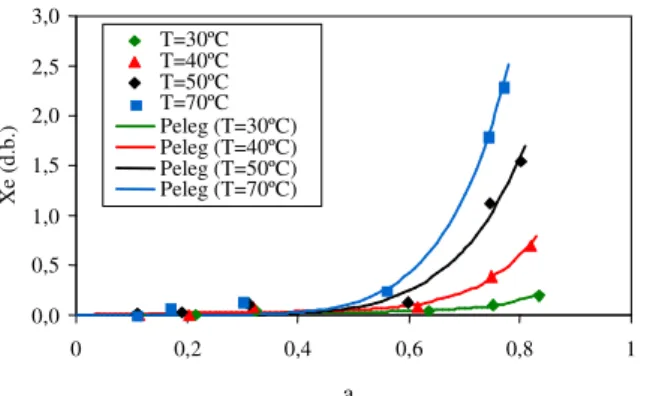
Table 2 and Figure 11 showed that the equilibrium moisture of the extruded fish feed had higher increase for water activity values between 0.597 and 0.834. The air temperature influenced the equilibrium moisture of the feed, leading to an increase in the moisture adsorption. As such, the
0,0 0,2 0,4 0,6 0,8 1,0 1,2
0 1000 2000 3000 4000 5000
T ime (s)
M
R
(
d
.b
.)
maximum value obtained was 0.20 (d.b.) at 30°C, 0.695 (d.b.) at 40°C, 1.542 (d.b.) at 50°C, and at 2.3 (d.b.) at 70°C. The great variation of the feed moisture showed that handling care was necessary, mainly in ambient with relative humidity of air higher than 0.6.
Figure 11 showed that the adsorption equilibrium isotherms of the feed had sigmoid form. This behavior is characteristic of food products, such as macaroni, flour, bread, cracker, egg albumin (Geankoplis, 1993), and chitin (Moraes et al., 2005).
Table 2 - Experimental equilibrium moisture (Xe) for the different water activity values (aw) of feed at 30, 40,50
and 70°C.
Saline solutions aw 30ºC Xe 30ºC aw 40ºC Xe 40ºC aw 50ºC Xe 50ºC aw 70ºC Xe 70ºC
LiCl 0.113 0.000 0.112 0.000 0.111 0.009 0.109 0.000
CH3CO2K 0.216 0.000 0.204 0.004 0.192 0.026 0.168 0.080
MgCl2.6H2O 0.324 0.036 0.318 0.077 0.312 0.116 0.300 0.140
NaNO2 0.635 0.039 0.616 0.079 0.597 0.122 0.559 0.250
NaCl 0.750 0.101 0.748 0.393 0.746 1.114 0.742 1.800
KCl 0.834 0.201 0.818 0.695 0.802 1.542 0.770 2.300
0,0 0,5 1,0 1,5 2,0 2,5
0 0,2 0,4 0,6 0,8 1
aw
X
e
(d
.b
.)
T=30ºC T=40ºC T=50ºC T=70ºC
Figure 11 - Experimental adsorption isotherms of extruded fish feed at different temperatures.
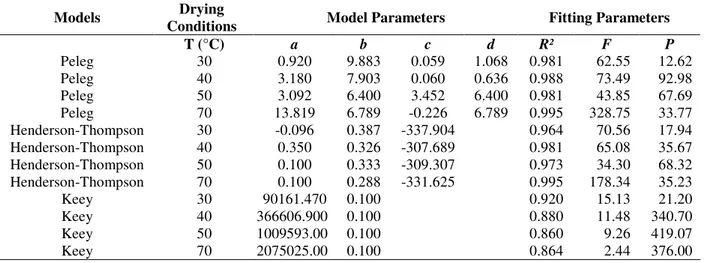
Table 3 showed the estimated parameters for the models of Equations 9 to 11 and their respective statistical parameters (R2, P, and EE) that were analyzed for the different drying conditions. As observed in Table 3, the Peleg and Henderson-Thompson models showed satisfactory results
according to statistical fitting parameters. However, the Peleg model stands out for its greatest R2and F and lowest P values, being the most appropriate one to estimate the equilibrium moisture of extruded fish feed. The fitting results of this model are presented in Figure 12.
Table 3 - Estimated parameters of the models of the equilibrium isotherms of extruded fish feed.
Models Drying
Conditions Model Parameters Fitting Parameters
T (°C) a b c d R² F P
Peleg 30 0.920 9.883 0.059 1.068 0.981 62.55 12.62
Peleg 40 3.180 7.903 0.060 0.636 0.988 73.49 92.98
Peleg 50 3.092 6.400 3.452 6.400 0.981 43.85 67.69
Peleg 70 13.819 6.789 -0.226 6.789 0.995 328.75 33.77
Henderson-Thompson 30 -0.096 0.387 -337.904 0.964 70.56 17.94 Henderson-Thompson 40 0.350 0.326 -307.689 0.981 65.08 35.67 Henderson-Thompson 50 0.100 0.333 -309.307 0.973 34.30 68.32 Henderson-Thompson 70 0.100 0.288 -331.625 0.995 178.34 35.23
Keey 30 90161.470 0.100 0.920 15.13 21.20
Keey 40 366606.900 0.100 0.880 11.48 340.70
Keey 50 1009593.00 0.100 0.860 9.26 419.07
0,0 0,5 1,0 1,5 2,0 2,5 3,0
0 0,2 0,4 0,6 0,8 1
aw
X
e
(
d
.b
.)
T=30ºC T=40ºC T=50ºC T=70ºC Peleg (T=30ºC) Peleg (T=40ºC) Peleg (T=50ºC) Peleg (T=70ºC)
Figure 12 - Experimental and predicted adsorption isotherms of fish feed drying at different temperatures.
As shown in Figure 12, fitting equilibrium isotherms to the Peleg model also presented satisfactory results for Bartlett pear (Park et al., 2001), texturized soybean protein (Cassini, 2004) and dehydrated leaves of coriander (Lima et al., 2007).
CONCLUSIONS
The drying air temperature significantly affects the drying curves of extruded fish feed, while the effect of airflow velocity was limited.
The statistical analyses showed that the variation of the moisture content of extruded fish feed could be represented by the Page model which has been very efficient in the study of drying phenomena of several food products in the literature.
The equilibrium isotherms of extruded fish feed had sigmoid form, as has been frequently reported for food products in the literature.
The feed equilibrium isotherms were little influenced by air temperature variations for water activity values between 0 and 0.6, but for water activity over 0.6 the equilibrium isotherms could reach 2.3 (d.b.) in the evaluated conditions.The fitting of the equilibrium isotherms of the feed to the Peleg model presented the best statistical results and proved to be the most suitable one to predict the equilibrium moisture of extruded fish feed.
ACKNOWLEDGMENTS
The authors thank the financial support by CAPES.
REFERENCES
Alexandre, H. F., Figueirêdo, R. M. F., Queiroz, A. J. M. (2007), Isotermas de adsorção de umidade da pitanga em pó. Rev. Biol. Ciênc. Terra, 7 (1),11-20. Al-Ruqaie, I. M. (2007), Extruded leftover food as
animal feed: I. Effect of extruded feed on growth and feed utilization of tilapia (Oreochromis niloticus) in Saudi Arabia. Pakistan J. Biol. Sci., 10 (19), 3248 – 3253.
Arnosti Jr, S. (1997), Desenvolvimento de um secador transportador do tipo esteira com escoamento cruzado e caracterização de sementes de gramíneas, MSc Thesis, PPGEQ/ Faculdade de Engenharia Química da UFSCAR, São Carlos – SP, 232p.
Ascheri, D. P. R., Guissoni, R. P., Moura, W. S. (2007), Isotermas e calor isostérico de adsorção de água de farinhas pré-gelatinizadas de bagaço de jabuticaba/arroz. Relatório Final de Projeto de Pesquisa, UEG, Anápolis, GO. Available in: http://www.prp.ueg.br/06v1/ctd/dstq/2007/ds_030520 07_02.pdf. Accessed on: 21/09/09.
Barrozo, M.A.S., Oliveira, D.T., Sancineti, G.P., Rodrigues, M.V. (2000), A study of the desorption isotherms of lentils. Braz. J. Chem. Eng., 17, 105-109.
Botaro, D. (2007), Aqüicultura: grande aliada? Faces e
Interfaces. Available in:
http://www.olharvital.ufrj.br/2006/index.php?id_edic ao=067&codigo=4. Accessed on: 10/06/09.
Brooker, D.B., Bakker-Arkema, F.W., Hall., C.W. (1992), Drying and Storage of grains and oilseeds. Westport: The AVI Publishing Company, 450p. Cassini, A. S. (2004), Análise das características de
secagem da proteína de soja. Dissertação de Mestrado, UFRS, Porto Alegre, RS, Brasil, 117 p.
Available in:
http://www.lume.ufrgs.br/handle/10183/4737. Accessed on: 18/09/09.
Corrêa, P. C., Machado, P. F., Andrade, E. T. (2001), Cinética de secagem e qualidade de grãos de milho-pipoca. Ciên. Agrotéc., 25 (1), 134-142.
Corrêa, P. C., Resende, O., Martinazzo, A. P., Goneli, A.L.D., Botelho, F. M. (2007), Modelagem matmática para a descrição do processo de secagem do feijão (Phaseolus vulgaris L.) em camadas delgadas. Eng. Agríc. Jaboticabal, 27 (2), 501-510. El-Sayed, A. F. M. (1999), Alternative dietary protein
sources for farmed tilapia, Oreochromis niloticus. Aquac. Res., 179, 149 -168.
FAPEAM, (2009), Fábrica de ração estimula a produção de peixes em cativeiro. Available in: http://midiaemeioambiente.blogspot.com/2008/02/fbr ica-de-rao-estimula-produo-de-peixes.html. Accessed on: 29/06/2009.
Fadini, A. L., Silva, P. M. P., Jardim, D. C. P., Vissoto, F. Z., Queiroz, M. B. Batista, G. (2006), Isotermas de sorção de umidade e estudo de estabilidade de macadâmias drageadas.Braz. J. Food Technol., 9 (2), 83 – 88.
Faria, A.C. E. A., Hayashi, C., Galdioli, E. M., Soares, C. M., (2001a), Farinha de peixe em rações para alevinos de tilápia do Nilo, Oreochromis niloticus
(L.), linhagem tailandesa. Acta Scient., 23 (4), 903 – 908.
Faria, A.C. E. A., Hayashi, C., Soares, C. M. (2001b), Substituição parcial e total da farinha de peixe pelo farelo de soja em dietas para alevinos de piavuçu (Leporinus macrocephalus). Acta Scient., 4, 835-840. Geankoplis, C. J. (1993), Transport processes and unit
operations. Prentice-Hall International Editions, New Jersey, 921p.
Gomes, P. M. A., Figueiredo, R. M. F., Queiroz, A. J. M. (2002), Caracterização e Isotermas de adsorção de umidade da polpa d acerola em pó.Rev. Bras. Prod. Agroind., 4 (2), 157-165.
Guedes, A. M. M., Faria, L. J. G. (2000), Determinação da constante de secagem de urucum (Bixa orellana L.) em secador convectivo de leito fixo. Rev. Bras. Prod. Agroind., 2 (1), 73-86.
Karathanos, V. T., Kanellopoulos, N. K., Belessiotis, V. G. (1996), Development of Porous Structure during Airdrying of Agricultural Plant Products, J. Food Eng., 29, 167-183.
Keey, R. B. (1991), Drying of loose and particulate materials. Hemisphere Publishing.
Kubitza, F. (1995), Preparo de rações e estratégias de alimentação no cultivo intensivo de peixes carnívoros. Trabalho apresentado no Simpósio Internacional sobre Nutrição de Peixes e Crustáceos. Campos do Jordão, Campos de Jordão, Sâo Paulo, p.91-109.
Kubitza, F. (1997), Principais alimentos e suas restrições para peixes. In: Nutrição e alimentação dos peixes. Piracicaba, Ed. da Escola Superior de Agricultura Luiz de Queiroz. 74p.
Lima, E. E., Silva, A. S., Melo, K. S., Alves, N.M.C., Dantas, H.J. (2007), Utilização de modelos matemáticos para estimar as isotermas de adsorção de folhas desidratadas do coentro. Trabalho apresentado na II Jornada Nacional da Agroindústria, Bananeiras, Pernambuco.
Luz, G. R., Sousa, L. H. C. D., Jorge, L. M. M., Paraíso, P. R. (2006), Estudo das isotermas de equilíbrio do farelo de soja. SBCTA, 26 (2), 408 – 413.
Luz, G. R., Pereira, N. C., Jorge, L. M. M., Andrade, C.M.G., Paraíso, P.R. (2009), Mass transfer coefficient in soybean meal drying. Braz. J. Food Technol., 12 (2), p. 92-96.
Magliano, R., (2007), Aqüicultura: grande aliada? Faces e Interfaces. Available in: http://www.olharvital.ufrj.br/2006/index.php?id_edic ao=067&codigo=4. Accessed on: 10/06/09.
Moraes, M. A., Rosa, G. S., Pinto, L. A. A. (2005), Estudo das isotermas de equilíbrio para quitina: determinação do calor de dessorção. Trabalho apresentado nos Anais do VI Congresso Brasileiro de Engenharia Química em Iniciação Científica, Campinas, São Paulo(publicado em CD-ROM). Mrkic, V., Ukrainczyk, M., Tripalo, B. (2007),
Applicability of moisture transfer Bi–Di correlation for convective drying of broccoli. J. Food Eng., 79, 640-646.
Mujumdar, A. S. (1987), Handbook of industrial drying. Marcel Dekker, Inc., New York.
Park, K. J., Bin, A., Brod, F.P.R. (2001), Obtenção das isotermas de sorção e modelagem matemática para a pêra Bartlett (Pyrus sp.) com e sem desidratação osmótica. SBCTA, 21 (1), 73-77.
Peleg, M. (1993), Assessment of a semi-empirical four parameter general model for sigmoid moisture sorption isotherms. J. Food Proc. Eng.,16 (1), 21-37. Perry, R.H., Chilton, C.H., (1980), Manual de Engenharia Química. Guanabara Dois S.A., Rio de Janeiro, 1250p.
Santosi, I. J., Couto, S. M., Andrade, E.T. (2001), Cinética de Secagem em Camada Fina do Malte Verde de Cevada. Rev. Bras. Prod. Agroind., 3 (1), p.53-59.
Souza, R. S., Hayashi, C. (2003), Avaliação do farelo de algodão na alimentação de alevinos de tilápia do Nilo (Oreochromis niloticus L.). Zoot. Trop., 21 (4), 383 – 398.
Sussel, F. R. Alimentação na criação de peixes em tanques-rede. (2008), Available in: ftp://ftp.sp.gov.br/ftppesca/alimentacao_peixes.pdf. Acessed on: 10/03/08.
Teixeira, E. N. M., Silva, J. H. V., Costa, F. G. P., Ribeiro, M. L. G., Araujo, D. M., Jordão Filho, J. (2007), Inclusão do ovo desidratado em rações peletizadas ou fareladas para frangos de corte. Rev. Bras. Zoot., 36 (5), 1372 – 1381.
Thompson, T. L; Peart, R. M.; Foster, G. H. (1968), Mathematical simulation of corn drying – A new model. Transaction of the ASAE, St. Joseph, 11 (4), 582-586,.
Wang, C. Y., Singh, R. P. (1978), Use of variable equilibrium moisture content in modeling rice drying.
ASAE Paper, p. 78-6505, ASAE, St. Joseph-MI.