A
rti
g
o
*e-mail: [email protected]
MOISTURE SORPTION ISOTHERMS AND ISOSTERIC HEAT DETERMINATION IN CHILEAN PAPAYA (Vasconcellea pubescens)
Antonio Vega-Gálvez *, Marlene Palacios y Roberto Lemus-Mondaca
Departamento de Ingeniería en Alimentos, Universidad de La Serena, Av. Raúl Bitrán s/n, box 599, La Serena, Chile Catarina Passaro
Corporación Colombiana de Investigaciones Agrarias, km 7 Vía Las Palmas, Rionegro, Antioquía, Colombia
Recebido em 17/8/07; aceito em 14/3/08; publicado na web em 26/8/08
The moisture sorption isotherms of Chilean papaya were determined at 5, 20, and 45 ºC, over a relative humidity range of 10-95%. The GAB, BET, Oswin, Halsey, Henderson, Smith, Caurie and Iglesias-Chirife models were applied to the sorption experimental data. The goodness of fit of the mathematical models was statistically evaluated by means of the determination coefficient, mean relative percentage deviation, sum square error, root-mean-square error, and chi-square values. The GAB, Oswin and Halsey models were found to be the most suitable for the description of the sorption data. The sorption heats calculated using the Clausius-Clapeyron equation were 57.35 and 59.98 kJ·mol-1, for adsorption and desorption isotherms, respectively.
Keywords: Chilean papaya; sorption isotherms; isosteric heat.
INTRODUCTION
The Chilean papaya, Vasconcellea pubescens, which grows in a tem-perate climate regime, is a distant relative of the tropical papaya Carica papaya L.1,2 Most of the Chilean papayas come from the (irrigated) region around La Serena, Chile (ca.30 ºS) which has a Mediterranean-type cli-mate, typically overcast mornings and evenings, and an annual relative humidity normally over 80%.3 The Chilean papaya is very different from the tropical papaya in that it is much smaller, and is consumed whole, only after cooking, with the seeds removed. It has an edible yield of 46%, a sugar content of about 5% and is high in papain content.4 Exogenous sugar is usually added to its commercialized products, since this papaya is commercialized mainly in canned and dried (candied) forms.
Water activity within a food is the amount of water available for chemical and biochemical reactions (i.e. lipid oxidation, enzymatic, and Maillard reactions), its participation in microbial development, and as a parameter useful in predicting the shelf life of the product.5 In addition, water activity (aw) measured within a product provides a good indicator of its shelf-life. The isotherm of a product, for a constant temperature, relates the equilibrium moisture content to the thermodynamic water activity, since in equilibrium, the latter is equal to the relative humidity of the air around the product.6 The isotherms are important for the analysis and design of various food transformation processes such as drying, mixing, and storage; and to predict changes in food stability and aid in the selection of suitable packaging materials.7
Various empirical and semi-empirical equations have been propo-sed to predict the behaviour of sorption isotherms of foods and foods-tuffs. The equation proposed by Guggenheim, Anderson and de Boer usually called GAB, is very useful for foods and has been recommended by the European project COST 90.8 The GAB equation is based on the Brunauer, Emmett and Teller usually called BET adsorption theory,9 which gives a physical explanation for the parameters of the equation.10 The monolayer moisture content (Xm) for the GAB and BET models is related to food stability and indicates that the primary adsorption locations (ionic and polar groups) in the macromolecular surface (poly-saccharides and proteins) are saturated by a monomolecular hydrating
layer.4 The criteria for selecting the best model equation for describing experimental sorption data include a) simplicity and b) fit quality of the model to describe the experimental sorption data.11
Knowing the moisture sorption at different temperatures makes it possible to calculate the net isosteric sorption heat (qst), which represents the difference between total sorption heat (Qst) and the vaporization heat of pure water ( Hvap), and indicates the binding energy or intermolecular force between water vapour molecules in the product’s surface.12 This parameter is very useful for the processes of water adsorption and desorption that take place in food. For example, in dehydration processes it represents the energy needed to break the bonds between water vapour molecules and sorption surface.6
The aim of this research was to determine and model the sorption isotherms of Chilean papaya at three temperatures, using eight em-pirical equations; in addition to determine the net isosteric sorption heat using the Clausius-Clapeyron equation.
EXPERIMENTAL Sample preparation
The papayas used were cultivated near city of La Serena (Elqui Valley’s) and purchased in a local market. The same batch of fruit was used for measuring both types of isotherms. The fruit selected for uniform size, firmness, colour, and ripeness index, and stored at 5.0±0.5 ºC until processing. The papayas were washed and peeled using a 10% NaOH solution and 1% Fastpeel® additive, then cut into slabs 10.0±0.2 mm in thickness using a Robot Coupe® cutting machine Fresh papaya was used for determining desorption isotherms, and adsorption isotherms were determined on samples which had been dried to constant weight at 60.0±1.0 ºC in a convective air dryer designed by the Food Engineering Department of Universidad de La Serena using an air velocity of 2.0±0.2 m s-1 for a period of 6 h.
Sorption isotherms
a sealed flask which included a glass dish containing a saturated salt solution of known water activity. The salts used to obtain a range of aw of 0.10 to 0.95 included LiCl, KC2H3O2, MgCl2, K2CO3, Mg(NO3)2, NaBr, KI2, NaCl, KCl, KNO2.13 Starting from the initiation, the sample mass was measured every 20 days until reaching a constant weight (±0.0001 g). This standard gravimetric method was recommended byThe European Cooperative Project COST 90, which deals with physical properties in foods.8 Thymol was added separately in a Petri dish to the recipients containing saturated salt solutions with a relative humidity higher than 75% in order to avoid microbial growth, espe-cially mould. Once equilibrium was reached, the moisture content of the samples was determined using.14 The temperatures chosen were the same for adsorption and desorption isotherms at 5, 25 and 45 ºC. Where at 5 and 25 ºC usually represent the temperatures employed in the storage as well as at 45 ºC is used for drying.
Modelling of sorption isotherm
The relation between the equilibrium moisture content (Xwe g water g-1 d.m.) and the water activity of the papaya fruit was pre-dicted using eight equations representing models commonly used in food and foodstuff. The equations used in this study to model the sorption isotherms of Chilean papaya are presented.4,7,11,15 The GAB model has parameters which prove to be useful in physiochemical descriptions, such as Xm,C and k, which were obtained by nonlinear regression analysis using the EXCEL® program for Microsoft® Win-dows® XP. All parameters of the other equations were obtained by linear regression analysis.
GAB (1)
BET (2)
Henderson (3)
Caurie (4)
Smith (5)
Oswin (6)
Halsey (7)
Iglesias-Chirife (8)
The fit quality of the data to the models was evaluated by sta-tistical analyses, using the determination coefficient, mean relative percentage deviation (%E), sum square error (SSE), root mean square error (RMSE), and Chi-square ( 2). The lowest, or near zero values of
SEE,RMSE and 2, together with the highest r2values (near unity),
and a %E less than 15% identify the best models.4, 5,7,13,16The effect of temperature on the physicochemical parameters Xm,C,k and Xs of the GAB, BET and Caurie models was evaluated by an Arrhenius-type equation. This method allows determination of the activation energy (Ea kJ mol-1).4,17
Net isosteric sorption heat
The net isosteric sorption heat (qst mol-1 K-1) is defined as the difference between total isosteric sorption heat (Qst) and pure water vaporization heat ( Hvap) as a function of the temperature (Equation 9), and was determined in this research using the Clausius-Clayperon equation (Equation 10).18 Where R is the universal gas constant (8,314 J mol-1 K-1).
(9)
(10)
By plotting the sorption isotherm as ln aw versus T-1 for certain values of material moisture content, the slope (-qst·R-1) is obtained, thus determining qst. The Tsami equation (Equation 11) was used to model qstvs. equilibrium moisture content. This equation is an empirical-exponential model which considers the constants, qo and Xo18. Where q
o is the isosteric sorption heat (kJ mol
-1) of the first water molecule in food and is defined when Xwe 0Æqst qo, and Xo is the moisture content characteristic of each product when qstbecomes reduced by 63%.10
(11)
RESULTS AND DISCUSSION Equilibrium moisture content
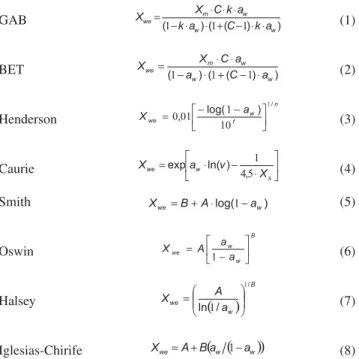
Experimental values of equilibrium moisture content of Chile-an papaya for each water activity at 5, 20 Chile-and 45 ºC are shown in Figures 1a and 1b, which represent adsorption and desorption data, respectively. These figures presented the general trend of sorption iso-therms as a function of temperature. Over the range of water activity studied, at lower temperature there was an increase in the equilibrium moisture content, as reported by Kaymak-Ertekin and Gedik.13 The sorption isotherms of Chilean papaya were typical type II sigmoidal curves according to Van der Waals classification.9 Various authors have reported this behaviour for different foods.5,13,19 The equilibrium moisture content increased at the same aw as temperature decreased, since samples absorbed more water at low temperatures than at high temperatures, and water molecules at lower temperatures have a lower kinetic energy which is not enough to overcome the corresponding sorption energy.20
desorption isotherms increased as temperatures increased, showing that isotherms have a bigger lobule among them at the three working temperatures (Figure 1).
Mathematical modelling of sorption isotherms
The parameter values at 5, 20 and 45 ºC for all models used and for both isotherm types are shown in Table 1. Here the importance of the GAB, BET and Caurie models is notable based on the physicoche-mical explanations of their parameters, particularly for the monolayer moisture content.4 Monolayer moisture (X
m) calculated with the GAB
model was similar to that calculated with the BET model. The mono-layer moisture content obtained by GAB for adsorption isotherms was between 0,062-0,138 g water g-1 d.m., and for desorption isotherms was between 0.113-0.209 g water g-1 d.m.
Similar values of Xm for GAB were reported by other authors, such as Hossain et al.5 Pineapples 0.041-0.050 (g water g-1 d.m.); Kiranoudiset al.10 in potatoes, carrots, onions, tomatoes, green pepper obtained values between 0.087 and 0.212 g water g-1 d.m.; Kaymak-Ertekin and Gedik13 in grapes, apricots, apples, potatoes showed values from 0,067 to 0.220 g water g-1 d.m.; Talla et al.21 for banana, mango, pineapple found values between 0,080 and 0.185 g water g-1 d.m.
In this study, safe storage moisture content values (Xs) predic-ted by the Caurie model were between 0.05-0.09 g water g-1 d.m. for the adsorption isotherm and 0.10-0.12 g water g-1 d.m. for the desorption isotherm. Xs values between 0.065-0.071 g water/g d.b. for desorption and 0.091-0.097 g water g-1 d.m. for the adsorption in red bell pepper.4 The temperature had an influence on X
m in the
GAB and BET models, and on Xs, since moisture content decreased as temperature increased for both parameters, probably due to the lesser availability of active sites in the product tissue or hydrogen bonds (for water).21 Application of the Arrhenius equation gave an Ea of 14.48; 10.63 and 9.22 kJ mol-1 for the parameters X
m (GAB),
Xm (BET), and Xs (Caurie), respectively, for the adsorption isotherm, and 11.08; 10.91 and 4.61 kJ mol-1 for the desorption isotherm. The C parameter of the GAB model was temperature dependent for the adsorption isotherm (r2=0.99) but not for desorption isotherm
Figure 1. Experimental a) adsorption and b) desorption isotherms of papaya at three working temperatures. 5 ºC; c 20 ºC; 45 ºC
Table 1. Summary of the parameters obtained from each model at the three temperatures studied (ºC)
Model Parameters Adsorption Desorption
5 20 45 5 20 45
GAB
Xm 0.138 0.088 0.062 0.209 0.149 0.113
Co 99.047 45.440 13.305 287.642 46.434 79.804
Ko 0.904 1.003 1.039 0.839 0.901 0.956
BET Xm 0.125 0.088 0.069 0.196 0.138 0.107
Co 77.784 101.597 7.411 362.504 76.460 57.169
Henderson A 1.138 0.868 0.774 1.601 1.292 1.297
B -2.113 -1.613 -1.370 -3.050 -2.381 -2.227
Caurie Xs 0.090 0.066 0.054 0.124 0.106 0.096
v 9.665 26.314 51.147 5.397 5.874 4.939
Smith A -0.610 -0.519 -0.416 -0.649 -0.561 -0.405
B 0.075 0.048 0.009 0.176 0.117 0.096
Oswin A 0.260 0.177 0.115 0.388 0.304 0.240
B 0.420 0.699 0.838 0.379 0.422 0.433
Halsey A 0.044 0.077 0.074 0.081 0.076 0.065
B 1.972 1.331 1.051 2.138 1.759 1.587
Iglesias-Chirife
A 0.099 0.098 0.089 0.106 0.076 0.085
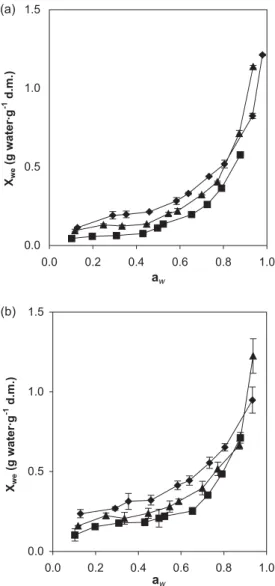
Figure 2. Experimental and predicted adsorption isotherms of Chilean papaya by the a) GAB and b) Oswin models at different temperatures. 5 ºC; c 20 ºC; 45 ºC; calculated
Figure 3.Experimental and predicted desorption isotherms of Chilean papaya by the a) GAB and b) Halsey models at different temperatures. 5 ºC; c 20 ºC; 45 ºC; calculated
(r2=0.36). As expected, the kparameter of the GAB equation was
near unity for all cases studied. The C parameter of the BET model was not affected by temperature for both isotherms. A few studies in the literature reported an effect of temperature on this parameter working with other food products.11,13,19
Statistical tests
Table 1S (supplementary material) shows the statistical tests applied to the models studied for each temperature. In general, good fits of the data were obtained with all the equations applied, with correlation coefficients higher than 0.92 and %E lower than 12%, in addition, SSE, RMSE, 2 values near to zero for all temperatures
and for both isotherm types. Based on the average values of the statistical parameters, the GAB, Oswin and Halsey models provi-ded the best fits for the experimental moisture data as a function of water activity for all the temperatures studied.4,6 The GAB and BET equations, largely used with foods, had a %E lower or equal to 10% for all temperatures and correctly fit the experimental data for both sorption isotherms, although the BET model only applied to aw<0.45.11 Based on this statistical analysis, the Smith and Henderson equations demonstrated good fits for adsorption isotherms at 5 ºC, followed by the Oswin and Caurie models; in contrast, the Smith and Iglesias-Chirife models, followed by the Halsey and Henderson
models, provided the best fits for the desorption isotherms at 5 ºC. At 20 ºC, the best fit for adsorption isotherms was achieved using the Oswin and Iglesias-Chirife equations, followed by the Caurie and GAB models; the GAB, Henderson, Halsey and Smith equations gave the best results for desorption isotherms at this temperature. At 45 ºC, the Oswin, Henderson, GAB and Caurie models were the most suitable for predicting the experimental data.
Although the various models showed good degrees of fit for the data, the Oswin, Halsey, Henderson and GAB equations showed the best fit for the entire range of aw (0.10-0.95) based on the statistical tests.6,11,13,16 The experimental and calculated adsorption isotherms using the GAB and Oswin models are shown in Figure 2a and b, respectively. In addition, Figure 3a and b shows the modelling applied to desorption isotherms using GAB and Halsey models, respectively.
Sorption isosteric heat
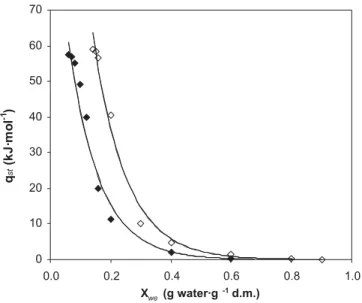
dehydra-Figure 4.Net isosteric heat of experimental sorption and predicted values by the Tsami model. adsorption; desorption; calculated (r2 0.96)
dependent on temperature. The GAB, Oswin, Halsey and Henderson models provided the best fits for the experimental sorption data. In addition, the GAB, Oswin, Halsey and Smith models provided the best fit for the experimental adsorption and desorption data based on the statistical results. It is thus concluded that these models are most suitable for describing the sorption isotherms of Chilean papaya in the temperature range of 5 to 45 ºC and aw range of 10-95%. The net sorption heat decreased with an increase in equilibrium moisture content. Also the net sorption heat was estimated correctly by applying the Tsami equation.
SUPPLEMENTARY MATERIAL
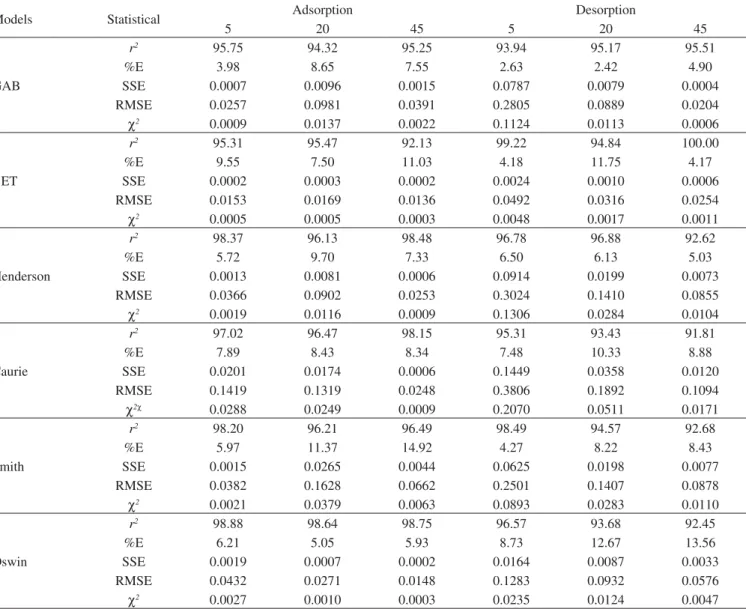
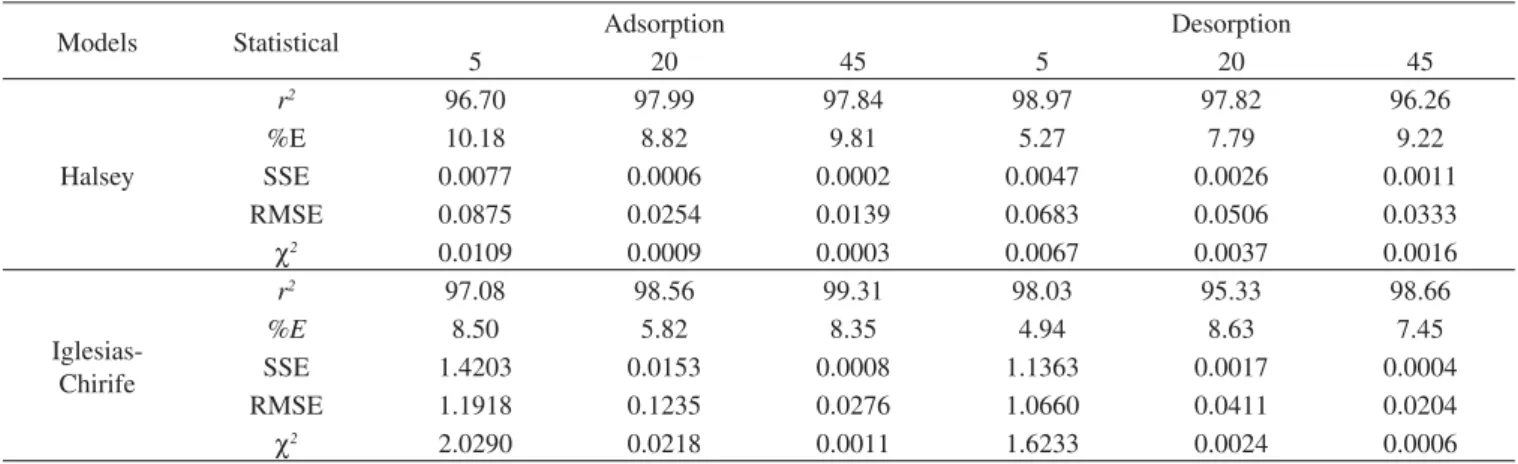
Table 1S shows the statistical parameters (r2,SSE, RMSE, 2 ) calculated for each model at the three temperatures studied (5, 20 and 45 ºC) for adsorption and desorption isotherms.
ACKNOWLEDGEMENTS
The authors gratefully acknowledge financial support provided by the Research Office of Universidad de La Serena (DIULS) for pu-blication of this research.
REFERENCES
1. Badillo, V. M.; Ernstia2000,10, 74.
2. Van Droogenbroeck, B.; Breyne, P.; Goetghebeur, P.; Romeijn-Peeters, E.; Kyndl, T.; Gheysen, G.; Theor Appl Gen.2002,105, 289. 3. Meteochile. Available http://www.meteochile.cl/ , accessed January
2007.
4. Vega, A.; Lemus, R.; Fito, P.; Andrés, A.; J Food Sci Technol Int.2007, 13, 309.
5. Hossain, M. D.; Bala, B. K.; Hossain, M. A.; Mondol, M. R. A.; J Food Eng.2001,48, 103.
6. Vega, A.; Lara, E.; Lemus, R.; Ciênc Tecnol Alim.2006,26, 821. 7. Zhang, X.; Xie, L.; De-Xiang, G.; Wei, Z.; Ren-Li, W.; Pen, L.; J. Sci.
Food Agric.1996,70, 303.
8. Spiess, W.; Wolf, W. In The results of the COST 90 project on water activity; Jowitt, R., ed.; Applied Science Publisher: London, 1983, p. 65.
9. Brunauer, S.; Emmett, P.; Teller, E.; J. Am. Chem. Soc.1938,60, 309. 10. Kiranoudis, C. T.; Maroulis, Z. B.; Tsami, E.; Marinos-Kouris, D.; J
Food Eng.1993,20, 55.
11. Timmermann, E. O.; Chirife, J.; Iglesias, H. A.; J. Food Eng.2001,48, 19.
12. Wang, N.; Brennan, J. G.; J. Food Eng.1991,14, 269. 13. Kaymak-Ertekin, F.; Gedik, A.; J. Food Eng.2004,37, 429.
14. A. O. A. C. Association of official analytical chemists; Nº 934.06, Arlington, 1990.
15. Iglesias, H. A.; Chirife, J.; J. Food Technol.1978,3, 159.
16. Pahlevanzadeh, H.; Yazdani, M.; J. Food Process Eng.2005,28, 331. 17. Turhan, M.; Turhan, N.; Sahbaz, F.; J. Food Process Pres.1997,21,
209.
18. Tsami, E.; Maroulis, Z. B.; Marinos-Kouris, D.; Saravacos, G. D.; J. Food Sci.1990,55, 1594.
19. Erbas, M.; Ertugay, M. F.; Certel, M.; J. Food Eng.2005,69, 191. 20. Lagoudaki, M.; Demertzis, P. G.; Kontominas, M. G.; LWT – Food Sci.
Technol.1993,26, 512.
21. Talla, A.; Jannot, Y.; Nkeng, G. E.; Puiggali, J. R.; Drying Technol.2005, 23, 1477.
22. Iglesias, H. A.; Chirife, J.; LWT – Food Sci. Technol.1976,9, 116. ted papaya moisture content increased from 0.06 to 0.60 g water g-1
d.m. the adsorption heat decreased from 57.35 to 0.34 kJ mol-1; the desorption heat of the fresh product decreased from 58.98 to 0.02 kJ·mol-1 when its moisture content increased from 0.14 to 0.90 g water g-1 d.m. (Figure 4). Similar values of q
st were proposed for
tropical fruits of 30-5 kJ mol-1; 21 and for grapes, apricots, apples and potatoes13 from 55 to 25 kJ mol-1. The q
st values were higher than the
vaporization heat of pure water Hvap) for the entire moisture range, suggesting that the binding energy between water vapour molecules and the adsorption sites was higher than the energy of pure water molecules near the liquid phase.22 This behaviour appears to indicate an interaction between water and the food matrix components, since with the decrease of fresh product moisture; the spaces and active sites for water exit are reduced, implying a higher energy requirement for moving these water molecules.12 For some products, q
stcan be
negative, probably due to high sugar content, since with an increase in temperature the equilibrium moisture increases due to solubility in food sugar and not to sorption behaviour.13
Figure 4 shows the modelling of isosteric heat (adsorption and desorption) by Tsami equation. When applying this equation to model qst(adsorption); 109.89 kJ mol-1 and 0.1092 g water g-1 d.m. values were obtained for qo and Xo, respectively; and for qst(desorption); 229.51 kJ mol-1 and 0.1023 g water g-1 d.m. values were obtained for qo and Xo, respectively. Values of qo between 40-115 kJ mol-1 and X
o
values between 0.08-0.21 g water g-1 d.m. for other vegetables and fruit.10 For tropical pineapple reported q
o values of 29.76 kJ mol
-1
andXo values of 0.86 g water g-1 d.m.5; and in red bell pepper (var. Lamuyo) observed qo values of 38.31 kJ mol-1 and X
o values of 0.19
g water g-1 d.m. for adsorption, and q
o of 75.51 kJ mol
-1 and X
ovalues
of 0.12 g water g-1 d.m. for desorption.4
CONCLUSION
M
a
te
ri
a
l
S
u
p
le
m
e
nta
r
*e-mail: [email protected]
MOISTURE SORPTION ISOTHERMS AND ISOSTERIC HEAT DETERMINATION IN CHILEAN PAPAYA
(Vasconcellea pubescens)
Antonio Vega-Gálvez *, Marlene Palacios y Roberto Lemus-Mondaca
Departamento de Ingeniería en Alimentos, Universidad de La Serena, Av. Raúl Bitrán s/n, box 599, La Serena, Chile Catarina Passaro
Corporación Colombiana de Investigaciones Agrarias, km 7 Vía Las Palmas, Rionegro, Antioquía, Colombia
Table 1S. Statistical parameters calculated for each model at the three temperatures studied (ºC)
Models Statistical Adsorption Desorption
5 20 45 5 20 45
GAB
r2 95.75 94.32 95.25 93.94 95.17 95.51
%E 3.98 8.65 7.55 2.63 2.42 4.90
SSE 0.0007 0.0096 0.0015 0.0787 0.0079 0.0004
RMSE 0.0257 0.0981 0.0391 0.2805 0.0889 0.0204
C2 0.0009 0.0137 0.0022 0.1124 0.0113 0.0006
BET
r2 95.31 95.47 92.13 99.22 94.84 100.00
%E 9.55 7.50 11.03 4.18 11.75 4.17
SSE 0.0002 0.0003 0.0002 0.0024 0.0010 0.0006
RMSE 0.0153 0.0169 0.0136 0.0492 0.0316 0.0254
C2 0.0005 0.0005 0.0003 0.0048 0.0017 0.0011
Henderson
r2 98.37 96.13 98.48 96.78 96.88 92.62
%E 5.72 9.70 7.33 6.50 6.13 5.03
SSE 0.0013 0.0081 0.0006 0.0914 0.0199 0.0073
RMSE 0.0366 0.0902 0.0253 0.3024 0.1410 0.0855
C2 0.0019 0.0116 0.0009 0.1306 0.0284 0.0104
Caurie
r2 97.02 96.47 98.15 95.31 93.43 91.81
%E 7.89 8.43 8.34 7.48 10.33 8.88
SSE 0.0201 0.0174 0.0006 0.1449 0.0358 0.0120
RMSE 0.1419 0.1319 0.0248 0.3806 0.1892 0.1094
C2C 0.0288 0.0249 0.0009 0.2070 0.0511 0.0171
Smith
r2 98.20 96.21 96.49 98.49 94.57 92.68
%E 5.97 11.37 14.92 4.27 8.22 8.43
SSE 0.0015 0.0265 0.0044 0.0625 0.0198 0.0077
RMSE 0.0382 0.1628 0.0662 0.2501 0.1407 0.0878
C2 0.0021 0.0379 0.0063 0.0893 0.0283 0.0110
Oswin
r2 98.88 98.64 98.75 96.57 93.68 92.45
%E 6.21 5.05 5.93 8.73 12.67 13.56
SSE 0.0019 0.0007 0.0002 0.0164 0.0087 0.0033
RMSE 0.0432 0.0271 0.0148 0.1283 0.0932 0.0576
Table 1S. continuation
Models Statistical Adsorption Desorption
5 20 45 5 20 45
Halsey
r2 96.70 97.99 97.84 98.97 97.82 96.26
%E 10.18 8.82 9.81 5.27 7.79 9.22
SSE 0.0077 0.0006 0.0002 0.0047 0.0026 0.0011
RMSE 0.0875 0.0254 0.0139 0.0683 0.0506 0.0333
C2 0.0109 0.0009 0.0003 0.0067 0.0037 0.0016
Iglesias-Chirife
r2 97.08 98.56 99.31 98.03 95.33 98.66
%E 8.50 5.82 8.35 4.94 8.63 7.45
SSE 1.4203 0.0153 0.0008 1.1363 0.0017 0.0004
RMSE 1.1918 0.1235 0.0276 1.0660 0.0411 0.0204