Arthropods and other Biota associated with the Azorean
Trees and Shrubs: Juniperus brevifolia
R
UIN
UNES,
R.
G
ABRIEL,
R.B.
E
LIAS,
F.
R
IGAL,
A.O.
S
OARES,
P.
C
ARDOSO&
P.A.V.
B
ORGESNunes, R., R. Gabriel, R.B. Elias, F. Rigal, A.O. Soares, P. Cardoso & P.A.V. Borges 2015. Arthropods and other Biota associated with the Azorean Trees and Shrubs: Juniperus brevifolia. Arquipelago. Life and Marine Sciences 32: 19-48. Appendix I-IV.
This work aims to characterize the arthropods and other biota (lichens, bryophytes, vascular plants and birds) associated with the Azorean endemic tree, Juniperus brevifolia. This is the first of a series of publications that will (i) provide a comprehensive list of all the biota associated with the main Azorean endemic trees and shrubs, (ii) describe in detail the diver-sity, abundance and spatial patterns of canopy arthropods, and (iii) whenever possible, to extend biodiversity assessments to communities of bryophytes, lichens, vascular plants and vertebrates. We use standardized sampled data from BALA project for canopy arthropods and for the remaining taxa we surveyed literature data and the Herbarium of University of Azores. Juniperus brevifolia occurs in a wide range of elevation belts in Azores and accommodates a remarkable large number of taxa: besides canopy arthropods (161 species) it is also an important substrate to other vascular species (six species), bryophytes (105 spe-cies), lichens (106 species) and also birds (four species). In addition, the species richness and particularly the abundance of endemics are dominant, and the number of conservation concern species for bryophytes is noteworthy (30 out of 70). The complexity of the tree and the high diversity of micro-habitats created the conditions for epiphytic species to easily colonize all parts of the tree, from the bottom, trunk and branches. The communities associ-ated with the Azorean cedar are consequently of a high conservation value and should be further investigated in their ecological dynamics.
Key words: Arthropods, Azorean cedar, bryophytes, host plant, species composition R. Nunes, R. Gabriel, R.B. Elias, F. Rigal1, P. Cardoso2 & P.A.V Borges (e-mail: pborges@uac.pt), CE3C – Centre for Ecology, Evolution and Environmental Changes / Azorean Biodiversity Group and Universidade dos Açores – Department of Agrarian Sci-ences, Rua Capitão João d’Ávila, 9700-042 Angra do Heroísmo, Azores, Portugal; 1 Envi-ronment and Microbiology Team, MELODY group, Université de Pau et des Pays de l’Adour, IPREM UMR CNRS 5254, BP 1155, 64013 Pau Cedex, France; 2
Finnish Museum of Natural History, University of Helsinki, P.O.Box 17 (Pohjoinen Rautatiekatu 13), 00014 Helsinki, Finland; A.O. Soares3 CE3C – Centre for Ecology, Evolution and Environmental Changes / Azorean Biodiversity Group and University of the Azores – Department of Biol-ogy, Rua Madre de Deus, 9501-801 Ponta Delgada, Azores, Portugal.
INTRODUCTION
Azores are known by their low number of indige-nous species (endemic and native non-endemic) of most taxonomic groups, in comparison with the other Macaronesian archipelagos. Moreover, the Azores are probably the archipelago of
Maca-ronesia where the damages caused by historical anthropogenic ecosystem changes are the most apparent (Borges & Hortal 2009; Cardoso et al. 2010; Triantis et al. 2010a,b; Connor et al. 2012, 2013; Rando et al. 2013). Such changes are thought to have caused already the extinction of numerous endemic species, particularly in the
Nunes et al.
20
most disturbed islands, where few and minute native forest patches remain (Cardoso et al., 2010; Rando et al. 2013; Terzopoulou et al. 2015). As a consequence, the knowledge of the current distribution and abundance of terrestrial Azorean biotas is a critical step to set conserva-tion programs on the native forest ecosystem (see e.g. Gaspar et al. 2011). Due to the work of sev-eral research groups from the University of the Azores in the last twenty years, many archipelag-ic studies on both indigenous and exotarchipelag-ic species have been carried out, such as exhaustive species inventories (Borges et al. 2005b; Borges et al. 2010a), comprehensive biogeographical studies (Whittaker et al. 2008, 2014; Borges & Hortal 2009; Cardoso et al. 2010; Santos et al. 2010; Triantis et al. 2010a,b; Cameron et al. 2013; Ar-anda et al. 2014; Carvalho & Cardoso 2014; Car-valho et al. 2015) and phylogenetic and evolu-tionary studies (Ferreira et al. 2011; Schaefer et al. 2011; Amorim et al. 2012; Rodrigues et al. 2013). In addition, there are several ecological studies at smaller spatial scales focusing on the communities of particular organisms, namely bryophytes (e.g. Gabriel & Bates 2005; Aranda et al. 2015), vascular plants (e.g. Elias & Dias 2009; Rumeu et al. 2011; Marcelino et al. 2013) and arthropods (e.g. Borges et al. 2006; Meijer et al. 2011; Florencio et al. 2013; Raposeiro et al. 2013).
However, there are very few studies so far dealing in detail with the biotic communities as-sociated with each of the indigenous host tree species that structure the extant Azorean forests. Among them we emphasise the works on arthro-pod canopy community biodiversity and structure (Markin et al. 1995; Ribeiro et al. 2005; Gaspar et al. 2008; Borges et al. 2008; Ribeiro & Borges 2010) and those dealing with the effects of her-bivory on a specific indigenous host tree species (Vieira et al. 1993; Silva et al. 1995; Ribeiro et al. 2003). Despite these works, there is still insuffi-cient knowledge regarding the biodiversity as-sessment and the spatial structure of the biotas associated with Azorean host trees, which hinders biodiversity conservation and sustainable re-source management (Summervile et al. 2003; Cardoso et al. 2011).
We propose to do a series of publications review-ing the existreview-ing knowledge on the biotic commu-nities associated with structurally important na-tive trees and shrubs of the Azores archipelago, namely Juniperus brevifolia (Seub.) Antoine, Ilex perado Aiton subsp. azorica (Loes.) Tutin; Laurus azorica (Seub.) Franco, Erica azorica Hochst. ex Seub., Vaccinium cylindraceum Sm. and Myrsine africana L.. Our main objectives are: i) to provide a comprehensive list of all the biota associated with the main Azorean endemic trees and shrubs, ii) to describe in detail the diversity, abundance and spatial patterns of canopy arthro-pods, since there is already a bulk of standardized data collected with the BALA project – field-work: 1992-2002 and 2003-2004 (e.g. Ribeiro et al. 2005; Gaspar et al. 2008), and iii) whenever possible, to extend our biodiversity assessment to communities of bryophytes, lichens, vascular plants and vertebrates. Given the current rates of biodiversity loss due to global changes (e.g. inva-sive species, habitat erosion and fragmentation, climatic changes), with all their impacts on the ecosystems and associated communities (Butchart et al. 2010, Hooper et al. 2012) we feel that this will be a valuable asset for future researchers and conservation practitioners, offering a baseline that may be used to compare and evaluate future changes in the native Azorean ecosystems and associated species composition.
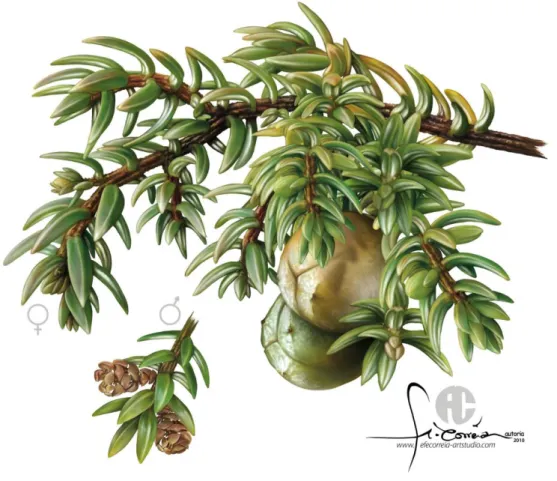
We will start this series of works with the Azorean endemic gymnosperm, Juniperus brevi-folia (Seub.) Antoine, since this is the most com-mon and widespread endemic tree in the extant Azorean native forests (Fig. 1).
THE TARGET SPECIES:JUNIPERUS BREVIFOLIA
(SEUB.)ANTOINE
Juniperus brevifolia, the Azorean cedar or Short leafed juniper, is a dioecious shrub or tree, with a trunk bark brown-purple, exfoliating in strips. Leaves are acicular, closely set, with two broad, white stomatiferous bands on the adaxial surface. Seed cones are subglobose, green and pruinose while young, dark copper-brown when mature. Seeds are free, ovoid and triquetrous (Adams 2014). Sequences from nuclear and chloroplast DNA (trnC-trnD spacer) have placed J. brevifolia in a clade with Juniperus navicularis Gandoger, that is endemic to western coastal areas of
main-land Portugal and it seems possible that seeds of J. navicularis-like plants or their ancestor were brought to the Azores by birds from the Iberian Peninsula (Adams 2014). A study by Rumeu et al. (2011) suggested that a single introduction event
likely occurred from Europe and that genetic dif-ferentiation of J. brevifolia post-dated the emer-gence of the oldest island (Santa Maria, 8.12 Ma, [França et al. 2003]).
Figure 1. Juniperus brevifolia (Seub.) Antoine with details of a female branch, with seed cones, and a male branch with male cones. Ilustrações cientificas: Fernando Correia (www.efecorreia-artstudio.com). With permission of Azorina – S.A.
Presently, two subspecies are recognized (Elias & Dias 2014): (1) J. brevifolia subsp. maritima is an erect shrub or small tree, with (inverted) pyrami-dal crown; leaves: 5.6–7.6 × 1.4–1.8 mm; seed cones: 7.9–9.5 mm, ripening in the first year; seeds: 1–3 per seed cone, 4.9–6.3 × 3.5–5.1 mm, germinating from February to May; pollination: January–March; distribution: Flores, Terceira, Pico, São Jorge and São Miguel (?), below 100 m
a.s.l.; and (2) J. brevifolia subsp. brevifolia is a tree or shrub; leaves: 4.5–6.7 × 1.1–1.5 mm; seed cones: 6.9–8.7 mm, ripening in the second year; seeds: 2-3 per seed cone, 3.9–5.3 × 2.1–3.7 mm, germinating from March to June; pollination: March–June; distribution: all islands, except Gra-ciosa, usually between 300 m and 1500 m a.s.l. Two varieties have been recognized from the later subspecies (Elias & Dias 2014 ): i) J. brevifolia
Nunes et al.
22
subsp. brevifolia var. brevifolia (the dominant taxa) a small to medium-sized tree, found mostly between 300 and 1000 m a.s.l., in all Islands (ex-cept Graciosa); and ii) J. brevifolia subsp. brevi-folia var. montanum a small prostrate shrub, usu-ally found between 850 and 1500 m a.s.l. in the Islands of Flores, Terceira, Pico, São Jorge, Faial and São Miguel. Overall, this species has wide ecological amplitude and it can be found from the coast to 1500 m a.s.l. (in Pico Mountain). There-fore it has the potential to occupy all islands, at all altitude ranges except Pico (which has a max-imum altitude of 2350 m a.s.l.).
Presently, according to Elias (2007), J. brevifo-lia reaches higher values of abundance and fre-quency between 500 and 800 m a.s.l.. Between 800 and 1000 m a.s.l. frequency decreases, and between 1000 and 1500 m a.s.l. abundance also decreases. Low winter temperatures, very high rainfall, strong and frequent winds explain the decreasing abundance. Above 1500 m it is rarely found, possibly due to the frequent snow cover during the winter in Pico Mountain. At lower altitudes, namely between 100 and 500 m (espe-cially up to 300 m) it becomes rarer, not only due to human induced habitat changes but also, in the remaining natural or semi-natural areas due to the competition with tree species with higher stature (e.g. Morella faya, Laurus azorica and Picconia azorica). Furthermore, since J. brevifolia is a pioneer species (Elias & Dias 2009), low fre-quency and intensity of gap creating natural dis-turbances, at these low altitude ranges, might also explain this pattern. Below 100 m a.s.l. there is a small increase in abundance and frequency due to the presence of subsp. maritima in coastal scrubs. Once present in all islands, this species is now extinct in Graciosa and near extinction in Santa Maria. In the islands of São Miguel, São Jorge and Faial, J. brevifolia populations have been greatly reduced or highly fragmented. This de-cline was due to centuries of human exploitation of natural resources. It is well-known that the species was used since human settlement for na-val and house construction, for furniture and as fuel (Frutuoso 1978, 1981, 1987). In addition, extensive dairy farming in the last decades led to widespread clearing of forests for pasture, further decreasing populations of J. brevifolia (Silveira
2013). Nevertheless, it is still possible to find pristine Juniperus forests in Flores, Pico and Ter-ceira (Elias et al. 2011). This species is also found in coastal scrubs, in pioneer and secondary scrubs and in forested peat bogs (Elias & Silva 2008). It is protected both by national and international laws and a few studies have been developed to characterize the genetic variability of the species for conservation and restoration purposes (e.g. Silva 2000; Silva et al. 2011).
METHODS
THE AZOREAN ARCHIPELAGO
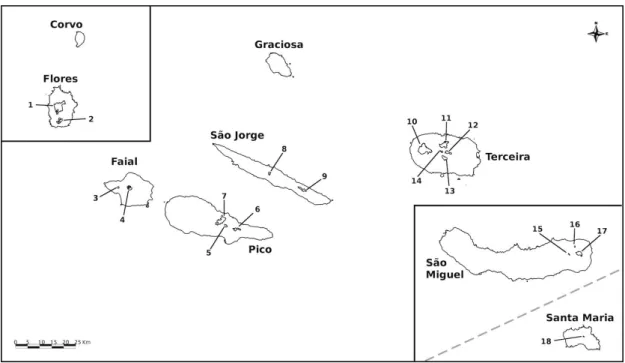
The Azores are a volcanic archipelago with nine islands (Figure 2), located on the North Atlantic, on a WNW-ESE axis, between 37º - 40ºN and 25º - 31ºW. The archipelago extends for 615 km and is located approximately 1300 km west of main-land Portugal, 1600 km east of North America and 800 km NE from Madeira Island. The islands form three distinct groups: the eastern (Santa Ma-ria and São Miguel), the central (Terceira, Gra-ciosa, São Jorge, Pico and Faial) and the western (Flores and Corvo) groups with different geologi-cal ages, with Santa Maria as the oldest island (8.12 Ma) and Pico as the youngest (0.27 Ma) (França et al. 2003).
The archipelago’s climate is affected by the surrounding ocean, namely the effects of the Gulf Stream, as well as by island topography, being mild and very wet, often reaching an average an-nual relative humidity of 95% in the high altitude forests. Annual temperature fluctuations are dampened by the ocean, causing low thermal var-iation throughout the year (Azevedo et al. 2004). AZOREAN VEGETATION
Most Azorean extant native forests are montane cloud forests (Elias et al. 2011). They are humid, evergreen forests characterised by short tree stat-ure, dense crown foliage and high tree density. In more exposed and wet environments J. brevifolia is the dominant tree. Otherwise the canopy is usually dominated by J. brevifolia and I. perado subsp. azorica. At lower altitudes, especially in less exposed areas, L. azorica is also a common species (Elias 2007; Elias et al. 2011). Montane
Figure 2. Map of the Azores (distances between the island groups and between São Miguel and Santa Maria are not in scale). Sampled reserves: 1 – Morro Alto e Pico da Sé; 2 – Caldeira Funda e Rasa; 3 – Cabeço do Fogo; 4 – Caldeira; 5 – Lagoa do Caiado, 6 – Caveiro, 7 – Mistério da Prainha; 8 – Pico Pinheiro; 9 – Topo; 10 – Serra de Santa Bárbara; 11 – Biscoito da Ferraria; 12 – Terra Brava; 13 – Caldeira de Guilherme Moniz; 14 – Pico Galhar-do; 15 - Graminhais; 16 – Atalhada; 17 – Pico da Vara.
cloud forests are also characterised by a dense cover of mosses and other epiphytes (Gabriel & Bates 2005). In the Azores these forests are shaped by the shallow soil layer, fractured and craggy terrain (Ribeiro et al. 2005) and wind speed.
From the work of Frutuoso (1978, 1981, 1987), compiled from documents, oral tradition and from its own travels to the islands, it is clear that for-ests dominated the Azorean landscape at the time of discovery and settlement of the archipelago in the 15th Century. Based on the classical proposal of Dansereau (1970) the vegetation of the Azores could be divided in six altitudinal belts, character-ized by their dominant species: Morella faya (0-300 m); Laurus azorica ((0-300-650 m); Juniperus brevifolia (450-1100 m); Erica azorica (850-1600 m); Calluna vulgaris (1600-2200 m) and (6) li-chens (2200-2350 m). Palynological studies by Connor et al. (2012, 2013) provided us with some very important information about the recent past and historical native vegetation of two Azorean islands, Pico and Flores. These studies added
more evidence that primitive Azorean vegetation was dominated by trees and that human impact had a strong influence on the native vegetation. In fact, as a result of less than 600 years of human settlement more than 95% of the native forest was destroyed by human action (Triantis et al. 2010b; Fernández-Palacios et al. 2011; Silveira, 2013), with most coastal, lowland and submontane for-ests (dominated by Morella faya, Picconia azori-ca, Laurus azorica and Prunus azorica) being replaced, giving way to urban and agricultural areas.
The remaining pristine forest continues under threat due to habitat reduction, fragmentation and invasive plants, with clear impacts on the flora and fauna (Borges et al. 2000; Cardoso et al. 2010; Triantis et al. 2010b; Terzopoulou et al. 2015), and is now restricted to a few dispersed high-altitude fragments, with areas between 4 and 1300 ha (Borges et al. 2005a, 2006; Gaspar et al. 2008), totalling some 6000 ha (Gaspar et al. 2008; Gabriel et al. 2011).
Nunes et al.
24
AZOREAN BIODIVERSITY
The Azorean terrestrial biota is currently com-posed by 6199 species and subspecies (about 6147 species), being 455 (414 species) of these endemic to the archipelago (Borges et al. 2010b, with additional updated data for arthropods). A large component of this biota are recent introduc-tions, with 47% of arthropods (excluding taxa whose colonisation status was not possible to determine) and 81% of vascular plants being ex-otic (Borges et al. 2010b, with additional updated data for arthropods). There are currently 2333 arthropod taxa (269 endemics) reported to the Azores, corresponding roughly to 37% of all ter-restrial species. Fungi as a whole are the second most diverse group with 1328 taxa (34 endemics), followed by the vascular plants with 1110 taxa (73 endemics). Bryophytes (sensu lato) account roughly for 7.7% of the biota, with 480 taxa, in-cluding seven Azorean endemics. Land snails and slugs (Mollusca) are also a diverse group, with 114 taxa, including 49 endemics (Borges et al. 2010b, with additional updated data). Excluding fresh-water fishes (13 taxa), all exotic, there are 58 vertebrate species present in the archipelago: 11 of which are mammals (all introduced, except for three species of native bats and the endemic noctule bat, Nyctalus azoreum). Breeding birds are represented by 43 species, including 11 en-demic subspecies and two enen-demic species (Oceanodroma monteiroi and Pyrrhula murina). Additionally there are also two exotic species of amphibians and two exotic species of reptiles (Borges et al. 2010a).
DATA SETS Arthropods
The arthropod data set (see Appendix I) consists of the results from the BALA project (Biodiversi-ty of Arthropods of Laurisilva of the Azores), an extensive and standardized sampling protocol applied to native vegetation areas in the years of 1992-2002 and 2003-2004 (Borges et al. 2005a; Ribeiro et al. 2005; Gaspar et al. 2008; see also more details at http://islandlab.uac.pt/proj-ectos/ver.php?id=65). Each forest fragment in-cluded a minimum of four 150 m long transects (the number of transects being dependant on the forest fragment area); besides pitfall traps (not
analysed in this publication, but see Borges et al. 2005a; Gaspar et al. 2008), the two or three most common trees and shrubs per transect were sam-pled every 15 metres (for a total of 10 replicates per transect), using canopy beating. For that pur-pose, a stick and a cloth collector tray, in the shape of an inverted pyramid with a bag at the end, was used. Naturally, Juniper was not availa-ble on all of the transects, and so, for this particu-lar subset of data, each forest fragment included between one and sixteen transects. For a more detailed description of the sampling protocol see Ribeiro et al. (2005) and Gaspar et al. (2008). A total of 16 forest fragments, mostly natural patch-es of Juniperus-Sphagnum woods, Juniperus woods, Ilex forests and Juniperus-Laurus forests were sampled in six islands (Flo-res, Faial, Pico, São Jorge, Terceira and São Mi-guel), for a total of 74 transects and 740 samples made for Juniperus. All samples and identified species are deposited in the EDTP – Entomoteca Dalberto Teixeira Pombo, University of Azores, Angra do Heroísmo, Portugal. Occurrence data was digitized in the ATLANTIS database (http://www.atlantis.angra.uac.pt/) and available also in the Azores Bioportal (http://azores-bioportal. uac.pt/) for the general public.
Other taxa Vascular plants
The vascular plants list (see Appendix II.1) in-cludes epiphytic species and one hemiparasite of J. brevifolia and was based on the information from Schäfer (2005).
Bryophytes
The bryophyte data set used in this work includes both herbarium and literature records (Appendix II.2). From all the gathered literature references dealing with Azorean bryophytes (see complete list in Gabriel et al. 2011), 21 specifically men-tioned J. brevifolia as a substrate of either epi-phytic (growing on living bark) or epixylic spe-cies (growing on dead trunks and branches) (see Appendix III). Moreover, data from the collection of bryophytes deposited at the University of the Azores (Angra do Heroísmo) were also included in the study. Some of the herbarium records came from ad hoc inventories, while others, especially
from Terceira (Gabriel & Bates 2005) and Pico Island (Homem 2005) were obtained from com-munity studies, using standard collection proto-cols on native vegetation areas; bryophyte sam-ples on J. brevifolia were obtained from relevés with 30 cm side, placed at different heights on the trees, allowing the estimation of cover and rich-ness of species (further details on Gabriel 2000). All data are included in the ATLANTIS database (http://www.atlantis.angra.uac.pt/atlantis/common /index.jsf) and also available in the Azores Bi-oportal (http://azoresbiBi-oportal.uac.pt/) for the general public.
Lichens
The lichen data set used in this work includes mainly literature records, although approximately one fifth (22 out of 107 species) of the lichen species associated with J. brevifolia referred in Appendix II.3, may also be found on the Collec-tion of Lichens deposited at the University of the Azores (Angra do Heroísmo). Of the 100 licheno-logical references identified for the Azores, 15 specifically refer Juniperus brevifolia as the sub-strate of the lichens (see Appendix III).
Birds
The bird data set used in this work (Appendix II.4) follows the literature (see Appendix III). DATA ANALYSES
Arthropods
For this study, we considered all adult and juve-nile specimens identified to a given morphospe-cies, while excluding all individuals that were not possible to identify or whose classification into morphospecies was dubious. The identification of juvenile/immature specimens is possible for the Azorean fauna due to the relatively low species richness of the archipelago and the long standing experience of one of the authors (PAVB) (see also Ribeiro et al. 2005; Gaspar et al. 2008). For some of the analysis the arthropods were grouped into three colonisation categories: endemic (pre-sent only in the Azores), native non-endemic (“native” for simplification from now on; includ-ing species that, although not endemic, arrived to the islands by natural means), and introduced species, after the criteria of Borges et al. (2010a). We allocated a native status for the taxa without a
tions: i) when the family was known to have only exotic species recorded for the Azores; ii) when the genera was known to be dominated by exotic species in the Azores (based on Borges et al. 2010a). Furthermore, we assigned each species to a functional group (predator, herbivore, sapro-phyte, fungivore) and a feeding mode (external digestion and sucking, chewing and cutting, piercing and sucking, siphoning, not feeding). Data for trophic guild and feeding mode were collated from an extensive literature search of ecological information, including manuscripts with the first descriptions of the species, first spe-cies records for the Azores, brief notes, and eco-logical studies among others. Information was also obtained from experts who have identified the specimens or from experts of a given taxo-nomic group when information for a particular species was not available. For the few taxa identi-fied to morphospecies, we have considered the information of the nearest taxonomic resolution (genus, family).
In the case of Terceira island, to avoid pseudo-replication, when transects were sampled in more than one year, replicates were excluded, in a way as to balance the data chronologically. Addition-ally, Terceira was the only island in which some transects had more than 10 samples due to some additional experiments (see Gaspar et al. 2014). As such, and to standardize with the other islands, when transects had more than 10 samples, all samples past the first ten were excluded from the analysis.
To ascertain potential differences between the islands regarding species richness, abundance, trophic guild composition and feeding mode, sta-tistical comparison tests (Chi-square) were done with R software (R Core Team, 2015) and the respective post-hoc tests for which pairs of popu-lations differ were computed with the NCStats package (Ogle 2015) by performing all chi-square tests for all pairs of populations (with Bonferroni adjustment for inflation due to multiple compari-sons). In cases where the given classes were pre-sent in only one or two islands, these where ex-cluded from the Chi-square tests. To observe the imbalance caused by the unequal sampling effort in the different islands, sample based accumula-tion curves (not shown), standardized at the
min-Nunes et al.
26
formed in EstimateS (Colwell 2009). This soft-ware was also used to estimate the Fisher α and the Shannon-Wiener index for each island and for the archipelago as a whole.
To assess the distribution of species abundanc-es, binning of the species into modified Preston's octaves was performed using the third method described in Gray et al. (2006), using the R pack-age gambin (Matthews et al. 2014). This packpack-age was also used to calculate the corresponding Al-pha GamBin values.
Nonmetric Multidimensional Scaling (Kruskal 1964) was applied to the data at a transect scale using Bray-Curtis similarities, through R software and packages vegan (Oksanen et al. 2015) and ade4 (Dray & Dufour 2007). Statistical signifi-cance in the dissimilarity between islands was assessed through an analysis of similarities (ANOSIM) (Clarke 1993). To discern the possi-ble bias in the results caused by the extremely unbalanced sampling effort between the islands, the NMDS ordination was also done using the data standardized at four randomly selected tran-sects per island. As a measure of the error associ-ated with this rarefaction of the data for the standardized NMDS analysis, 999 permutations of ANOSIM R2 values, using sets of four ran-domly selected transects per island, were estimat-ed in order to construct a 95% confidence inter-val.
The number of shared species between the is-lands and the compositional differences between the islands were assessed using Bray-Curtis simi-larity, through the EstimateS software. The num-ber of shared species and Bray-Curtis similarity values were calculated by using both the full set of data (unequal numbers of transect per island) and 10 standardized sets of data each with 4 tran-sects per island. These standardized sets of data were obtained by numbering each transect in each individual island from 1 to n (where n is the max-imum number of transect in any given island) and then using the R software to generate 10 pseudo-random sets of 4 numbers from 1 to n, for each island.
Other taxa
Excepting Arthropods, which had enough data to allow the performance of comparative
macroeco-logical analyses, other taxa (Bryophytes [Liver-worts, Mosses], Lichens, Ferns and Birds) were analysed using a descriptive approach, in order to obtain: i) lists of species occurring on Juniperus brevifolia (Appendix II); ii) richness of species per taxonomic group and per island (whenever possible); and iii) richness of endemic, native and exotic species and their proportion regarding the Azorean taxa.
RESULTS ARTHROPODS
Arthropod taxonomical data overview
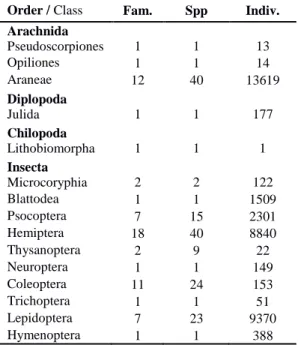
We collected 36729 specimens, corresponding to 161 species, representing four Classes, 15 Orders and 66 Families (Table 1 and Appendix I). Of all the collected species, 50 (31%) are considered endemic, 62 (39%) are native and 49 (30%) are introduced in the archipelago (Table 2).
Table 1. Summary table of the collected arthropod taxa, listing all classes and orders found, with indica-tion of the number of families, species and individuals in each order.
Order / Class Fam. Spp Indiv. Arachnida Pseudoscorpiones 1 1 13 Opiliones 1 1 14 Araneae 12 40 13619 Diplopoda Julida 1 1 177 Chilopoda Lithobiomorpha 1 1 1 Insecta Microcoryphia 2 2 122 Blattodea 1 1 1509 Psocoptera 7 15 2301 Hemiptera 18 40 8840 Thysanoptera 2 9 22 Neuroptera 1 1 149 Coleoptera 11 24 153 Trichoptera 1 1 51 Lepidoptera 7 23 9370 Hymenoptera 1 1 388 Most of the species are rare in the samples, with 90 (56%) having 10 or less individuals. Quite noticeable is the relatively high proportion of
singletons, either at archipelago level (44 species; 27%) or at island level, with particular emphasis for Terceira Island (39 species), where they ac-count for approximately 37% of the species col-lected in juniper canopies (Table 2). The same may be said for the number of uniques, with 49 uniques for the Azores as a whole and 42 uniques in Terceira (40%). Only six species (3.7%) had more than 1000 individuals. The endemic moth Argyresthia atlanticella (Lepidoptera: Yponome-utidae) was the single most abundant species col-lected on the juniper canopies, with 8483 individ-uals (23.1%). The endemic canopy sheet weaver Savigniorrhipis acoreensis (Araneae, Lyniphi-idae) and the native mesh web weaver Lathys dentichelis (Araneae, Dyctinidae) were the most
abundant spiders, with 5758 (15.7%) and 4089 (11.1%) specimens collected, respectively. The other highly diverse and abundant order, the He-miptera, are also represented by the native juniper specialist giant conifer aphid Cinara juniperi (Hemiptera, Lachnidae) with 3085 individuals (8.4%) and by the endemic planthopper from São Miguel Cixius insularis (Hemiptera, Cixiidae) with 1232 specimens (3.4%). The native cock-roach Zetha vestita ranks as the fifth most abun-dant species, with 1509 individuals (4.1%) cap-tured. These six species account for 65.8% of all collected individuals (see also Appendix I for further details), and may be considered as the most common canopy dwellers of the Azorean cedar.
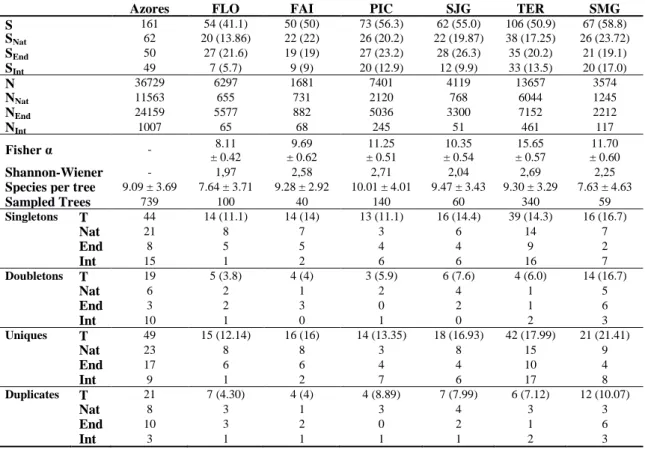
Table 2. Summary table with the Arthropod species richness (S), abundance (N), diversity indexes (Fisher α, Shannon-Wiener), number of singletons and doubletons (species present with one and two individuals), uniques and duplicates (species found only in one and two samples) for the total number of individuals and for each coloni-sation class (Nat, native; End, endemic; Int, introduced), for the entire archipelago and for each individual island. Values in parenthesis indicate the corresponding standardized value, obtained from sample based accumulation curves rarefied at 40 samples. T - Total collected species. FLO – Flores; FAI – Faial; PIC – Pico; SJG – São Jorge; TER – Terceira; SMG – São Miguel.
Azores FLO FAI PIC SJG TER SMG
S 161 54 (41.1) 50 (50) 73 (56.3) 62 (55.0) 106 (50.9) 67 (58.8) SNat 62 20 (13.86) 22 (22) 26 (20.2) 22 (19.87) 38 (17.25) 26 (23.72) SEnd 50 27 (21.6) 19 (19) 27 (23.2) 28 (26.3) 35 (20.2) 21 (19.1) SInt 49 7 (5.7) 9 (9) 20 (12.9) 12 (9.9) 33 (13.5) 20 (17.0) N 36729 6297 1681 7401 4119 13657 3574 NNat 11563 655 731 2120 768 6044 1245 NEnd 24159 5577 882 5036 3300 7152 2212 NInt 1007 65 68 245 51 461 117 Fisher α - 8.11 ± 0.42 9.69 ± 0.62 11.25 ± 0.51 10.35 ± 0.54 15.65 ± 0.57 11.70 ± 0.60 Shannon-Wiener - 1,97 2,58 2,71 2,04 2,69 2,25
Species per tree 9.09 ± 3.69 7.64 ± 3.71 9.28 ± 2.92 10.01 ± 4.01 9.47 ± 3.43 9.30 ± 3.29 7.63 ± 4.63
Sampled Trees 739 100 40 140 60 340 59 Singletons T 44 14 (11.1) 14 (14) 13 (11.1) 16 (14.4) 39 (14.3) 16 (16.7) Nat 21 8 7 3 6 14 7 End 8 5 5 4 4 9 2 Int 15 1 2 6 6 16 7 Doubletons T 19 5 (3.8) 4 (4) 3 (5.9) 6 (7.6) 4 (6.0) 14 (16.7) Nat 6 2 1 2 4 1 5 End 3 2 3 0 2 1 6 Int 10 1 0 1 0 2 3 Uniques T 49 15 (12.14) 16 (16) 14 (13.35) 18 (16.93) 42 (17.99) 21 (21.41) Nat 23 8 8 3 8 15 9 End 17 6 6 4 4 10 4 Int 9 1 2 7 6 17 8 Duplicates T 21 7 (4.30) 4 (4) 4 (8.89) 7 (7.99) 6 (7.12) 12 (10.07) Nat 8 3 1 3 4 3 3 End 10 3 2 0 2 1 6 Int 3 1 1 1 1 2 3
Nunes et al.
28
There is a profound imbalance in the sampling effort, with Terceira Island having the highest number of individuals (13657) and comparatively high species richness, but at the same time it has more than double the number of samples of the second most sampled island (Pico Island, Table 2). When standardizing the number of samples, a more homogeneous set of richness and abundance values was obtained (Table 2).
Rarity patterns
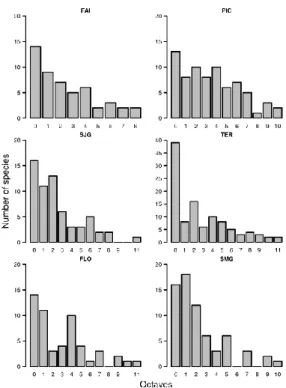
If the species are grouped into modified Preston's octaves, it is possible to observe that for the total number of collected species, for native species and also for the introduced ones it follows a uni-modal distribution, with many rare species and few truly abundant species. On the other hand, the endemics present a more complex multi-modal distribution with some rare and abundant species, and also a large proportion of intermediately abundant species (Fig. 3).
Fig. 3. Modified Preston's octaves histograms for all, endemic, native and introduced species. The three graphs for the three individual colonisation status are scaled equally for the Y axis.
Considering the species in the first quarter of the octaves as truly rare (Gaston 1994), a total of 97 species (or 60% of the total number of species collected on juniper canopies) can be considered as rare in that habitat. If the different colonization classes are considered, 63% of the native species, 36% of the endemic and 53% of the introduced
species are rare in the inventory. If the same bin-ning is done to each island using the total number of species, once again the high number of locally rare species is clear on Faial, São Jorge, Terceira and São Miguel islands. The exceptions are Pico and Flores islands, which show a bimodal distri-bution with many rare and intermediate species (Fig. 4). Repeating the procedure for the islands using the different colonisation classes results in the broad maintenance of the general class pattern (see Fig. 3) in each island.
Fig. 4. Modified Preston's octaves histograms for each of the six sampled islands using all species sorted by island groups. FAI – Faial; PIC – Pico; SJG – São Jor-ge; TER – Terceira; FLO – Flores; SMG – São Miguel. All graphs except the one for Terceira (TER) are scaled equally for the Y axis.
The α GamBin parameter presents a potentially informative ecological diversity metric, because it summarizes the shape of the SAD in a single number. Alpha Gambin values between 0 and 1.5 indicate usually a Log series distribution, between 2 and 2.5 approximates to a Log normal and val-ues higher than 3, more complex multinomial distributions. For deeper explanation of the
GamBin model see Matthews et al. (2014). So, as a simple and intuitive measure of the shape of the SAD's and to better compare the distinct species distributions in Figures 3 & 4, the values of Alpha GamBin and the approximate shape of the distri-butions as given by the index are presented in Table 3.
Table 3. Alpha GamBin indexes for all, endemic, native and introduced species, as well as for each of the six sampled islands, using all species. FAI – Faial; PIC – Pico; SJG – São Jorge; TER – Terceira; FLO – Flo-res; SMG – São Miguel.
Colonization Class Alpha Gam-Bin index Distribution shape All 0,99 logseries Endemic 2,34 lognormal Native 0,85 logseries Introduced 1,34 logseries Island Alpha Gam-Bin index Distribution shape FAI 1,47 logseries PIC 2,23 lognormal SGJ 1,08 logseries TER 0,88 logseries FLO 1,17 logseries SMG 1,09 logseries Species richness
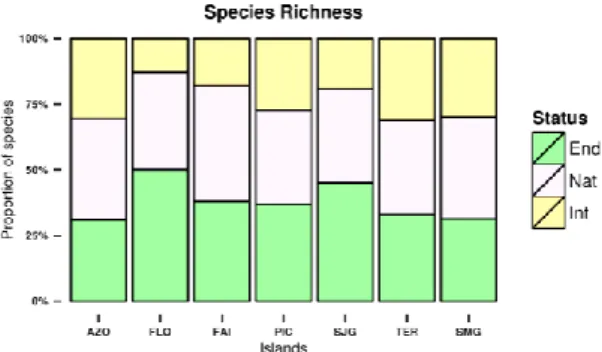
Analysing the proportion of endemic, native and introduced species, we found that both at the Azores archipelago as a whole and at individual island level, species richness is more or less even-ly distributed amongst the three colonisation cat-egories (endemic, native and introduced) with the exception of Flores, Faial and São Jorge, where less than 20% of the species are introduced (Fig. 5). Nevertheless, there were no statistically signif-icant differences among the islands (Χ2 = 12.571, df = 10, p-value = 0.249).
Considering the archipelago as a whole, the orders Araneae, Hemiptera, Coleoptera, Lepidop-tera and PsocopLepidop-tera were the most diverse, with both Araneae and Hemiptera registering 40 spe-cies each, from the 161 collected.
The most diverse families were Linyphiidae –
Araneae with 14 species (six introduced), Staph-ylinidae - Coleoptera with nine species (four in-troduced) and Cixiidae - Hemiptera with a total of seven endemic species.
When each island is considered individually, we find that the previous pattern is similar, with Araneae and Hemiptera accounting, in each is-land, for roughly 50% of the collected species (Fig. 5), with a Chi-square test showing no signif-icant differences in the proportions of the 5 most species diverse orders between the islands (Χ2 = 12.38, df = 25, p-value >0.05).
Fig 5. Proportion of species per colonisation status for endemic, native and introduced species at archipelago and island level.
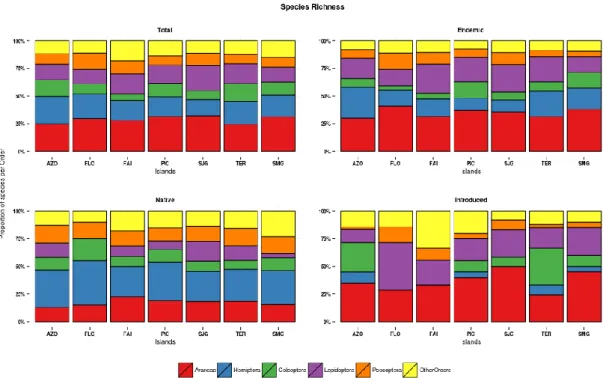
Considering the colonisation status of the species, some deviations from the previous pattern are observed (Fig. 5). For endemics the general pat-tern is maintained along the archipelago, but with higher proportions of spider and true bug species (particularly spiders). The native Hemiptera ac-count for roughly 40% of the collected native species. As with the case of the total species rich-ness, Chi-square tests showed no significant dif-ferences between the islands when considering the share of each Order in the island's species richness (native: Χ2
= 10.30, df = 25, p-value >0.05; endemic: Χ2 = 9.40, df = 25, p-value >0.05; introduced: Χ2 = 22.14, df = 25, p-value >0.05). In the case of the introduced species, Araneae and Coleoptera are the most diverse or-ders at archipelago level, but when looking at each island there is no discernible transversal pattern as was the case for the endemic and native species, notwithstanding the prevalence of spider species on most islands (Fig. 6).
Nunes et al.
30
Fig. 6. Proportion of species per order at archipelago and island level, for all species, endemics, natives and intro-duced species.
Abundance
Taking abundance into consideration, the general patterns change. Native species on all islands account for more than 50% of collected individu-als, but nevertheless the proportion of individuals in each colonisation level is significantly different between the islands (Χ2 = 49.84, df = 10, p-value < 0.0001)and samples from Flores are dominated by individuals of endemic species (almost 90%). Also quite strikingly, introduced species account on average for less than 4% of the number of in-dividuals collected on each island (Fig. 7). Post-hoc tests show that Flores was significantly dif-ferent from the remaining islands with the excep-tion of São Jorge. São Jorge was also significant-ly different from Terceira and Faial (see Appen-dix IV, Table 1).
Considering the archipelago as a whole, Araneae is the most abundant order, with more than 13500 collected individuals, followed by Lepidoptera and Hemiptera. On the other hand, Coleoptera, despite its relatively high species richness, accounts for much less than 1% of all
collected individuals, with only 153 collected in the entire archipelago. It is also conspicuous the disparity in the proportions of each of the five most abundant orders in each island, with no ap-parent common pattern, which translates into a significant difference between them (Χ2 = 139.79, df = 25, p-value < 0.0001) (see Fig. 8). Post-hoc tests indicate that Terceira and São Miguel were significantly different from most of the other is-lands (see Appendix IV, Table 2).
In all the islands spiders and true bugs account for roughly 80% of the collected specimens, but the ratio between them varies in each island, with São Jorge and São Miguel being dominated by spiders whereas in Faial and Flores true bugs ac-count for almost half of the collected individuals. There is also a relatively high abundance of the native cockroach Zetha vestita in all the islands except Faial and Pico. In the case of endemic species, it is quite conspicuous the high propor-tion of Lepidoptera individuals collected in the samples from Flores, Faial, Pico and São Jorge, mainly the ermine moth Argyresthia atlanticella
as well as the dominance of Hemiptera in São Miguel (roughly 55% of the collected individuals) particularly the single island endemic Cixius insu-laris. Once more, for the introduced species, there is no discernible pattern of abundance for the islands of the archipelago (see Fig. 8). Chi-square tests confirmed this graphical interpretation by showing significant differences between the is-lands at all colonisation status (native: Χ2 = 112.56, df = 25, p-value < 0.0001; endemic: Χ2 = 203.94, df = 25, p-value < 0.0001; introduced: Χ2 = 182.85, df = 25, p-value < 0.0001). For natives, post-hoc tests show that São Miguel and Faial were significantly different from most of the oth-er islands, while for endemics São Miguel was once more significantly different from the re-maining islands and Terceira was significantly different from Flores, Faial and São Jorge. For
introduced species, only the “Triangle” islands (Faial, Pico and São Jorge) showed no significant differences between them. See Appendix IV, Ta-ble 2 for further details.
Fig. 7. Proportion of abundance per colonisation status for endemic, native and introduced species at archipel-ago and island level.
Fig. 8. Proportion of abundance per order at archipelago and island level, for all species, endemics, natives and introduced species.
Functional groups and feeding modes
When considering the functional groups to which the collected individuals belong, 76 species (47%) are herbivores, 60 (37 %) are predators (of which 40 are arachnids) and 24 (15%) are sapro-phytes. There is also one omnivore ant species
and 3 fungivorous species (Fig. 8). Fungivorous arthropods were represented, at archipelago level, by only 10 individuals divided amongst 3 species in Terceira and 2 individuals of one species in São Miguel. We found a great constancy in the proportion of species belonging to each functional
Nunes et al.
32
groups across all the islands (Chi-square tests showed no significant differences – Χ2 = 11.56, df = 20, p-value > 0.05). In all the islands almost half the species present in juniper trees are herbi-vores, and predators (mostly spiders) represent roughly 35% of the species. Only in São Miguel there are slightly more predator than herbivore species. Saprophytes make up the majority of the remaining species.
When looking at the division in functional groups by number of collected individuals (Fig. 9), Chi-square tests showed significant differ-ences between the islands (Χ2 = 64.08, df = 15, p-value < 0.0001). The only common feature is that the herbivores were more abundant than predators and saprophytes combined, with the exception of Terceira, were there were more specimens of predators than those of herbivores in the juniper canopies and in São Miguel, where there is a rela-tively high proportion of saprophytes. Post-hoc tests show that Terceira is significantly different from Faial and Flores, and that São Miguel is significantly different from Faial and São Jorge (see Appendix IV, Table 3).
When the feeding mode is considered (Fig. 10), it is possible to observe a repetition of the previ-ous patterns, with the proportions of each catego-ry being more or less conserved across the archi-pelago where species are concerned (and no sig-nificant differences were observed – Χ2 = 13.81, df = 35, p-value >0.05). Considering the propor-tion of collected individuals in each category, once again, no common pattern is observable, with the general pattern for each island following the trends for trophic guild and for the orders when considering the total of individuals. Again, a Chi-square test indicates that the islands are significantly different from each other (Χ2 = 151.48, df = 35, p-value < 0.0001). Post-hoc tests show that São Miguel was significantly different from the other islands. Terceira was also signifi-cantly different from all other islands except Pico (Pico showed no significant differences from the islands of the Central Group nor from Flores). See Appendix IV, Table 4 for further details. Species community similarity
The islands from the central group have the high-est proportion of shared species as shown by the higher number of common species and by the
higher values of Bray-Curtis similarity (Table 4). Pico, Terceira and São Jorge islands also have a high number of shared species with Flores, whereas São Miguel has the lowest values of sim-ilarity with the remaining islands. Considering the colonisation status (Table 4), we can say that the previous pattern is probably driven by the endem-ic species, as these maintain and even exacerbate the trends observed for the complete data set, whereas the native species display higher values of Bray-Curtis similarity, and therefore are not spatially structured. Introduced species are in general present in low numbers, display more or less homogeneous values of Bray-Curtis similari-ty and do not seem to conform to a particular spa-tial pattern, appearing spread throughout the is-lands.
Using the rarefied set of data (Table 5) we can state that the general similarity trends from the observed data are maintained, with the islands from the Central Group being the most similar and with São Miguel and Flores being the most dissimilar. The rarefaction also smoothed down the effects of the sampling bias for Terceira, as these values are more on a par with those from the remaining islands of the Central Group. To complement our similarity analysis, we ordinated transects according to their similarity values (measured with Bray-Curtis coefficient) using NMDS. The first two axes of the NMDS had a stress value of 0.2 indicating that two di-mensions were enough to give an acceptable rep-resentation of our data. The NMDS using the full set of data (Fig. 11) reveal that: 1) the islands of the Central Group share many species; 2) in the two dimensional space defined by the NMDS, the dispersion of the transects of each island and par-ticularly for Terceira is noticeably low (i.e. tran-sects within an island share many species); 3) São Miguel Island stands apart from the remaining of the archipelago and the scattering of transects is particularly high (i.e. strong heterogeneity be-tween bebe-tween transects in terms of species com-position); and 4) Flores Island stands slightly apart from the Central Group and diametrically opposite to São Miguel. In general, the configura-tion of islands on the NMDS plot follows their spatial geographical configuration. As expected, the introduced species break this pattern, in ac-cordance with the results from Tables 4 and 5.
Figure 9. Proportion of species and abundance per different functional groups at archipelago and island level. S - Saprophyte, P/H - Omnivorous; P - Predator; H - Herbivore; F - Fungivore.
Fig. 10. Proportion of species and abundance per different feeding modes at archipelago and island level. Ex - External digestion and sucking; Ch - Chewing and cutting; Pi - Piercing and sucking; Si - Siphoning; No - Not feeding.
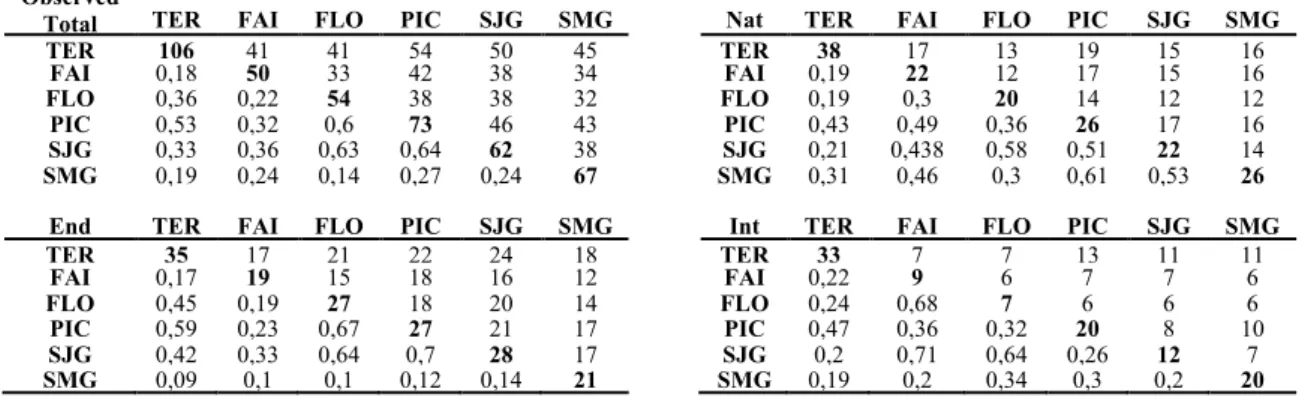
Table 4. Summary of the results of the shared species analysis for the observed data using all species, endemics natives and introduced. Main diagonal – number of species present in the island, upper half – number of shared species between the islands, lower half – Bray-Curtis similarity index values.
Observed
Total TER FAI FLO PIC SJG SMG Nat TER FAI FLO PIC SJG SMG
TER 106 41 41 54 50 45 TER 38 17 13 19 15 16 FAI 0,18 50 33 42 38 34 FAI 0,19 22 12 17 15 16 FLO 0,36 0,22 54 38 38 32 FLO 0,19 0,3 20 14 12 12 PIC 0,53 0,32 0,6 73 46 43 PIC 0,43 0,49 0,36 26 17 16 SJG 0,33 0,36 0,63 0,64 62 38 SJG 0,21 0,438 0,58 0,51 22 14 SMG 0,19 0,24 0,14 0,27 0,24 67 SMG 0,31 0,46 0,3 0,61 0,53 26
End TER FAI FLO PIC SJG SMG Int TER FAI FLO PIC SJG SMG
TER 35 17 21 22 24 18 TER 33 7 7 13 11 11 FAI 0,17 19 15 18 16 12 FAI 0,22 9 6 7 7 6 FLO 0,45 0,19 27 18 20 14 FLO 0,24 0,68 7 6 6 6 PIC 0,59 0,23 0,67 27 21 17 PIC 0,47 0,36 0,32 20 8 10 SJG 0,42 0,33 0,64 0,7 28 17 SJG 0,2 0,71 0,64 0,26 12 7 SMG 0,09 0,1 0,1 0,12 0,14 21 SMG 0,19 0,2 0,34 0,3 0,2 20
Table 5. Summary with the geometric means of the results from the 10 sets of rarefied shared species analysis using all species, endemics, natives and introduced. Main diagonal – averaged number of species present in the island, upper half – averaged number of shared species between the islands, lower half – averaged Bray-Curtis similarity index values.
Rarefied
Total TER FAI FLO PIC SJG SMG Nat TER FAI FLO PIC SJG SMG
TER 44,6 29,2 23,3 30,2 31,9 24,2 TER 14,7 11,6 7,1 10,4 10,1 9,3 FAI 0,43 50 25,8 35,9 35,2 28 FAI 0,51 22 8,7 14,1 13,5 13,6 FLO 0,35 0,37 37,6 26,2 27,7 22 FLO 0,26 0,22 12,2 8,2 7,9 8,2 PIC 0,49 0,55 0,51 52,9 35,6 28,5 PIC 0,53 0,58 0,32 18,6 11,2 11,7 SJG 0,42 0,43 0,56 0,56 55,1 28,7 SJG 0,61 0,45 0,43 0,53 18,5 11,3 SMG 0,33 0,23 0,11 0,23 0,19 53 SMG 0,59 0,46 0,16 0,43 0,47 20,9
End TER FAI FLO PIC SJG SMG Int TER FAI FLO PIC SJG SMG
TER 18,2 12,5 11,9 13 15,1 9,3 TER 11,2 4,9 4,1 6,6 6,4 5,3 FAI 0,37 19 12,3 15,8 15,5 9,6 FAI 0,28 9 4,7 6 6,1 4,7 FLO 0,37 0,43 19,7 13,4 15,5 9,5 FLO 0,25 0,46 5,5 4,3 4,1 4,1 PIC 0,47 0,52 0,56 21,8 18 11 PIC 0,3 0,6 0,35 12,4 6,1 5,5 SJG 0,35 0,41 0,58 0,56 26,2 12,3 SJG 0,32 0,53 0,46 0,46 10,3 4,9 SMG 0,17 0,09 0,09 0,12 0,09 16,3 SMG 0,15 0,17 0,23 0,24 0,17 15,4
Fig. 11. Nonmetric Dimensional Scaling (NMDS) with Bray-Curtis similarities for the six islands using: Total - the full set of data; endemic native and introduced species data.
This separation of São Miguel from the remaining of the archipelago is even more clear when con-sidering only the endemic species and it is equally clear the dissimilarity between transects. This pattern is contrary to the apparent similarity ob-served between the remaining islands. The native communities seem to be fairly similar in each island and also across the archipelago, with the groups showing a great overlap, whereas for the introduced species, all the islands have fairly sim-ilar species compositions, although with some heterogeneity between transects in each island. This visual assessment of the NMDS ordina-tion plots can be statistically tested by using the allied statistical method of Analysis of Similari-ties (ANOSIM). When considering the whole community or only the endemic species, the com-positional dissimilarities seen in the ordination plots are confirmed by significantly high R2 val-ues (Total: R2 = 0.76, p = 0.001; endemic: R2 = 0.83, p = 0.001) obtained. The analysis of
similar-ities for the native species indicates that there are still significant dissimilarities between the species composition of each island, but the relatively lower R2 value hints at a more uniform distribu-tion of the species in the archipelago and/or at a higher intra-island dissimilarity (R2 = 0.39, p = 0.001). The ANOSIM for the introduced species indicates that there are no significant dissimilari-ties between islands/clusters and that the intra-island dissimilarity is high (R2 = 0.02, p = 0.328). Regarding the standardized data, we can observe that the general patterns shown by the full set of data are broadly maintained either with all the individuals or when divided by colonisation sta-tus, as can be seen by the example in Figure 12. In fact, some trends are even more noticeable, such as the differentiation of São Miguel from the remaining of the archipelago or the diametrical opposite position of Flores Island in relation to São Miguel (Fig. 12).
Table 6 presents the results for the observed (un-rarefied) set of data together with mean R2 and the 95% confidence interval for the rarefied data. For the total number of species and for the en-demic species, the constructed confidence inter-vals (CIs) are relatively narrow and the observed R2 value is slightly higher than the upper quantile of the CI. The observed ANOSIM R2 for native species sits inside the CI for this category. For the introduced species the mean R2 is also quite low and the observed R2 actually falls under the lower quantile of the constructed CI.
Table 6. Summary table for ANOSIM results for the total of arthropod species, endemics, natives and intro-duced and for 999 ANOSIM rarefied replicates with the corresponding mean R2 and 95% confidence inter-val for each of the aforementioned categories.
Observed - R2 Signif. Total - 0,76 0,001 Endemic - 0,83 0,001 Native - 0,39 0,001 Introduced - 0,02 0,328 Rarefied replicates CI 95% Mean R2 - Total 0.52 - 0.74 0,63 - Endemic 0.58 - 0.79 0,69 - Native 0.09 - 0.41 0,24 - Introduced 0.04 - 0.31 0,17 - Other taxa
Juniperus brevifolia, existing in a wide range of elevation belts, accommodates a large number of taxa. Besides Arthropods, it is also an important substrate to other vascular species, to bryophytes (liverworts and mosses), to lichens and also to birds. The list of occurrence of all the document-ed taxa may be found in Appendix II, while the bibliographic references are mentioned in Appen-dix III.
The endemic hemi-parasitic Arceuthobium azoricum is of particular interest among flowering species, and, among the five fern species prefer-entially epiphytes on J. brevifolia, two are con-sidered very rare, Ceradenia jungermannioides and Grammitis azorica. In the field, it is some-times possible to observe other vascular plants growing on Juniperus brevifolia, such as Lactuca watsoniana, Erica azorica, Myrsine africana or
There is a large number of bryophyte species growing on Juniperus brevifolia (105; 22.1%) (Appendix II.1). All of these are either endemic of the archipelago (one; 14.3%), the Macaronesia (five; 35.7%), the Iberian Macaronesia (four; 100%), Europe (seven; 58.3%) or native to the Azores (Appendix II).
The proportion of species growing on Juni-perus brevifolia differs among the islands (c.f. Table 7), but apart from Graciosa (where the tree is no longer present) and Santa Maria (where ap-propriate references are lacking), all other islands have liverworts and mosses referred to this sub-strate. The islands of Pico (Homem 2005), São Jorge and Terceira (cf. Gabriel 2000; Gabriel & Bates 2005) present the highest richness values of species growing on this tree. The variation among these values is probably more related to the detail of studies published for each island, than to any real differences of the quality of the substrate. Recently, in inventories made with the Moveclim protocol (cf. Gabriel et al. 2014), many specimens were collected from Juniperus brevifolia and later works will probably even out these values. From the 105 bryophytes growing on Juniperus brevifolia, 30 species are considered as Conserva-tion Concern by the IUCN (Dierssen 2001) (cf. Appendix II). Vulnerable species include nine liverworts (Acrobolbus wilsonii, Aphanolejeunea azorica, A. sintenisii, Cephalozia crassifolia,
Cheilolejeunea cedercreutzii, Leptoscyphus
azoricus, Pallavicinia lyellii, Telaranea azorica, Tylimanthus laxus) and one moss (Daltonia sten-ophylla).
Lichens are another taxonomic group that takes advantage of Juniperus brevifolia as a substrate (Appendix II.3). From the 781 lichens referred to the Azores (Aptroot et al. 2010), 106 were de-scribed as growing on this tree (Table 8). Apart from Dictyonema interruptum, one of the six Ba-sidiomycota referred to the archipelago, the 105 Ascomycota are distributed among the islands in an uneven way, most of the species from Terceira Island (Aptroot et al. 2009), but with the highest proportion in Flores Island, where lichens occur-ring on Juniperus brevifolia bark account for about one third of the species (37; 31.1%). Five lichen species occurring on Juniperus brevifolia are considered endemic of the archipelago
Nunes et al.
38
dissecta, Peltigera melanorrhiza and Thelotrema antoninii), while three species of the genus Usnea are considered Macaronesian endemic (Usnea geissleriana, U. macaronesica and U. subflam-mea). Besides plants and lichens, also birds use Juniperus brevifolia tree. It is possible to find explicit references in literature (Bannerman &
Bannerman 1966; Gabriel 2000; Cabral et al. 2005 and Moura 2014 - Appendix III) to the three subspecies of firecrest (Regulus regulus azoricus, R. r. inermis and R. r. sanctaemariae) and the Azores wood pigeon (Columba palumbus azori-ca) (Appendix II.4). All these subspecies are en-demic to the Azores.
Table 7. Number and proportion of bryophyte species occurring in Juniperus brevifolia and in all substrata, for each of the nine Azorean Islands and the Azores (total) for liverworts (Division Marchantiophyta) and mosses (Di-vision Bryophyta).
Division
Substrate Cor Flo Fai Pic Gra SJo Ter SMi SMa Total Marchantiophyta J. breviolia 10 15.2% 10 9.3% 15 13.8% 49 40.5% 0 0.0% 17 36.2% 55 38.2% 7 5.5% 0 0.0% 65 39.6% All substrata 66 107 109 121 47 131 144 127 74 164 Bryophyta J. breviolia 2.7% 3 4.2% 7 3.4% 6 14.4% 23 0.0% 0 13.3% 11 13.6% 29 0.9% 2 0.0% 0 12.9% 40 All substrata 110 168 174 160 179 83 214 230 139 311
Table 8. Number and proportion of lichen species occurring in Juniperus brevifolia and in all substrata, for each of the nine Azorean Islands and the Azores (total) including Division Ascomycota and Division Basidiomycota.
Division
Substrate Cor Flo Fai Pic Gra SJo Ter SMi SMa Total
Ascomycota J. breviolia 0 (0.0%) 37 (31.1%) 13 (6.6%) 29 (12.8%) 0 (0.0%) 3 (2.0%) 85 (18.9%) 13 (3.4%) 0 (0.0%) 105 (13.5%) All substrata 13 119 196 227 149 148 449 384 56 775 Basidiomycota J. breviolia 0 (0.0%) 0 (0.0%) 0 (0.0%) 0 (0.0%) 0 (0.0%) 0 (0.0%) 1 (100%) 0 (0.0%) 0 (0.0%) 1 (%) All substrata 0 1 1 1 0 2 1 3 0 6 DISCUSSION
There is a large body of studies regarding arthro-pod canopy communities, encompassing a wide range of habitats and spectrum of host plants (Stork 1991; Winchester 1997; Kuria et al. 2010). In many of these studies there is a remarkable constancy in the proportions of certain functional
groups and orders (Moran & Southwood 1982; Krüger & McGavin 2001) and the most abundant and diverse orders in our study (Araneae, Hemip-tera, Lepidoptera) also tend to be amongst the most abundant and diverse in other parts of the world (Stork 1991; Floren & Linsenmair 1997). In our study, Coleoptera are an exception that will be discussed further below. Nevertheless, the fact
that hyperdiverse and biologically important groups like Hymenoptera and Diptera, that can be extremely abundant and diverse on tree canopies (Guilbert 1997; Kitching et al. 1997) were not considered in the BALA protocol (except for ants) can somewhat hamper direct comparisons. Focusing now on data from the Azores, the overall general patterns regarding species rich-ness and abundance agree with general patterns observed in previous studies for the communities of arthropods in Azorean native forests (see Ri-beiro et al. 2005; Gaspar et al. 2008), which is not surprising, since juniper samples are an important component of BALA project data. In all instances Araneae, Hemiptera, Lepidoptera and Coleoptera account for more than 75% of the species record-ed.
Spiders were previously reported as the most abundant order overall (Gaspar et al. 2008) and also the one with the highest ratio of juveniles to adults (Gaspar et al. 2008). This is also true in the case of our study. This high abundance and diver-sity of spiders confirms the propendiver-sity of an ar-chitecturally complex tree as the J. brevifolia to accumulate species in general and spiders in par-ticular (Ribeiro et al. 2005; Ribeiro & Borges 2010). This high number of juvenile spiders, most of them of indigenous species, shows that source populations are building up and completing their life cycle on Juniper, taking advantage of the structural complexity of the host tree to protect their postures and juveniles (see e.g. Borges et al. 2008).
Still regarding the spiders, Linyphiidae was the most diverse family of all the collected orders, something that could be related with the high dispersal capabilities of this family (Thomas et al. 2003) allowing for higher chances of arri-val/colonisation from the continental landmasses and for easier dispersal amongst the different is-lands (Borges & Wunderlich 2008; Cardoso et al. 2010; Carvalho & Cardoso 2014).
The relatively high proportion of singletons found in this study is also in accordance with pre-vious findings (Gaspar et al. 2008). The amount of singletons for Terceira is considerably higher than in aforementioned study, but it is still lower than the values reported for herbivore singletons in canopies given in Ribeiro et al. (2005).
Addi-by binning the species into octaves (60%) was similar to the results obtained by Ribeiro & Bor-ges (2010) for juniper trees (60% of rare species), although these authors also present the rarity data pertaining to three feeding classes, with corre-sponding differences in the proportion of rare species. Our results also support these authors' findings regarding the fact that many rare species accumulate in the canopies of J. brevifolia. For native and introduced species, it may also be the case that these species have greater dispersal ca-pabilities and thus, could more easily end up as habitat-tourists (Borges et al. 2008). This is al-most certainly the case for al-most introduced spe-cies, which almost invariably present low abun-dances, indicating that the core populations are outside natural forests. It is also possible that this high number of (most likely) locally rare species could be a result of undersampling and/or a com-bination of phenological, methodological and spatial edge effects (Scharff et al. 2003; Cardoso et al. 2008).
Concerning the functional groups of the col-lected specimens, both our study and Gaspar et al. (2008) agree on the dominance of predators and herbivores, in terms of abundance and species richness, with these accounting, on all instances, for more than 80% of the individuals or species (respectively) and, mainly in terms of species richness being the proportions of the different functional groups being quite constant through the archipelago. This is not dissimilar from the figures given by Winchester (1997) for temperate coniferous forests or by Krüger & McGavin (2001) for tropical savannah’s, and agrees with patterns of functional group proportion constancy in other parts of the world (Moran & Southwood 1982; Stork 1987, 1991). Herbivores were slight-ly more diverse and abundant than predators, but in our study, Terceira (for abundance) and São Miguel (for richness) deviate from this pattern. On the other hand, Borges et al. (2008) also found more predator than herbivore species on their samples from Terceira. One of the possible rea-sons might be the aforementioned propensity of juniper to accumulate spiders (Ribeiro & Borges 2010). For herbivores, especially chewers, lower diversity might also be related with the reduced number of food choices available on Juniperus