Correlation between Very Short and Short-Term Blood Pressure
Variability in Diabetic-Hypertensive and Healthy Subjects
Karina R. Casali,
1Beatriz D. Schaan,
2,4Nicola Montano,
3Daniela Massierer,
4Flávio M.F. Neto,
5Gabriela H. Teló,
2Priscila S. Ledur,
2Marilia Reinheimer,
5Graciele Sbruzzi,
1Miguel Gus
4Instituto de Cardiologia - Fundação Universitária de Cardiologia (IC/FUC);1 Universidade Federal do Rio Grande do Sul;2 L. Sacco Hospital - University of Milan, Milan - Itália;3 Divisão de Cardiologia - Hospital de Clínicas de Porto Alegre;4 Serviço de Cardiologia - Hospital de Clinicas de Porto Alegre, Porto Alegre, RS – Brazil5
Mailing Address: Gabriela Teló •
Rua Ramiro Barcelos, 2400 - 2° andar sala 218. Postal Code 90035-003, Santana, Porto Alegre, RS - Brazil
E-mail: [email protected]
Manuscript received May 19, 2017, revised manuscript July 02, 2017, accepted July 21, 2017
DOI: 10.5935/abc.20180020
Abstract
Background: Blood pressure (BP) variability can be evaluated by 24-hour ambulatory BP monitoring (24h-ABPM), but its concordance with results from finger BP measurement (FBPM) has not been established yet.
Objective: The aim of this study was to compare parameters of short-term (24h-ABPM) with very short-term BP variability (FBPM) in healthy (C) and diabetic-hypertensive (DH) subjects.
Methods: Cross-sectional study with 51 DH subjects and 12 C subjects who underwent 24h-ABPM [extracting time-rate, standard deviation (SD), coefficient of variation (CV)] and short-term beat-to-beat recording at rest and after standing-up maneuvers [FBPM, extracting BP and heart rate (HR) variability parameters in the frequency domain, autoregressive spectral analysis]. Spearman correlation coefficient was used to correlate BP and HR variability parameters obtained from both FBPM and 24h-ABPM (divided into daytime, nighttime, and total). Statistical significance was set at p < 0.05.
Results: There was a circadian variation of BP levels in C and DH groups; systolic BP and time-rate were higher in DH subjects in all periods evaluated. In C subjects, high positive correlations were shown between time-rate index (24h-ABPM) and LF component of short-term variability (FBPM, total, R = 0.591, p = 0.043); standard deviation (24h-ABPM) with LF component BPV (FBPM, total, R = 0.608, p = 0.036), coefficient of variation (24h-ABPM) with total BPV (FBPM, daytime, -0.585, p = 0.046) and alpha index (FBPM, daytime, -0.592, p = 0.043), time rate (24h-ABPM) and delta LF/HF (FBPM, total, R = 0.636, p = 0.026; daytime R = 0,857, p < 0.001). Records obtained from DH showed weak positive correlations.
Conclusions: Indices obtained from 24h-ABPM (total, daytime) reflect BP and HR variability evaluated by FBPM in healthy individuals. This does not apply for DH subjects. (Arq Bras Cardiol. 2018; 110(2):157-165)
Keywords: Hypertension; Diabetes Mellitus, Type 2; Autonomic Nervous System; Blood Pressure Monitoring, Ambulatory.
Introduction
Blood pressure (BP) variability results from the interplay between external environmental stimuli, vascular system, and biological autonomic regulation of circulation.1 Abnormalities in BP variability, evaluated by continuous intra-arterial ambulatory BP monitoring, are associated with poor outcomes in normotensive and hypertensive subjects.2-4 Noninvasive methods such as finger BP measurement (FBPM) are good alternatives to invasive BP monitoring, as they are accurate non-invasive estimates of beat-to-beat radial BP, providing data that can estimate very short-term BP variability.5,6 In addition, beat-to-beat records allow the extraction of information regarding heart rate (HR)
variability that is directly related to cardiac autonomic control impairment7,8 and associated with poor outcomes in both general9 and diabetic populations.10 However, due to practical and economic reasons, this method cannot be routinely used in the evaluation of outpatients.
however, studies on the association between BP variability evaluated by 24h-ABPM indices and target organ damage have shown contradictory results.4,14
Our report was aimed to compare three different parameters of short-term BP variability in 24h-ABPM, with very short-term BP variability measured by indices obtained from the FBPM in healthy subjects and in a population at high cardiovascular risk comprised of diabetic hypertensive subjects.
Methods
Study design and population
This cross-sectional study was conducted at the outpatient clinic of the Hospital de Clínicas de Porto Alegre (Porto Alegre, RS, Brazil), a tertiary teaching hospital, and Instituto de Cardiologia do Rio Grande do Sul, Fundação Universitária de Cardiologia, from January 2009 to December 2012. The study was approved by the Ethics Committee of both Institutions (nº 0469.0.001.000-08 and 4313/09, respectively), which is accredited by the Office of Human Research Protections as an Institutional Review Board, in agreement with the principles outlined in the Declaration of Helsinki. After protocol approval, all subjects signed a written informed consent for participation. Adult patients of both genders, aged 18-65 years, and with hypertension and type 2 diabetes mellituswere invited to participate (DH group). Control group (C) consisted of healthy subjects, that is, without diagnosis or medication for hypertension and diabetes.
Clinical evaluation
Patients underwent demographic and clinical baseline data collection. Diabetes mellitus was defined by two fasting plasma
glucose ≥ 126 mg/dl or use of antidiabetic agents or personal
history of diabetes. Blood pressure was measured with an office aneroid sphygmomanometer and the mean values were estimated after an two measures on average. The cuff size was selected according to arm circumference. Hypertension was
defined by mean blood pressure ≥ 140/90 mmHg or use of
antihypertensive medication. After baseline data collection, subjects were randomly assigned to evaluations, being first submitted to 24h-ABPM or to FBPM. The interval between the two examinations was of no more than 15 days.
Short-term blood pressure variability evaluation (24h-ABPM) All individuals were submitted to a 24h-ABPM in a usual working day, using a monitor (Spacelabs 90207, Spacelabs, Redmond, WA). Measurements were obtained every 15 minutes from 7 a.m. to 11 p.m., and every 20 minutes from 11 p.m. to 7 a.m. to complete 24 hours of the period studied. Cuff size was selected according to subjects’ arm circumference.14
Based on the results of 24h-ABPM, the mean 24-hour systolic (SBP) and diastolic (DBP) blood pressures were calculated for each patient. Three different parameters of SBP variability were calculated: 1) time-rate index (rate of change in SBP over time in mmHg/min, defined as the first derivative values of SBP by time); 2) coefficient of variation of systolic BP within 24 hours (SD/mean pressure x 100%); and 3) mean
of standard deviation of 24-hour systolic BP. The time-rate index allows the calculation of angular coefficients’ sum and aims to measure how fast or slow and in which direction SBP values change. The measure was calculated using the following formula, where r is the rate of BP variability over time (considering the differences between BP measurements at each time interval) and N is the number of recordings:15
R = |r| =
N – 1
N – 1
i = 1|ri|
∑
In addition, considering circadian variations of BP and possible differences between daytime and nighttime 24h-ABPM parameters, data were divided into daytime and nighttime according to patients’ reports and were also analyzed separately, considering both periods. Circadian behavior differences were calculated by subtracting nighttime from daytime values for each parameter.
Very short-term blood pressure variability evaluation (FBPM) Blood pressure was recorded continuously, on a beat-to-beat basis, using the FINAPRES system (Ohmeda 2300, Monitoring Systems, Englewood, CO, USA).16 In this method, the pressure wave can be continuously monitored by a sensor placed on the patient’s non-dominant middle finger, detecting small oscillations only. The experimental protocol had measurements at two different stages: ten minutes at rest in a sitting position and ten minutes after standing-up maneuver (sympathetic activation).
The BP signal was digitized by the CODAS system (Computer Operated Data Acquisition Software; DATAQ, Instruments, AKRON, OH, USA), sampling at 1 kHz and analyzed for each condition. Pulse interval (PI) tachogram and systolic arterial (SA) systogram series were constructed through the algorithm of Windaq/DATAQ, which identifies systolic peaks from BP waves. Systogram and tachogram series were analyzed by spectral analysis (frequency domain analysis) using an autoregressive model, applied to stationary intervals, which were selected in each segment condition. The stationarity of each time series was tested as previously reported.17 Short-term BP and HR variabilities were evaluated based on systogram and tachogram analyses, respectively.
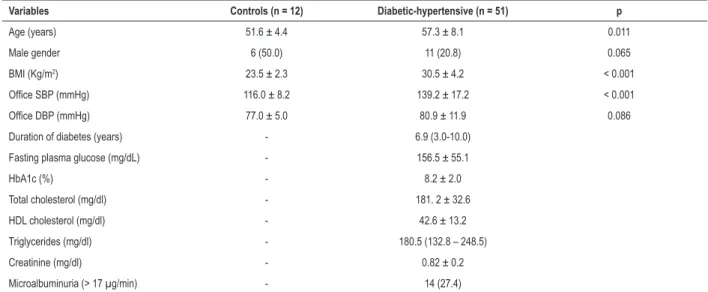
Table 1 – Clinical characteristics of controls (C) and diabetic-hypertensive (DH) subjects.
Variables Controls (n = 12) Diabetic-hypertensive (n = 51) p
Age (years) 51.6 ± 4.4 57.3 ± 8.1 0.011
Male gender 6 (50.0) 11 (20.8) 0.065
BMI (Kg/m2) 23.5 ± 2.3 30.5 ± 4.2 < 0.001
Office SBP (mmHg) 116.0 ± 8.2 139.2 ± 17.2 < 0.001
Office DBP (mmHg) 77.0 ± 5.0 80.9 ± 11.9 0.086
Duration of diabetes (years) - 6.9 (3.0-10.0)
Fasting plasma glucose (mg/dL) - 156.5 ± 55.1
HbA1c (%) - 8.2 ± 2.0
Total cholesterol (mg/dl) - 181. 2 ± 32.6
HDL cholesterol (mg/dl) - 42.6 ± 13.2
Triglycerides (mg/dl) - 180.5 (132.8 – 248.5)
Creatinine (mg/dl) - 0.82 ± 0.2
Microalbuminuria (> 17 µg/min) - 14 (27.4)
BMI: body mass index, SBP: systolic blood pressure, DBP: diastolic blood pressure, HbA1c: glycated hemoglobin, HDL: high-density lipoprotein; FBPM: Short-Term Blood Pressure. Continuous variables are expressed as mean ± standard deviation or median and interquartile range (p25-p75) and percentiles. Categorical variables are expressed as number (%). Comparisons were tested by Pearson’s χ2 test and Student’s t test.
bands21 and expressed spontaneous baroreflex sensitivity. All series were analyzed by a trained researcher who was also blinded to conditions and subjects.
Delta indices were calculated for HR variability (HRV), LF/HF index and LF component of BPV, using variable values before (rest) and after standing-up maneuver (sympathetic activation, SA) for normalization, as follows:
Delta = SA – REST REST
These indices had been previously proposed in order to quantify autonomic responses to standing-up maneuver.22,23
Biochemical measurements
Venous blood samples for biochemical measurements were drawn after 12-hour fasting. Plasma glucose was determined by the glucose oxidase method, serum creatinine by Jaffé’s reaction, and glycated hemoglobin (HbA1c) by ion-exchange HPLC (Merck-Hitachi L-9100 HbA1c analyzer; Merck, Darmstadt, Germany). Serum cholesterol and triglycerides were measured by enzymatic-colorimetric methods (Merck Diagnostica, Darmstadt, Germany; Boehringer Mannheim, Buenos Aires, Argentina), and HDL cholesterol by a homogeneous direct method (autoanalyzer, ADVIA 1650). Low-density lipoprotein (LDL) cholesterol was calculated using Friedewald’s formula.24
Statistical analyses
Data are expressed as mean ± standard deviation (SD) or medians and interquartile intervals, according to normality plots with tests and percentages. Pearson’s chi-square, unpaired Student’s t-test, Mann-Whitney rank sum test, two-way repeated measures ANOVA or Friedman repeated measures
analysis of variance on rank, post hoc Student-Newman-Keuls were used when variables were compared between groups, as indicated. The correlation between the different indices obtained by 24h-ABPM and by FBPM were analyzed by the Spearman’s correlation coefficient. Correlations were considered for discussion only if they were statistically significant and represented large-effect sizes, as defined by a correlation coefficient of 0.50 or higher.25 All statistical analyses were performed using the SPSS statistical software package version 17.0 for Windows (SPSS Inc., Chicago, IL, USA). Statistical significance was set at p < 0.05.
Results
Twelve healthy subjects (C) and 73 diabetic-hypertensive patients (DH) were selected; all C and 51 DH had complete data from 24h-ABPM and FBPM. Controls were 51.7 ± 8.1 years old and 50% were men; DH were 57.3 ± 8.1 years-old, 12% were men, 54.9% had their office BP well-controlled (< 130/80 mmHg) and 35.8% had good metabolic control (HbA1c < 7.0%). Clinical characteristics are shown in Table1.
Figure 1 – Short-term BP variability (24h-ABPM). Data are shown as mean ± SD. SBP, systolic blood pressure. Analysis using 24-hour records (total) and divided into daytime and nighttime periods. Graph shows a comparison between controls (C, green bars) and diabetic-hypertensive (DH, blue bars) groups, also including circadian behaviour differences, calculated by subtracting nighttime from daytime values (Difference, last bars of each graphic). * p < 0.05 vs. C, Student’s t-test. Table reports all values, compared by Friedman repeated measures analysis of variance on rank, post hoc Student-Newman-Keuls. † p < 0.05 vs. total period; # p < 0.05 vs. daytime period.
160 140 120 100 80 60 40 20 0 0.80 0.70 0.60 0.50 0.40 0.30 0.20 0.10 0.00 14 12 10 8 6 4 2 0 –2 –4 –6 20 15 10 5 0 –5 Mean SBP (mmHg) T ime-rate SBP (mmHg/min)
Coefficient of variation SBP
(%)
Standard deviation SBP
(mmHg)
Total(24h) Daytime Nighttime Difference Total(24h) Daytime Nighttime Difference Total(24h) Daytime Nighttime Difference Total(24h) Daytime Nighttime Difference
Variable
Mean SBP (mmHg)
Time-rate, SBP (mmHg/min)
Coefficient of variation, SBP (%)
Standard deviation of mean SBP (mmHg)
DH C
Total (24h)
111.8 ± 6.6
0.44 ± 0.06
9.8 ± 1.7
10.9 ± 1.8
Daytime
116.2 ± 6.8†
0.48 ± 0.07†
7.3 ± 0.9†
8.4 ± 1.0†
Nighttime
101.2 ± 8.4†#
0.36 ± 0.08†#
8.8 ± 2.1#
8.8 ± 1.9†
Total (24h)
132.4 ± 13.8
0.56 ± 0.13
10.3 ± 2.8
10.0 ± 2.4
Daytime
135.2 ± 15.2†
0.59 ± 0.16
9.5 ± 2.3†
12.9 ± 3.4†
Nighttime
128.2 ± 13.7†#
0.50 ± 0.14†#
8.3 ± 2.3†#
10.6 ± 2.3†#
* * * * * * * * * * *
the coefficient of variation and mean of standard deviation of 24-hour systolic BP were positive in DH, negative in C, and different between groups.
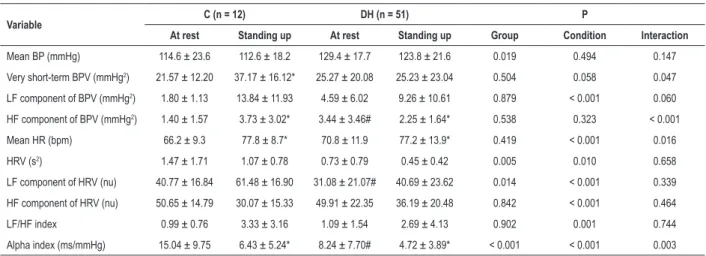
Very short-term BP variability and HR variability (FBPM) results obtained by spectral analysis are displayed in Table 2. As expected, BP was higher in DH vs. C at rest and after standing-up maneuver. Heart rate variability, LF component of HRV, and alpha index were lower in DH vs. C. The standing-up maneuver, applied to induce sympathetic activation, resulted in differences for all HR variability components, showing the expected response to this maneuver in both groups. However, BP variability did not change after the maneuver in DH subjects, and the alpha index (spontaneous baroreflex sensitivity) was lower at rest and after the maneuver in this group when compared to controls.
Autonomic response to standing-up maneuver assessed by delta indices (Figure 2) had a lower response for LF/HF ratio in DH group as compared to C group. Changes in delta HRV and delta_LF/HF variability (BPV) were not different.
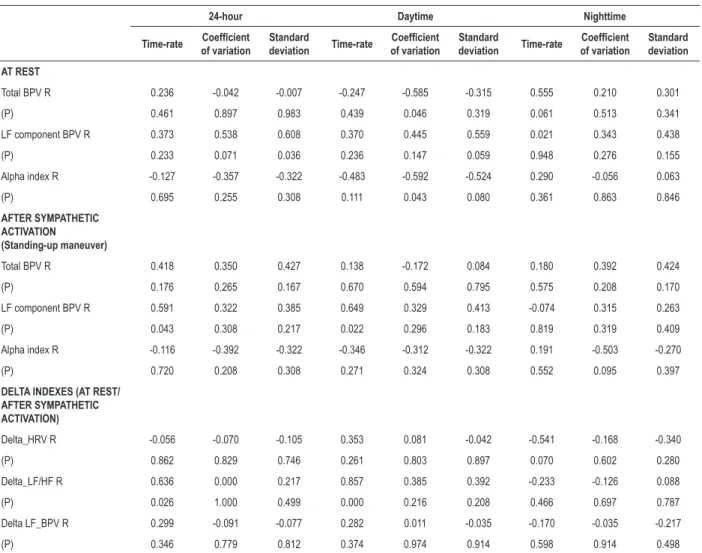
Correlations between very short- and short-term BP variabilities are shown in Tables 3 (C group) and 4 (DH group). In C group, some correlations were found at rest, and some after the standing-up maneuver. At rest, standard deviation of 24-hour systolic BP (24h-ABPM) was positively correlated with the LF component of BP variability (FBPM) in 24-hour evaluation; the coefficient of variation (24h-ABPM) was negatively correlated with total BP variability and alpha index (FBPM) during daytime. After standing-up maneuver, time-rate (24h-ABPM) was positively correlated with the LF component of BP variability (FBPM, 24 hours, and daytime). Table 2 – Very short-term blood pressure variability and heart rate variability (FBPM) at rest and after standing-up maneuver.
Variable C (n = 12) DH (n = 51) P
At rest Standing up At rest Standing up Group Condition Interaction
Mean BP (mmHg) 114.6 ± 23.6 112.6 ± 18.2 129.4 ± 17.7 123.8 ± 21.6 0.019 0.494 0.147
Very short-term BPV (mmHg2) 21.57 ± 12.20 37.17 ± 16.12* 25.27 ± 20.08 25.23 ± 23.04 0.504 0.058 0.047
LF component of BPV (mmHg2) 1.80 ± 1.13 13.84 ± 11.93 4.59 ± 6.02 9.26 ± 10.61 0.879 < 0.001 0.060
HF component of BPV (mmHg2) 1.40 ± 1.57 3.73 ± 3.02* 3.44 ± 3.46# 2.25 ± 1.64* 0.538 0.323 < 0.001
Mean HR (bpm) 66.2 ± 9.3 77.8 ± 8.7* 70.8 ± 11.9 77.2 ± 13.9* 0.419 < 0.001 0.016
HRV (s2) 1.47 ± 1.71 1.07 ± 0.78 0.73 ± 0.79 0.45 ± 0.42 0.005 0.010 0.658
LF component of HRV (nu) 40.77 ± 16.84 61.48 ± 16.90 31.08 ± 21.07# 40.69 ± 23.62 0.014 < 0.001 0.339
HF component of HRV (nu) 50.65 ± 14.79 30.07 ± 15.33 49.91 ± 22.35 36.19 ± 20.48 0.842 < 0.001 0.464
LF/HF index 0.99 ± 0.76 3.33 ± 3.16 1.09 ± 1.54 2.69 ± 4.13 0.902 0.001 0.744
Figure 2 – Autonomic response to standing-up maneuver as evaluated by delta indices: delta HRV (heart rate variability), delta LF/HF (low frequency/high frequency) and delta of LF of blood pressure variability (LF_BPV), calculated from HR variability, LF/HF index and LF component of BPV, respectively. Box plots (median, 25 and 75% interquartile intervals) showing comparison between controls (C, blue bars) and diabetic-hypertensive (DH, green bars) groups. * p < 0.001 and ** p = 0.009 vs. C, Mann-Whitney rank sum test.
40
20
0
–20
–40
–60
–80
Delta HR
V
Delta LF/HF Delta LF_BPV
C
DH CDH CDH
400
300
200
–200 100
0
–100
1200
1000
800
600
400
200
–200 0
* * *
Table 3 – Correlation between very short- (FBPM) and short-term (24h-ABPM) BP variability parameters – Control group.
24-hour Daytime Nighttime
Time-rate Coefficient of variation
Standard
deviation Time-rate
Coefficient
of variation
Standard
deviation Time-rate
Coefficient
of variation
Standard deviation
AT REST
Total BPV R 0.236 -0.042 -0.007 -0.247 -0.585 -0.315 0.555 0.210 0.301
(P) 0.461 0.897 0.983 0.439 0.046 0.319 0.061 0.513 0.341
LF component BPV R 0.373 0.538 0.608 0.370 0.445 0.559 0.021 0.343 0.438
(P) 0.233 0.071 0.036 0.236 0.147 0.059 0.948 0.276 0.155
Alpha index R -0.127 -0.357 -0.322 -0.483 -0.592 -0.524 0.290 -0.056 0.063
(P) 0.695 0.255 0.308 0.111 0.043 0.080 0.361 0.863 0.846
AFTER SYMPATHETIC ACTIVATION (Standing-up maneuver)
Total BPV R 0.418 0.350 0.427 0.138 -0.172 0.084 0.180 0.392 0.424
(P) 0.176 0.265 0.167 0.670 0.594 0.795 0.575 0.208 0.170
LF component BPV R 0.591 0.322 0.385 0.649 0.329 0.413 -0.074 0.315 0.263
(P) 0.043 0.308 0.217 0.022 0.296 0.183 0.819 0.319 0.409
Alpha index R -0.116 -0.392 -0.322 -0.346 -0.312 -0.322 0.191 -0.503 -0.270
(P) 0.720 0.208 0.308 0.271 0.324 0.308 0.552 0.095 0.397
DELTA INDEXES (AT REST/ AFTER SYMPATHETIC ACTIVATION)
Delta_HRV R -0.056 -0.070 -0.105 0.353 0.081 -0.042 -0.541 -0.168 -0.340
(P) 0.862 0.829 0.746 0.261 0.803 0.897 0.070 0.602 0.280
Delta_LF/HF R 0.636 0.000 0.217 0.857 0.385 0.392 -0.233 -0.126 0.088
(P) 0.026 1.000 0.499 0.000 0.216 0.208 0.466 0.697 0.787
Delta LF_BPV R 0.299 -0.091 -0.077 0.282 0.011 -0.035 -0.170 -0.035 -0.217
(P) 0.346 0.779 0.812 0.374 0.974 0.914 0.598 0.914 0.498
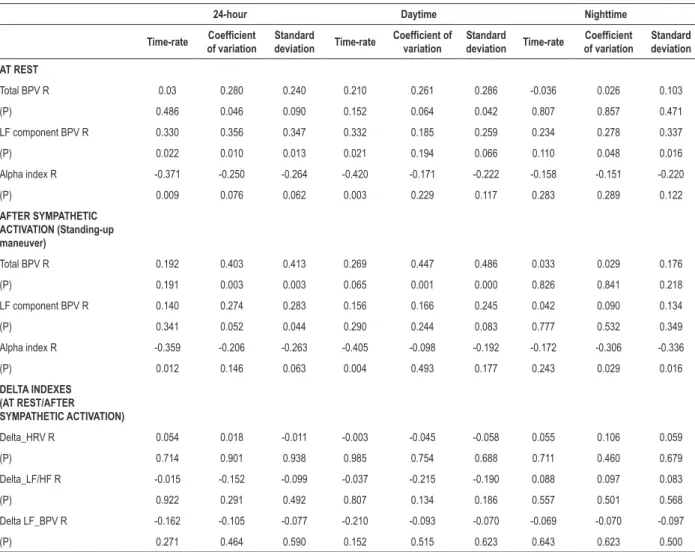
Time-rate (24h-ABPM) was correlated with delta_LF/HF (FBPM, 24 hours, and daytime). In DH group, although some correlations were statistically significant, none of them represented large-effect sizes (correlation coefficient of 0.50 or higher). Moderate-effect sizes (correlation coefficient near 0.50) were shown for total BP variability (24h-ABPM), coefficient of variation, and standard deviation (FBPM, 24 hours, and daytime). There was no correlation between short-term (24h-ABPM) and very short-term variability (FBPM) parameters, considering delta indices for DH subjects.
Discussion
BP and HR variabilities were assessed in healthy and diabetic-hypertensive individuals by two well-known methods—24h-ABPM and FBPM—, seeking potential concordance between results of each method, which was indeed observed. Correlations between indices of BP variability (time rate with LF component BPV, standard deviation with LF component BPV, and coefficient of variation
Table 4 – Correlation between very short- (FBPM) and short-term (24h-ABPM) BP variability parameters – DH group.
24-hour Daytime Nighttime
Time-rate Coefficient of variation
Standard
deviation Time-rate
Coefficient of
variation
Standard
deviation Time-rate
Coefficient
of variation
Standard deviation
AT REST
Total BPV R 0.03 0.280 0.240 0.210 0.261 0.286 -0.036 0.026 0.103
(P) 0.486 0.046 0.090 0.152 0.064 0.042 0.807 0.857 0.471
LF component BPV R 0.330 0.356 0.347 0.332 0.185 0.259 0.234 0.278 0.337
(P) 0.022 0.010 0.013 0.021 0.194 0.066 0.110 0.048 0.016
Alpha index R -0.371 -0.250 -0.264 -0.420 -0.171 -0.222 -0.158 -0.151 -0.220
(P) 0.009 0.076 0.062 0.003 0.229 0.117 0.283 0.289 0.122
AFTER SYMPATHETIC ACTIVATION (Standing-up maneuver)
Total BPV R 0.192 0.403 0.413 0.269 0.447 0.486 0.033 0.029 0.176
(P) 0.191 0.003 0.003 0.065 0.001 0.000 0.826 0.841 0.218
LF component BPV R 0.140 0.274 0.283 0.156 0.166 0.245 0.042 0.090 0.134
(P) 0.341 0.052 0.044 0.290 0.244 0.083 0.777 0.532 0.349
Alpha index R -0.359 -0.206 -0.263 -0.405 -0.098 -0.192 -0.172 -0.306 -0.336
(P) 0.012 0.146 0.063 0.004 0.493 0.177 0.243 0.029 0.016
DELTA INDEXES (AT REST/AFTER SYMPATHETIC ACTIVATION)
Delta_HRV R 0.054 0.018 -0.011 -0.003 -0.045 -0.058 0.055 0.106 0.059
(P) 0.714 0.901 0.938 0.985 0.754 0.688 0.711 0.460 0.679
Delta_LF/HF R -0.015 -0.152 -0.099 -0.037 -0.215 -0.190 0.088 0.097 0.083
(P) 0.922 0.291 0.492 0.807 0.134 0.186 0.557 0.501 0.568
Delta LF_BPV R -0.162 -0.105 -0.077 -0.210 -0.093 -0.070 -0.069 -0.070 -0.097
(P) 0.271 0.464 0.590 0.152 0.515 0.623 0.643 0.623 0.500
BPV: blood pressure variability, LF: low frequency, LF_BPV: LF component of BPV; DH: Diabetic-Hypertensive. Statistic correlation expressed as correlation coefficient (R) and significance (P), obtained by Spearman’s test
with total BPV and alpha index) and indices of HR variability (time rate with delta_LF/HF) were high and significant in controls. On the other hand, few moderate correlations were observed in diabetic-hypertensive patients only after sympathetic activation.
As expected, there were differences between 24h-ABPM indices obtained in total, daytime, and nighttime periods because of the well-known circadian variations of BP levels26,27 which occurred in both healthy and diabetic-hypertensive subjects. This leads us to conclude that data were adequately collected. Moreover, periods division showed differences between groups only when data collection included the day period, in accordance with previous reports.28,29
In controls, correlations between very short- and short-term BP variability were present with FBPM data at rest and after the standing-up maneuver, but only when daytime data were included. This probably occurs because both methods are evaluating BP signals in similar situations, as 24h-ABPM provides data obtained mostly during routine activities in standing-up position (mean duration of nighttime period ∼6.9h). The most significant correlations were those between time-rate index (24h-ABPM) and LF component of BP variability and delta_LF/HF (FBPM); also between the coefficient of variation (24h-ABPM) and between total BPV and the alpha index in all periods that included daytime data. The time-rate index obtained by 24h-ABPM (24-hour or daytime period) in healthy individuals is expected to reflect what the reference standard (FBPM) would show, considering LF component of BP variability and delta_LF/HF.
The weak correlations observed between 24h-ABPM and FBPM indices in the diabetic-hypertensive group depict a very different pattern, which is certainly related to their disease. Moreover, there was no correlation between short-term variability parameters and delta indices. These correlations are weak even though four times more patients were evaluated, which would show significant correlations if they in fact existed. We cannot exclude that one or both methods employed may provide false results for this specific population once FBPM, for example, depends on attaining good BP signals, and quality of such information was not good because of vascular disorders common to this population.32 Therefore, we do not recommend 24h-ABPM to estimate very short-term BP variability parameters based on short-term variability indices for diabetic-hypertensive individuals.
Currently, the evaluation of BP variability across the several indices that can be obtained from 24h-ABPM or home blood pressure monitoring is not recommended by guidelines,14,33 for predicting cardiovascular risk, or as additional goal for antihypertensive therapy, because literature has no consensus on these issues.4,14,34,35 It is possible that evidence available is not strong enough to support this use because the tools used are not so reliable. We suggest that equations derived from the 24h-ABPM measurement for non-diabetic subjects would be useful for risk prediction, but not for diabetic-hypertensive patients. It is unknown, though, whether this pattern occurs in hypertensive-only populations. The use of BP variability reduction as a new target to explore in further intervention trials related to hypertension should only be considered after this information is validated.
Considering the high prevalence of autonomic neuropathy in diabetes,36,37 and characteristic changes of this complication detected in the diabetic-hypertensive group (circadian behavior differences, lower spontaneous baroreflex sensitivity, HR variability and lower responses to stand-up in the LF/HF ratio vs. controls), we attributed to this complication some of the differences observed in other indices between groups. The standing-up maneuver is usually applied to induce sympathetic activation in very short-term BP variability evaluation, and in fact it induced the expected cardiac autonomic response for many indices in controls, but not for most of them in diabetic-hypertensive individuals.
Taking clinical characteristics of diabetic-hypertensive subjects into account and bearing in mind that the sample studied was obtained from a tertiary center, many patients were not adequately monitored (BP and metabolic control),
indicating a high-risk group. Perhaps in this high-risk population, variability found in 24h-ABPM or other home BP evaluation methods may not successfully qualify higher cardiovascular risk beyond absolute systolic or diastolic BP, as previously described.34,38 Also, the age differences found could, at least partially, overestimate the differences between groups, and therefore configure a limitation of this study.
Conclusions
In summary, short-term BP variability measured by time-rate index, standard deviation or coefficient of variation in 24h-ABPM are correlated with LF component BPV and delta_LF/HF obtained from FBPM in nondiabetic individuals. Such findings should be evaluated in further cohort studies adequately designed for this purpose, also seeking relations with hard outcomes. This correlation was not well established in diabetic-hypertensive subjects. Some indices obtained from FBPM for diabetic subjects are promising tools for the diagnosis of diabetic autonomic neuropathy. Considering a standard reference for the diagnosis of autonomic neuropathy, these indices and cutoff values should be evaluated in further studies adequately designed for this purpose.
Author contributions
Conception and design of the research and Analysis and interpretation of the data: Casali KR, Schaan B, Montano N, Massierer D, Neto FMF, Teló G, Ledur PS, Reinheimer M, Sbruzzi G, Gus M; Acquisition of data: Casali KR, Schaan B, Montano N, Massierer D, Teló G, Ledur PS, Reinheimer M, Sbruzzi G, Gus M; Statistical analysis: Casali KR, Teló G, Gus M; Obtaining financing: Schaan B, Gus M; Writing of the manuscript: Casali KR; Critical revision of the manuscript for intellectual content: Schaan B, Montano N, Massierer D, Neto FMF, Teló G, Ledur PS, Reinheimer M, Sbruzzi G, Gus M.
Potential Conflict of Interest
No potential conflict of interest relevant to this article was reported.
Sources of Funding
This study was funded by CNPq and FIPE (Hospital de Clínicas de Porto Alegre).
Study Association
This study is not associated with any thesis or dissertation work.
Ethics approval and consent to participate
1. Stauss HM. Identification of blood pressure control mechanisms by power spectral analysis. Clin Exp Pharmacol Physiol. 2007;34(4):362-8. doi: 10.1111/j.1440-1681.2007.04588.x.
2. Ribeiro AH, Lotufo PA, Fujita A, Goulart AC, Chor D, Mill JG, et al. Association between short-term systolic blood pressure variability and carotid intima-media thickness in ELSA-Brasil baseline. Am J Hypertens. 2017;30(10):954-960. doi: 10.1093/ajh/hpx076.
3. Frattola A, Parati G, Cuspidi C, Albini F, Mancia G. Prognostic value of 24-hour blood pressure variability. J Hypertens. 1993;11(10):1133-7. PMID: 8258679.
4. Parati G, Pomidossi G, Albini F, Malaspina D, Mancia G. Relationship of 24-hour blood pressure mean and variability to severity of target-organ damage in hypertension. J Hypertens. 1987;5(1):93-8. PMID: 3584967.
5. Parati G, Casadei R, Groppelli A, Di Rienzo M, Mancia G. Comparison of finger and intra-arterial blood pressure monitoring at rest and during laboratory testing. Hypertension. 1989;13(6 Pt 1):647-55. PMID: 2500393.
6. Parati G, Ochoa JE, Salvi P, Lombardi C, Bilo G. Prognostic value of blood pressure variability and average blood pressure levels in patients with hypertension and diabetes. Diabetes Care. 2013;36 Suppl 2:S312-24. doi: 10.2337/dcS13-2043.
7. La Rovere MT, Pinna GD, Hohnloser SH, Marcus FI, Mortara A, Nohara R, et al; ATRAMI Investigators. Autonomic Tone and Reflexes After Myocardial Infarcton. Baroreflex sensitivity and heart rate variability in the identification of patients at risk for life-threatening arrhythmias: implications for clinical trials. Circulation. 2001;103(16):2072-7. PMID: 11319197.
8. Vinik AI, Maser RE, Mitchell BD, Freeman R. Diabetic autonomic neuropathy. Diabetes Care. 2003;26(5):1553-79. PMID: 12716821.
9. Tsuji H, Larson MG, Venditti FJ Jr, Manders ES, Evans JC, Feldman CL, et al. Impact of reduced heart rate variability on risk for cardiac events. The Framingham Heart Study. Circulation. 1996;94(11):2850-5. PMID: 8941112.
10. Gerritsen J, Dekker JM, TenVoorde BJ, Kostense PJ, Heine RJ, Bouter LM, et al. Impaired autonomic function is associated with increased mortality, especially in subjects with diabetes, hypertension, or a history of cardiovascular disease: the Hoorn Study. Diabetes Care. 2001;24(10):1793-8. PMID: 11574444.
11. Wittke E, Fuchs SC, Fuchs FD, Moreira LB, Ferlin E, Cichelero FT, et al. Association between different measurements of blood pressure variability by ABP monitoring and ankle-brachial index. BMC Cardiovasc Disord. 2010 Nov 5;10:55. doi: 10.1186/1471-2261-10-55.
12. Castiglioni P, Parati G, Omboni S, Mancia G, Imholz BP, Wesseling KH, et al. Broad-band spectral analysis of 24 h continuous finger blood pressure: comparison with intra-arterial recordings. Clin Sci (Lond). 1999;97(2):129-39. PMID: 10409467.
13. Parati G, di Rienzo M, Omboni S, Castiglioni P, Frattola A, Mancia G. Spectral analysis of 24 h blood pressure recordings. Am J Hypertens. 1993;6(6 Pt 2):188S-93S. PMID: 8347316.
14. Hansen TW, Thijs L, Li Y, Boggia J, Kikuya M, Björklund-Bodegård K, et al. Prognostic value of reading-to-reading blood pressure variability over 24 hours in 8938 subjects from 11 populations. Hypertension. 2010;55(4):1049-57. doi: 10.1161/HYPERTENSIONAHA.109.140798. Erratum in: Hypertension. 2010;55(6):e27.
15. Zakopoulos NA, Tsivgoulis G, Barlas G, Papamichael C, Spengos K, Manios E, et al. Time rate of blood pressure variation is associated with increased common carotid artery intima-media thickness. Hypertension. 2005;45(4):505-12. doi: 10.1161/01.HYP.0000158306.87582.43.
16. Yamakoshi K, Kamiya A, Shimazu H, Ito H, Togawa T. Noninvasive automatic monitoring of instantaneous arterial blood pressure using the
vascular unloading technique. Med Biol Eng Comput. 1983;21(5):557-65. PMID: 6633005.
17. Porta A, D’Addio G, Guzzetti S, Lucini D, Pagani M. Testing the presence of non stationarities in short heart rate variability series. Comp Cardiol. 2004;31:645-8.
18. Malliani A, Pagani M, Lombardi F, Cerutti S. Cardiovascular neural regulation explored in the frequency domain. Circulation. 1991;84(2):482-92. PMID: 1860193.
19. Pagani M, Montano N, Porta A, Malliani A, Abboud FM, Birkett C, et al. Relationship between spectral components of cardiovascular variabilities and direct measures of muscle sympathetic nerve activity in humans. Circulation. 1997;95(6):1441-8. PMID: 9118511.
20. Montano N, Porta A, Cogliati C, Costantino G, Tobaldini E, Casali KR, et al. Heart rate variability explored in the frequency domain: a tool to investigate the link between heart and behavior. Neurosci Biobehav Rev. 2009;33(2):71-80. doi: 10.1016/j.neubiorev.2008.07.006.
21. Fazan R Jr, de Oliveira M, da Silva VJ, Joaquim LF, Montano N, Porta A, et al. Frequency-dependent baroreflex modulation of blood pressure and heart rate variability in conscious mice. Am J Physiol Heart Circ Physiol. 2005;289(5):H1968-75. doi: 10.1152/ajpheart.01224.2004.
22. Lucini D, Norbiato G, Clerici M, Pagani M. Hemodynamic and autonomic adjustments to real life stress conditions in humans. Hypertension. 2002;39(1):184-8. PMID: 11799100.
23. Pagani M, Lombardi F, Guzzetti S, Rimoldi O, Furlan R, Pizzinelli P, et al. Power spectral analysis of heart rate and arterial pressure variabilities as a marker of sympatho-vagal interaction in man and conscious dog. Circ Res. 1986;59(2):178-93. PMID: 2874900.
24. Friedewald WT, Levy RI, Fredrickson DS. Estimation of the concentration of low-density lipoprotein cholesterol in plasma, without use of the preparative ultracentrifuge. Clin Chem. 1972;18(6):499-502. PMID: 4337382.
25. Cohen J. A power primer. Psychol Bull. 1992;112(1):155-9. PMID: 19565683.
26. Imai Y, Abe K, Munakata M, Sakuma H, Hashimoto J, Imai K, et al. Circadian blood pressure variations under different pathophysiological conditions. J Hypertens Suppl. 1990;8(1):S125-32. PMID: 2095380.
27. Matteucci E, Giampietro O. Circadian rhythm of blood pressure in diabetes mellitus: evidence, mechanisms and implications. Curr Diabetes Rev. 2012;8(5):355-61. PMID: 22698080.
28. Spallone V, Bernardi L, Maiello MR, Cicconetti E, Ricordi L, Fratino P, et al. Twenty-four-hour pattern of blood pressure and spectral analysis of heart rate variability in diabetic patients with various degrees of autonomic neuropathy. Comparison to standard cardiovascular tests. Clin Sci (Lond). 1996;91 Suppl:105-7. PMID: 8813845.
29. Spallone V, Bernardi L, Ricordi L, Soldà P, Maiello MR, Calciati A, et al. Relationship between the circadian rhythms of blood pressure and sympathovagal balance in diabetic autonomic neuropathy. Diabetes. 1993;42(12):1745-52. PMID: 8243821.
30. Chessa M, Butera G, Lanza GA, Bossone E, Delogu A, De Rosa G, et al. Role of heart rate variability in the early diagnosis of diabetic autonomic neuropathy in children. Herz. 2002;27(8):785-90. doi: 10.1007/s00059-002-2340-4.
31. May O, Arildsen H. Simple function tests for autonomic neuropathy have a higher predictive value on all-cause mortality in diabetes compared to 24-h heart rate variability. J Diabetes Complications. 2012;26(3):246-50. doi: 10.1016/j.jdiacomp.2012.03.004.
32. Forbes JM, Cooper ME. Mechanisms of diabetic complications. Physiol Rev. 2013;93(1):137-88. doi: 10.1152/physrev.00045.2011.
33. O’Brien E, Asmar R, Beilin L, Imai Y, Mancia G, Mengden T, et al; European Society of Hypertension Working Group on Blood Pressure Monitoring. Practice guidelines of the European Society of Hypertension for clinic, ambulatory and self blood pressure measurement. J Hypertens. 2005;23(4):697-701. PMID: 15775768.
34. Asayama K, Kikuya M, Schutte R, Thijs L, Hosaka M, Satoh M, et al. Home blood pressure variability as cardiovascular risk factor in the population of Ohasama. Hypertension. 2013;61(1):61-9. doi: 10.1161/ HYPERTENSIONAHA.111.00138.
35. Zhang Y, Agnoletti D, Safar ME, Blacher J. Effect of antihypertensive agents on blood pressure variability: the Natrilix SR versus candesartan and amlodipine in the reduction of systolic blood pressure in hypertensive patients (X-CELLENT) study. Hypertension. 2011;58(2):155-60. doi: 10.1161/HYPERTENSIONAHA.111.174383.
36. Ko SH, Song KH, Park SA, Kim SR, Cha BY, Son HY, et al. Cardiovascular autonomic dysfunction predicts acute ischaemic stroke in patients with Type 2 diabetes mellitus: a 7-year follow-up study. Diabet Med. 2008;25(10):1171-7. doi: 10.1111/j.1464-5491.2008.02567.x.
37. Pappachan JM, Sebastian J, Bino BC, Jayaprakash K, Vijayakumar K, Sujathan P, et al. Cardiac autonomic neuropathy in diabetes mellitus: prevalence, risk factors and utility of corrected QT interval in the ECG for its diagnosis. Postgrad Med J. 2008;84(990):205-10. doi: 10.1136/pgmj.2007.064048.
38. Leiria L, Ledur M, Severo MD, Becker A, Aguiar D, Massierer D, et al. Office hypertension and masked hypertension and their association with left ventricular hypertrophy and diastolic dysfunction in patients with type 2 diabetes and hypertension. In: 15th International & 14th European Congress of Endocrinology (ICE/ECE 2012), 05-09 May, 2012; Florence (Italy). Endocrine Abstracts; 2012;29:P652.