Re fe re nce value s fo r lung functio n
te sts. II. Maxim al re spirato ry
pre ssure s and vo luntary ve ntilatio n
1Department of Physiology, St. George’s Hospital Medical School,
University of London, London, UK
2Departamento de Medicina Preventiva e Social and 3Disciplina de Pneumologia, Departamento de Medicina,
Escola Paulista de Medicina, Universidade Federal de São Paulo, São Paulo SP, Brasil
J.A. Neder1,
S. Andreoni2,
M.C. Lerario2
and L.E. Nery3
Abstract
The strength of the respiratory muscles can be evaluated from static measurements (maximal inspiratory and expiratory pressures, MIP and MEP) or inferred from dynamic maneuvers (maximal voluntary ventilation, MVV). Although these data could be suitable for a num-ber of clinical and research applications, no previous studies have provided reference values for such tests using a healthy, randomly selected sample of the adult Brazilian population. With this main purpose, we prospectively evaluated 100 non-smoking subjects (50 males and 50 females), 20 to 80 years old, selected from more than 8,000 individuals. Gender-specific linear prediction equations for MIP, MEP and MVV were developed by multiple regression analysis: age and, secondarily, anthropometric measurements explained up to 56% of the variability of the dependent variables. The most cited previous studies using either Caucasian or non-Caucasian samples systematically underestimated the observed values of MIP (P<0.05). Interestingly, the self-reported level of regular physical activity and maximum aerobic power correlates strongly with both respiratory and peripheral muscular strength (knee extensor peak torque) (P<0.01). Our results, therefore, provide a new frame of reference to evaluate the normalcy of some useful indexes of respiratory muscle strength in Brazilian males and females aged 20 to 80.
Co rre spo nde nce
L.E. Nery
Disciplina de Pneumologia EPM, UNIFESP
Rua Botucatu, 740, 3º andar
04023-062 São Paulo, SP Brasil
Fax: + 55-11-570-2127 E-mail: lenery@ pneumo.epm.br
Research partially supported by CNPq and FAPESP. J.A. Neder was
the recipient of a post-doctoral fellowship from FAPESP (No. 95/9843-0).
Received April 23, 1998
Accepted January 13, 1999
Ke y wo rds
·Respiratory muscle strength ·Maximal voluntary
ventilation
·Pulmonary function tests
Intro ductio n
Ventilation plays a key role in the ad-equacy of the external gas exchange, the ultimate lung function. The appropriateness of the ventilatory pump response to a given metabolic load, however, is intrinsically linked to the ability of the force-generator units (i.e., the respiratory muscles, RM) to provide the required output. RM strength can
MVV is the largest volume that can be ven-tilated during a 10- to 15-s interval with voluntary effort (1).
These relatively simple and inexpensive measurements, apart from having a role in the diagnosis and prognosis of a number of neuromuscular and pulmonary disorders, have been associated with health status, physical fitness and even post-surgical and general morbidity-mortality (1-3). Reference values from these important measures, as for most biological variables, should ideally de-rive from a randomly selected, geographi-cally related population in an attempt to improve both accuracy and predictive power. Without this, the interpretation of the test results could be hampered and prone to mis-interpretation (4). To the best of our knowl-edge, however, there is no published source of reference values for such variables which have been obtained from a sample of the general population of Brazil. Therefore, the purpose of this prospective study was to establish a set of predictive equations for MIP, MEP and MVV for a randomized sample of urban adult Brazilians. In addition to the typical demographic and anthropo-metric variables, this study evaluated the relationship of physical fitness (aerobic power and the level of regular physical activ-ity) with these indexes of respiratory muscle strength.
Mate rial and Me tho ds
Study de sign and subje cts
The exclusion criteria and the ethnic, demographic, anthropometric, spirometric and regular physical activity profile of the population evaluated was previously de-scribed in detail (5).
Pro to co l
The subjects were submitted to the de-signed protocol in the morning of the same
day, and at least 3 h after the last meal and 12 h after significant exertion, following this sequence: a) complete clinical, hematologic and cardiorespiratory evaluation at rest; b) evaluation of the regular physical activity pattern by a questionnaire (6); c) determina-tion of MIP and MEP and MVV; d) spirom-etry and static lung volume measurements; e) determination of the lung diffusion capac-ity for carbon monoxide (see Ref. 7), and f) cardiopulmonary exercise tests on a cycle ergometer (a square-wave protocol at 25 W for subject familiarization and, after 1 h, a maximal ramp-incremental exercise test). On a different day, g) total and regional body composition was evaluated by dual energy X-ray absorptiometry (DEXA) and h) knee strength measured by isokinetic dynamom-etry. A detailed description of the techniques cited in items a, b, d, f, g and h was previ-ously given (5).
Before the tests, the procedures, includ-ing the known risks, were described in de-tail, and written informed consent (as ap-proved by the Institutional Medical Ethics Committee) was obtained from all subjects. The subjects did not receive remuneration.
Maximal vo luntary ve ntilatio n
after flow integration, the highest value was recorded by extrapolating the 15-s accumu-lated volume to 1-min (l/min, body tempera-ture, ambient pressure, saturated with water vapor - BTPS).
Maxim al re spirato ry pre ssure s
Maximal inspiratory pressure followed by maximal expiratory pressure was obtained from residual volume and total lung capac-ity, with the subjects seated wearing nose clips and with a rigid, plastic flanged mouth-piece in place. The subjects were connected to a manual shutter apparatus with the maxi-mal pressures measured using a manometer, aneroid-type gauge (± 300 cmH2O) (Imebrás, São Paulo, SP, Brazil). The trans-ducer output was regularly compared with that from the Valydine MP45-1 pressure transducer using the mechanical recording system of a Beckman R-414 polygraph. A small leak was introduced between the oc-clusion and the mouth in order to prevent glottic closure and in addition the subjects held their cheeks with one hand during the maneuver. Inspiratory or expiratory effort was sustained for at least 1 s. The measure-ments were made by two designated techni-cians who always first explained and
dem-onstrated the correct maneuver. The subjects performed three to five acceptable and re-producible maximal maneuvers (i.e., differ-ences of 10% or less between values): the recorded value was the highest unless this was obtained from the last effort (1,2,4). An interval of about 1 min was allowed to elapse between efforts.
D ata analysis
The statistical approach used for data analysis (8-10) was also previously described in detail (5).
Re sults
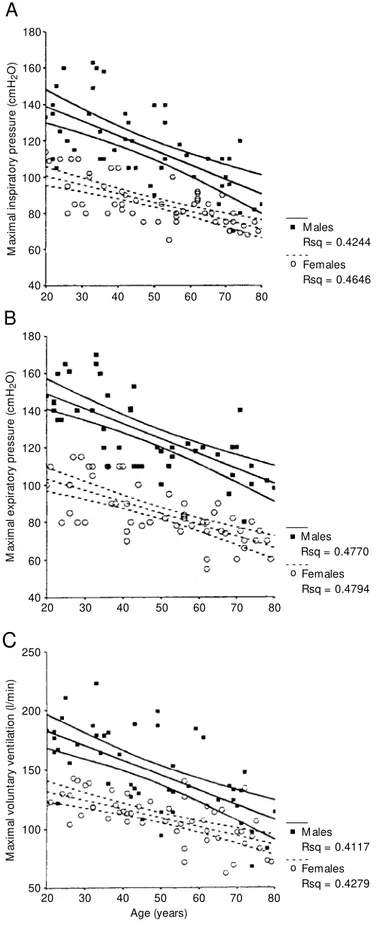
Descriptive statistics of the data are shown in Table 1: age-matched males presented higher values than females for all of the variables studied and a significantly nega-tive effect of age was found (P<0.05) (Figure 1). On the other hand, height, weight, lean body mass and regular level of physical ac-tivity showed a significant positive relation-ship (Table 2). When these variables were considered in a multiple regression analysis, only gender and age continued to have an independent predictive role for the three de-pendent variables (Table 3). In addition, in
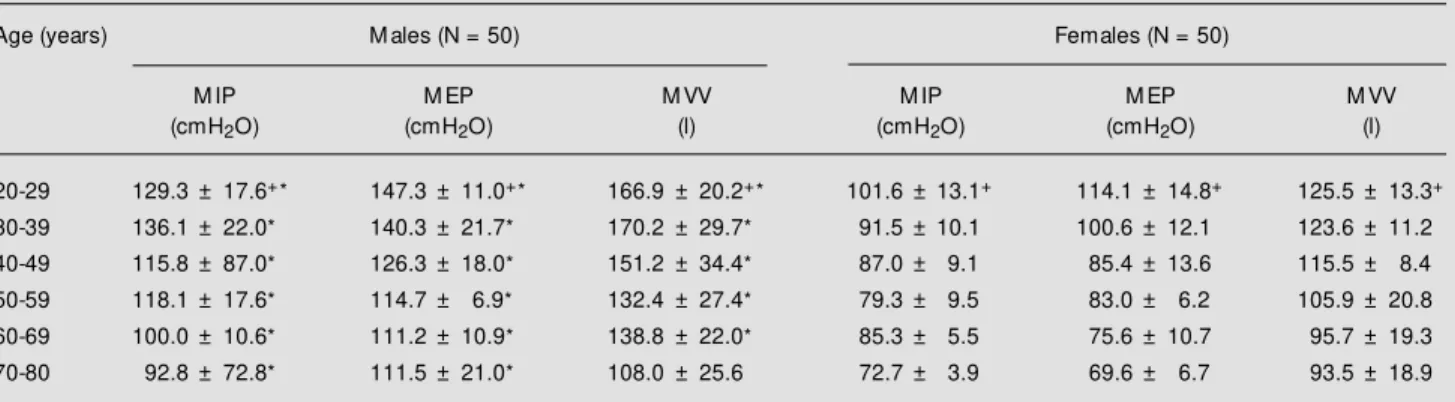
Table 1 - M aximal respiratory pressures and voluntary ventilation in males and females by age group.
M IP = M aximal inspiratory pressure; M EP = maximal expiratory pressure; M VV = maximal voluntary ventilation. Data are reported as mean ± SD.
+Significant effect among age groups w ithin sex (P<0.05); 20-29 age group vs 40-49, 60-69 and 70-80 groups. *Significant effect betw een sex
groups (P<0.05); males vs females by age-group.
Age (years) M ales (N = 50) Females (N = 50)
M IP M EP M VV M IP M EP M VV
(cmH2O) (cmH2O) (l) (cmH2O) (cmH2O) (l)
20-29 129.3 ± 17.6+* 147.3 ± 11.0+* 166.9 ± 20.2+* 101.6 ± 13.1+ 114.1 ± 14.8+ 125.5 ± 13.3+
30-39 136.1 ± 22.0* 140.3 ± 21.7* 170.2 ± 29.7* 91.5 ± 10.1 100.6 ± 12.1 123.6 ± 11.2
40-49 115.8 ± 87.0* 126.3 ± 18.0* 151.2 ± 34.4* 87.0 ± 9.1 85.4 ± 13.6 115.5 ± 8.4
50-59 118.1 ± 17.6* 114.7 ± 6.9* 132.4 ± 27.4* 79.3 ± 9.5 83.0 ± 6.2 105.9 ± 20.8
60-69 100.0 ± 10.6* 111.2 ± 10.9* 138.8 ± 22.0* 85.3 ± 5.5 75.6 ± 10.7 95.7 ± 19.3
the male group, weight was also a predictor of MIP and height of MVV. The other more complex measurements did not continue to show independent predictive power for MIP, MEP and MVV when these simpler vari-ables were considered in the multiple regres-sion (Table 3).
Direct comparison of equations from the most cited previous studies using both Cau-casian (11-13) and non-CauCau-casian samples (14) showed that they systematically under-estimated the observed values of MIP in both sexes (P<0.05; Figure 2). Additionally, after application of the predicted residual sum of squares (PRESS) method to the lin-ear regression equations, we found only a mild effect in the Rand standard error of the estimate (SEE) original values (RPRESS
rang-ing from 0.018-0.038 units below original R and SEEPRESS values being 3-6% higher
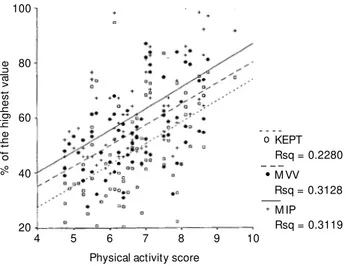
than the original SEE values (data not shown). Interestingly, we found a significant posi-tive linear association between both periph-eral (knee extensor peak torque) and respira-tory muscle strength (MIP, MEP, MVV) and the physical activity score, independent of gender or age (Figure 3). In addition, a simi-lar result was obtained with regard to the peak aerobic power - V. O2max (Table 2).
As previously reported (15), MVV was closely related to forced expiratory volume in 1 s (FEV1) in an effectively linear fashion with a positive intercept (R2 = 0.817),
al-though we found a different slope value
M a x im a l in s p ir a to ry p re s s u re ( c m H2 O ) 180 M ales Rsq = 0.4244
Females Rsq = 0.4646 160
120
100
80
40
30 50 60 70 80
A
140 60 40 20 M a x im a l e x p ir a to ry p re s s u re ( c m H2 O ) 180 M ales Rsq = 0.4770Females Rsq = 0.4794 160
120
100
80
40
30 50 60 70 80
B
140 60 40 20 M a x im a l v o lu n ta ry v e n ti la ti o n ( l/ m in ) 250 M ales Rsq = 0.4117Females Rsq = 0.4279 150
50
30 50 60 70 80
200 100 40 20 Age (years)
C
Figure 1 - M aximal inspiratory pressure (M IP) (A), expi-ratory pressure (M EP) (B) and voluntary ventilation (M VV) (C) as a function of age in 100 healthy sedentary subjects. Regression lines are presented w ith the cor-responding 95% confidence limits (CL).
M IP: M ales: y = -0.80 (age) + 155.3, SEE = 17.3; Females: y = -0.49 (age) + 110.4, SEE = 9.1.
M EP: M ales: y = -0.81 (age) + 165.3, SEE = 15.6; Females: y = -0.61 (age) + 115.6, SEE = 11.2. M VV: M ales: y = -1.12 (age) + 199.1, SEE = 27.5; Females: y = -0.76 (age) + 147.4, SEE = 15.3. All regressions w ere statistically significant at P<0.01. Rsq is the coefficient of determination.
o
o
Table 2 - Correlation matrix.
LBM = Lean body mass; PAS = physical activity score; V. O2max = maximum oxygen uptake; M IP = maximal inspiratory pressure; M EP = maximal
expiratory pressure; M VV = maximal voluntary ventilation. * P<0.05. * * P<0.01.
Age Height Weight LBM PAS V. O2max Leg strength M IP M EP M VV
Age 1.00
Height -0.22* 1.00
Weight -0.01 0.54* * 1.00
LBM -0.24* 0.79* * 0.84* * 1.00
PAS -0.28* * 0.38* * 0.23* 0.42* * 1.00
V. O2max -0.61* * 0.67* * 0.50* * 0.77* * 0.58* * 1.00
Leg strength -0.71* * 0.71* * 0.46* * 0.79* * 0.47* * 0.86* * 1.00
M IP -0.54* * 0.49* * 0.36* * 0.66* * 0.47* * 0.81* * 0.76* * 1.00
M EP -0.51* * 0.59* * 0.49* * 0.70* * 0.46* * 0.85* * 0.79* * 0.85* * 1.00
M VV -0.56* * 0.63* * 0.38* * 0.67* * 0.48* * 0.81* * 0.81* * 0.67* * 0.72* * 1.00
P
re
d
ic
a
te
d
M
IP
(
c
m
H2
O
)
160
140
120
100
80
40
20 60
Figure 2 - Observed and pre-dicted values of maximal inspira-tory pressure (M IP) reported in the present study and in the most cited previous studies (11-14). Note that these studies un-derestimatedthe observed val-ues in both males and females (P<0.05).
0
P
re
d
ic
a
te
d
M
IP
(
c
m
H2
O
)
120
100
80
60
40
0 20
0 20 40 60 80 100 120 140 160
Observed M IP (cmH2O)
0 20 40 60 80 100 120
Observed M IP (cmH2O)
Table 3 - Linear prediction equations for maximal inspiratory pressure (M IP), expiratory pressure (M EP) and voluntary ventilation (M VV) in males (M ) and females (F) aged 20 to 80.
Values in the columns represent coefficient estimates follow ed by the respective standard error of the estimate. R2 = Coefficient of
determination; RSE = residual standard error.
Variable Sex Age (years) Height (cm) Weight (kg) Constant R2 RSE
M IP (cmH2O) M -0.80 ± 0.13 - 0.48 ± 0.22 119.7 ± 17.9 0.479 16.7
F -0.49 ± 0.07 - - 110.5 ± 3.9 0.465 9.1
M EP (cmH2O) M -0.81 ± 0.12 - - 165.3 ± 6.3 0.477 15.6
F -0.62 ± 0.09 - - 115.7 ± 4.8 0.479 11.2
M VV (l/min) M -1.06 ± 0.19 2.15 ± 0.53 - -164.6 ± 93.3 0.567 23.7
F -0.76 ± 0.12 - - 47.4 ± 6.6 0.428 15.3
M ales Females
the previously suggested single cutoff (0.80) (16), i.e., 0.87 for males and 0.77 for females (Figure 5).
D iscussio n
This study is the second communication in a sequence of descriptions of reference values for lung function tests (other than spirometry) which were obtained in a care-fully randomly selected sample (5). This experiment provides the first set of predic-tive equations for some clinically useful in-dexes of muscular respiratory strength ob-tained for a randomly selected sample of healthy adult Brazilians. We found that age and, secondarily, anthropometric measure-ments were able to explain up to 56% of the variability of the dependent variables. Inter-estingly, previous studies using either Cau-casian or non-CauCau-casian samples underesti-mated the observed values of MIP (P<0.05), the most used index of maximal respiratory strength (1-3). These results demonstrate the practical importance of considering refer-ence values for lung function tests which are obtained from a racially, ethnically and geo-graphically related population (4).
Age was the strongest negative correlate with the studied dependent variables (Table 2, Figure 1). The aging process is associated with a reduction in the total, diaphragmatic and respiratory accessory muscular mass, as well as with a decline in the work output for a same level of neural stimulation (13). In-creased compliance of the abdominal com-partment in older subjects can dissipate the generated pressure, notably in the forced expiration, reducing the maximal static pres-sures. Additionally, as we demonstrated pre-viously in this sample, there is a mild reduc-tion in the total lung capacity and a marked increase in residual volume with age. Con-sidering that the highest values for MIP and MEP are generated in the lowest and the highest lung volumes, respectively, these physiological adaptations may also
contri-%
o
f
th
e
h
ig
h
e
s
t
v
a
lu
e
100
KEPT Rsq = 0.2280
M VV Rsq = 0.3128 80
40
20
5 7 8 9 10
60
6 4
M IP Rsq = 0.3119
Figure 3 - Positive correlation betw een physical activity score (6) and some indexes of muscular strength such as peripheral (knee extensor peak torque, KEPT) and respiratory (maximal voluntary ventilation, M VV and maximal inspiratory pressure, M IP) strength. P<0.001 for all corre-lations.
Physical activity score
Figure 4 - M aximal voluntary ventilation (M VV) w as closely correlated w ith the forced expiratory volume in 1 s (FEV1) but w ith a positive
y-intercept: M VV (l/min) = 37.5 (FEV1) + 15.8, R2 = 0.817, SEE = 15.
M
a
x
im
a
l
v
o
lu
n
ta
ry
v
e
n
ti
la
ti
o
n
(
l/
m
in
)
250
200
0
1 3 4 5 6
150
2 0
FEV1 (l)
100
50
(37.5) than previously described (Figure 4). Finally, the minute ventilation at maximal cycle ergometry (V.Emax) was lower than the MVV in all subjects, and these values were higher in males independent of age: the gender-specific upper 95% confidence in-terval of the predicted values for the V.Emax/ MVV ratio was, therefore, at variance with
+
bute to the age-associated decline in MIP and MEP. On the other hand, weight was a positive predictor of MIP but only in males (Table 3). This finding may be anticipated considering the closer relationship between total and lean body mass (LBM) in males than in females, and the stronger relation-ship between MIP and LBM (Table 2).
The MVV is a test of the overall function of the respiratory system. It is influenced not only by RM strength, but also by the compli-ance of the lung-thorax system, the condi-tion of the ventilatory control systems and the resistance of both airways and tissues. Apart from the reduction in RM strength (Figure 1, Tables 1 to 3), aging is associated with reductions in the compliance of the chest wall and an increase in both the resis-tive and elastic work of breathing (13). It is important, therefore, to recognize that MVV was used in this study only as an indirect index of RM strength and these other factors should also be considered in the analysis of the results. In addition, we obtained two original results with practical implications: i) the indirect estimation of MVV from FEV1 (x 37.5) should include a positive intercept (15 l) (Figure 4), and ii) the widely used single cutoff employed to suggest ventila-tory limitation to dynamic exercise (V.Emax/ MVV ratio above 0.8) should also take gen-der into account (95% upper confidence limit of 0.87 for males and 0.77 for females; Fig-ure 5). Obviously, these findings have im-portant implications for the exercise-based diagnostic process.
One of the most remarkable findings of the present study was the degree of underes-timation of the observed MIP values by pre-viously published equations for a sample with a minority of Caucasian subjects (11-14). This finding was unexpected due to the traditional notion that non-white, non-Cau-casian populations present lower values for most tests of the different aspects of lung function (4). A biased selection in the pres-ent population can be ruled out by the
care-ful randomization procedure applied and, in addition, this sample was highly unfit and sedentary. Ethnic aspects based on differ-ences in sitting height, arm span, chest wall geometry or degree of muscularity of the primary and secondary respiratory muscles could be considered, but unfortunately we are not aware of any systematic comparison among these variables in different ethnic groups and races. Another important aspect that impairs any direct comparison among studies is the relative non-standardization of these highly effort-dependent tests. Previous investigators used different techniques, par-ticularly the type of mouthpiece used. We used a flanged mouthpiece, which is more commonly used in pulmonary function labo-ratories, but this is unlikely to contribute to the discrepancy since lower values were ob-served with the use of this kind of mouth-piece compared to a rubber tube (17). In addition, as cited in Methods, systematic measurement errors are also unlikely since the output of the device was regularly checked against a highly sensitive differential pres-sure transducer. Another reasonable hypoth-esis to account for these discrepancies could
V
. Em
a
x
/M
V
V
1.0
M ales 0.9
0.6
30 50 60 70 80
0.8
40 20
Age (years) 0.5
0.4
0.3 0.7
Females
Figure 5 - The ventilatory stress at maximum cycle ergometry (V.Emax/M VV ratio) w as low er than one in all subjects, independ-ent of gender. M ales show ed higher values than females (w ith an upper 95% confidence limit of 0.87 and 0.77, respectively), but no effect of age w as found (P<0.05)
be a lower end-expiratory level attained by our subjects prior to the inspiration. In the previous communication (5), however, we were not able to find a systematic low value of residual volume or end-expiratory lung volume in either sex. On the other hand, in a non-randomized study involving a smaller Brazilian sample (30M/30F, aged below 50 years), Camelo Jr et al. (18), using a similar device, described higher values for MIP in males and MEP in both sexes as compared to our study. Whether these discrepancies could be associated with the non-randomized de-sign of the previous evaluation and/or differ-ences in muscularity is presently unknown: unfortunately, a direct comparison between studies was not feasible since these authors did not develop regression equations. Fur-ther work, Fur-therefore, is required to evaluate specifically the possible determinants of this rather unexpected finding of the present study.
Another interesting finding was the sig-nificant linear relationship between periph-eral or respiratory muscle strength and the regular level of physical activity and V.O2max (Table 2, Figure 3). This occurred even though all of the studied subjects were con-sidered to be untrained (6); however, as ex-pected, we found a considerable range of values in the regular physical activity scores (Figure 3). There was, undoubtedly, a high level of multi-colinearity in the above-men-tioned analysis. The fact that the younger, taller, leaner and more active males pre-sented also higher values of muscular strength does not necessarily represent a cause-effect relationship. However, there is now growing evidence that whole-body dynamic exercise training is associated with an increase in both peripheral and respiratory muscle strength and endurance capacity (19,20).
Therefore, we could not entirely rule out the hypothesis that this result reflects the benefi-cial effect of regular physical activity on ventilatory pump performance.
In summary, we have presented the first set of predictive equations for static respira-tory pressures (MIP and MEP) and MVV in a randomized sample of adult Brazilians. Our results can be applied in clinical and research situations to evaluate the adequacy of these useful indexes of respiratory muscle strength in males and females aged 20 to 80. These equations, however, should be vali-dated further in other samples of the adult Brazilian population.
Ackno wle dgm e nts
Re fe re nce s
1. Ruppel G (1994). Lung volume tests. In: Ruppel G (Editor), M anual of Pulmonary Function Testing. 6th edn. M osby, St. Louis, 1-25.
2. Celli BR (1989). Clinical and physiological evaluation of respiratory muscle function. Clinics in Chest M edicine, 10: 199-214. 3. Arora NS & Rochester DF (1982).
Respira-tory muscle strength and maximal volun-tary ventilation in undernourished pa-tients. American Review of Respiratory Diseases, 126: 5-8.
4. American Thoracic Society (1991). Lung function testing. Selection of reference values and int erpret at ive st rat egies. Am erican Review of Respiratory Dis-eases, 144: 1202-1218.
5. Neder JA, Andreoni S, Castelo-Filho A & Nery LE (1999). Reference values for lung function tests. I. Static volumes. Brazilian Journal of M edical and Biological Re-search, 32: 703-717.
6. Baecke JAH, Burema J & Frijters JER (1982). A short questionnaire for the measurement of habitual physical activity in epidemiological studies. American Jour-nal of Clinical Nutrition, 36: 936-942. 7. Neder JA, Andreoni S, Peres C & Nery LE
(1999). Reference values for lung func-tion tests. III. Carbon monoxide diffusing capacity (transfer factor). Brazilian Journal of M edical and Biological Research, 32:
729-737.
8. Statistical Package for Social Sciences (SPSS, IBM +) (1990). Version 6.20.1. 9. Kleinbaum DG, Kupper LL & M uller AE
(1988). Applied Regression Analysis and Other M ultivariable M ethods. 2nd edn. Duxbury Press, Belmont.
10. Holiday DB, Ballard JE & M cKeow n BC (1995). PRESS-related statistics: regres-sion tools for cross-validation and case diagnostics. M edicine and Science in Sports and Exercise, 27: 612-620. 11. Black LF & Hyatt RE (1969). M aximal
res-piratory pressures: normal values and re-lationship to age and sex. American Re-view of Respiratory Diseases, 99: 696-702.
12. Wilson SH, Cooke NT, Edw ards RHT & Spiro SG (1984). Predicted normal values for maximal respiratory pressures in Cau-casian adults and children. Thorax, 39: 535-538.
13. Enright PL, Kronm al R, M anollo TA, Schenker M B & Hyatt RE (1994). Respira-tory muscle strength in the elderly: corre-lates and reference values. American Journal of Respiratory and Critical Care M edicine, 149: 430-438.
14. Johan A, Chan CC, Chia HP, Chan OY & W ang YT (1997). M aximal respiratory pressures in adult Chinese, M alays and Indians. European Respiratory Journal, 10:
2825-2828.
15. Campbell SC (1982). A comparison of the m axim um volunt ary vent ilat ion w it h forced expiratory volume in one second: an assessment of subject cooperation. Journal of Occupational M edicine, 24: 531-533.
16. Hansen JE, Sue DY & Wasserman K (1984). Predicted values for clinical exer-cise testing. American Review of Respira-tory Diseases, 129 (Suppl): S49-S55. 17. Koulouris N, M ulvey DA, Laroche CM ,
Green M & M oxhan J (1988). Comparison of tw o different mouthpieces for the measurement of PImax and PEmax in nor-mal and w eak subjects. European Respi-ratory Journal, 1: 863-867.
18. Camelo Jr JS, Terra Fo JT & M anço JC (1985). M aximal respiratory pressures in normal adults. Jornal de Pneumologia, 11: 181-184.
19. Leith DE & Bradley M (1978). Ventilatory muscle strength and endurance training. Journal of Applied Physiology, 41: 508-516.