Selection of plum cultivars for subtropical regions
Seleção de cultivares de ameixeira para regiões subtropicais Rafael Pio1 Daniela da Hora Farias1* Flávio Gabriel Bianchini1
Pedro Maranha Peche1 Rayane Barcelos Bisi1
ISSNe 1678-4596
INTRODUCTION
Plums (Prunus sp.), similarly as peaches, are native fruit trees from temperate climates and have the dormancy mechanism as a way to adapt to the cold regions (OLIVEIRA et al., 2011). In Brazil, Prunus fruits are grown from the coldest areas of the state of Rio Grande do Sul to the mild winter regions of south of the state of Minas Gerais (SOUZA et al., 2017).
The plums require specific weather
conditions in order to perform their proper
development and flowering. Some cultivars are
adapted to subtropical regions, but the number of cultivars commercially exploited is still scarce,
especially due to the lack of competition from cultivars for subtropical regions.
It is worth mentioning that the use of Prunus cultivars adapted to mild winter regions makes it possible to harvest the fruits in lesser supply periods (BARBOSA et al., 2010; OLIVEIRA et al., 2011). This happens because harvesting of fruits in southeastern Brazil occurs earlier in relation to the traditional producing regions from the states of Rio Grande do Sul and Santa Catarina (ARAÚJO et al., 2008). Such early harvest period is due to the warmer winter with higher temperatures after the end of dormancy period, which allows pruning and sprouting with chemical products still in winter as there is no risk of late frosts (BETTIOL NETO et al., 2014).
1Departamento de Agricultura, Universidade Federal de Lavras (UFLA), 37200-000, Lavras, MG, Brasil. E-mail: dhorafarias@gmail.com. *Corresponding author.
ABSTRACT: Plum growing is widespread in temperate zones. In Brazil, the exploitation of this fruit tree is extended from the colder regions of the state of Rio Grande do Sul to the south of the state of Minas Gerais. However, cultivars exploited at subtropical regions are scarce due to competition. The present study aimed to select productive cultivars of plums adapted to Brazilian subtropical conditions. In this respect, the plum cultivars ‘Fla 87-7’, ‘Gema de Ouro’, ‘Grancoure’, ‘Harry Pickstone’, ‘Januária’, ‘Santa Rosa’ and ‘Satsuma’ were grafted on the ‘Okinawa’ rootstock ‘and evaluated by two cycles in the municipality of Lavras, MG, Brazil. The phenological development, physical and chemical properties of fruits, average number of fruits per plant, average fruit mass and estimated yield were evaluated for each cultivar. It is concluded that plum cultivars ‘Januária’ and ‘Grancoure’ are the most promising for subtropical regions, mainly due to the volume of produced fruits and the quality of fruits.
Key words: Prunus salicina, phenology, yield.
RESUMO: O cultivo de ameixeira é amplamente difundido nas zonas temperadas. No Brasil, a exploração desta fruteira se estende desde as regiões mais frias do Rio Grande do Sul até o sul de Minas Gerais. No entanto, as cultivares exploradas nas regiões subtropicais são escassas devido a trabalhos de competição. O presente trabalho objetivou-se selecionar cultivares produtivas de ameixas e adaptadas às condições subtropicais brasileiras. Para isso, foram utilizadas as ameixeiras ‘Fla 87-7’, ‘Gema de Ouro’, ‘Grancoure’, ‘Harry Pickstone’, ‘Januária’, ‘Santa Rosa’ e ‘Satsuma’, enxertadas sobre o porta-enxerto ‘Okinawa’ e avaliadas por dois ciclos no município de Lavras, MG. Avaliou-se o desenvolvimento fenológico; atributos físico-químicos das frutas; número médio de frutas por planta; massa média das frutas e produtividade estimada em cada cultivar. Conclui-se que as ameixeiras ‘Januária’ e ‘Grancoure’ são as mais promissoras para regiões subtropicais, principalmente, pelo volume de frutas produzidas e qualidade das frutas.
Palavras-chave: Prunus salicina, fenologia, produtividade.
2 Pio et al.
Fruit productive capacity and fruit quality are associated with several factors, primarily the plant’s genetic potential, management, and interaction between biotic and edaphoclimatic factors. Moreover, fruit quality is determined based on the evaluation of different characteristics, especially the phenology
of flowering and fruit yield, quality and fruit yield
(BETTIOL NETO et al., 2014; CURI et al., 2015). In this sense, the objective was to select plum cultivars adapted to the edaphoclimatic conditions of the subtropical regions.
MATERIALS AND METHODS
The experiment was performed in a typical subtropical climate during the years 2015 and 2016. The site is at geographic coordinates 21º14’ S, 45º00’
W and 841 m altitude, classified as Cwa climate, i.e.,
subtropical climate, with cold and dry winter, and hot and wet summer (ALVARES et al., 2013).
Seven plum cultivars were used: ‘Fla 87-7’, ‘Gema de Ouro’, ‘Grancoure’, ‘Harry Pickstone’, ‘Januária’, ‘Santa Rosa’, and ‘Satsuma’, grafted on the ‘Okinawa’ peach.Planting was performed in January 2011, spaced 5m between rows and 3m between plants (population density of 667 plants per ha). The experimental design was complete randomized blocks in the factorial design of split-plot in time, being seven cultivars and two crop cycles, with three blocks composed by two plants each. The plant canopies were conducted in an “open vase” system, maintaining four main strands in the formation of plants. The dormancy breaking of gems with 0.25% hydrogen cyanamide associated with 3% mineral oil was performed at the end of May.
Throughout the experimental phase, the maximum and minimum daily temperatures and rainfall were collected during the years 2015 and 2016. Since the beginning of pruning, the time elapsed for the phenophases between the cultivars was recorded, in which the following phenological
aspects were evaluated: beginning of flowering (5% open flowers) and end of flowering (at least 95% of open flowers), beginning and end of the harvest. At the end, the flowering and harvest duration
were calculated, considering the chronological difference between the beginning and the end of these events.
The average number of fruits per plant, yield (kg plant-1) and estimated productivity (kg ha-1) were
evaluated during two consecutive crop cycles (2015 and 2016). The harvest was performed every seven
days, counting the number of fruits, and then weighing them with the aid of a semi-analytical balance. At the
end of the crop cycle, all the masses recorded fin order
to determine the yield per plant and then calculated the estimated productivity by multiplying the yield by the population density (667 plants ha-1).
The post-harvest evaluations were performed only in 2016 from four samples containing seven fruits of each cultivar. The fresh mass was evaluated with the aid of a semi-analytical balance (g), diameter and average fruit length (mm) with the aid of a digital caliper; titratable acidity (TA), obtained by diluting 10mL of juice in 90mL of distilled water and titration with 0.1N sodium hydroxide solution (NaOH) until pH 8.1 (turning point) was reached, and results expressed as rate (%) of citric acid; soluble solids (SS), determined with the aid of a digital refractometer with automatic temperature compensation and the results measured in Brix; and the SS/TA ratio, obtained through the quotient between the two variables.
The data were submitted to analysis of variance and the averages were compared by Tukey test at 5% probability of error. Furthermore, principal component analysis was used with the aid of the Genes statistical software (CRUZ, 2013).
RESULTS AND DISCUSSION
During the first crop cycle, regional climatic
data recorded average minimum temperatures of 15.7°C, maximum of 27.4°C, and rainfall of 1,419mm. In the second crop cycle, average temperatures of 15.5ºC, maximum of 27.6ºC, and rainfall of 1,193mm (Figure 1) were observed.
In the first productive year (2015), plum
cultivars, Harry Pickstone, Fla 87-7, Januaria and
Gema de Ouro began to sprout at the end of the first
fortnight of June (Table 1). In the second productive year (2016), there was a delay in the onset of sprouting, possibly due to the climate, since in the second year the maximum temperatures in July and August were higher (Figure 1).
It was verified that the flowering of the
plum trees began from the second half of June in
the first year (Table 1). In the second productive
year, there was delay of the beginning of the
flowering for all cultivars evaluated in relation to the first year, concentrating between the end of July and the first fortnight of August, except for
the cultivar Januária, in which the emission of the
With respect to the duration of plum bloom, the cultivar Harry Pickstone stood out in the
first productive year (Table 1). However, the cultivars
Grancoure, Januária and Harry Pickstone presented
greater amplitude of flowering in the second year. Prolonged flowering period may not favor the
1 2 3
Figure 1 - Minimum and maximum average temperatures and accumulated rainfall for the crop cycles 2015 and 2016.
Table 1 - Phenological description - beginning of sprouting (BB), beginning of flowering (BF), duration of flowering (DF), beginning of harvest (BH) and duration of harvest (DH) of plum cultivars for subtropical regions, in the crop cycles 2015 and 2016.
Cultivars BB BF DF (days)* BH DH (days)*
---Productive year 2015---
Santa Rosa 30/06 25/06 27c 11/11 36ab
Harry Pickstone 10/06 17/06 47a 25/09 39a
Fla 87-7 10/06 17/06 45ab 25/09 29ab
Grancoure 26/06 20/06 28c 28/10 25b
Satsuma 06/07 20/06 32bc 18/11 38a
Januária 09/06 20/06 30c 04/11 11c
Gema de Ouro 12/06 20/06 25c 28/10 9c
CV % - - 22.5 - 28.1
---Productive year 2016---
Santa Rosa 15/08 09/08 42ab 28/11 35bc
Harry Pickstone 15/07 25/07 47a 19/10 40ab
Fla 87-7 20/07 25/07 44ab 19/10 51a
Grancoure 9/08 01/08 53a 23/10 34bc
Satsuma 25/08 09/08 39ab 30/01 45ab
Januária 15/08 25/08 48a 12/01 26c
Gema de Ouro 06/08 15/08 27c 05/01 10d
CV % - - 23.6 - 22.5
4 Pio et al.
development of cultivars due to greater exposure to climatic adversities, such as falls in temperatures and
water deficit (SOUZA et al., 2013).
Research performed by OLIVEIRA et al. (2011) in a high-altitude subtropical region evidenced that the majority of plum cultivars show
beginning of flowering at the end of August and end of flowering at the end of September. This difference
is possibly related to altitude; and although, the studies were also performed by the aforementioned author under subtropical conditions, the colder winter temperatures of the Mantiqueira Mountains promoted
later flowering in relation to the present study, which
was also evidenced by SOUZA et al. (2013).
During the annual plum cycle, flowering
is the most critical phase. Due to the gametophytic self-incompatibility of most Japanese cultivars, determined by the presence of a multi-allele locus containing the called S-alleles (TAKAYAMA; ISOGAI, 2005), there is a need for cultivation of compatible pollinator plants, appropriately arranged in the orchard (CASTRO et al., 2008) and with total
or partially synchronized flowering period (SAPIR et
al., 2004) to obtain satisfactory productivity. Thus,
taking into account the coincident flowering period,
the cultivars Grancoure and Harry Pickstone can be used as pollinators and Januaria as a commercial cultivar in productive plum orchards. It should be
noted that flowering times may vary depending
on the year, place, cultural dealings and, mainly, edaphoclimatic conditions.
The beginning of the harvest period in the
first productive year (Table 1), varied according to the
cultivar, with the earliest ones, Harry Pickstone and Fla 87-7, beginning the harvest in the second half of
September and the later, Satsuma, in the beginning of the second half of November. Early and late cultivars showed the same behavior in the second productive cycle, with harvesting beginning between the second fortnight of October and the second fortnight of January of the following year. This fact shows the adaptation of these cultivars to edaphoclimatic conditions in subtropical regions.
The temperatures recorded during the
winter were low and sufficient for the accumulation
of cold required by the plums (SIMONETTO et al., 2013). However, elevated temperatures occurred
during summer and autumn in the first evaluation
cycle, as well as precipitation variations in winter and spring (Figure 1). In winter conditions mild, cultivars from temperate regions may present great variability
from one cycle to another, in relation to the flowering
period (PETRI et al., 2008), which can be attributed to thermal instability during the winter period, characteristic of subtropical regions (BETTIOL NETO et al., 2011).
Regarding the physical quality of fruits (Table 2), it can be observed that the average fruit length ranged from 36.42mm for the cultivar ‘Harry Pickstone’ to 45.58mm for the cultivar ‘Januária’. The cultivars ‘Grancoure’, ‘Januária’ and ‘Gema de Ouro’ showed fruits with larger diameters. Nevertheless, the cultivars ‘Grancoure’ and ‘Gema de Ouro’ showed fruits with larger masses.
In relation to the chemical characteristics of fruits (Table 2), it was observed that the cultivar
‘Grancoure’ showed significant differences among the
studied cultivars regarding soluble solids (15.0 Brix). In contrast, the cultivar ‘Fla 87-7’ yielded fruits with
higher acidity. These results directly influenced the
Table 2 - Physical and chemical characteristics of fruits from different plum cultivars for subtropical region.
Cultivar Fruit length (mm) Fruit diameter (mm) Fruit mass (g) SS (Brixº) Acidity* Ratio
Santa Rosa 41.18ab 42.18abc 26.18b 9.30c 1.54ab 6.03c
Harry Pickstone 36.42bc 37.55c 28.50b 11.27cd 1.25bc 9.04ab
Fla 87-7 36.99bc 39.39bc 34.02ab 14.25ab 2.05a 7.06bc
Grancoure 40.70ab 43.38ab 42.57a 15.03a 1.08bc 14.21a
Satsuma 36.65bc 40.21abc 39.06ab 10.79cd 1.44b 7.62bc
Januária 45.58a 42.91ab 39.03ab 11.44bc 0.87c 13.24a
Gema de Ouro 39.67b 44.44a 44.46a 11.92bc 1.04bc 11.99ab
Average 38.85 40.96 35.02 11.62 1.32 9.53
CV % 4.9 4.5 13.5 9.2 15.2 21.5
ratio, since fruits from the cultivars ‘Grancoure’ and ‘Januária’ showed a better balance between the soluble solids and acidity ratio (Table 2). GONÇALVES et al. (2014) evaluated physical and chemical characteristics in different genotypes of nectarines, founding variations for the acidityindicating that this parameter
is highly influenced by the intrinsic characteristics to
the cultivars.
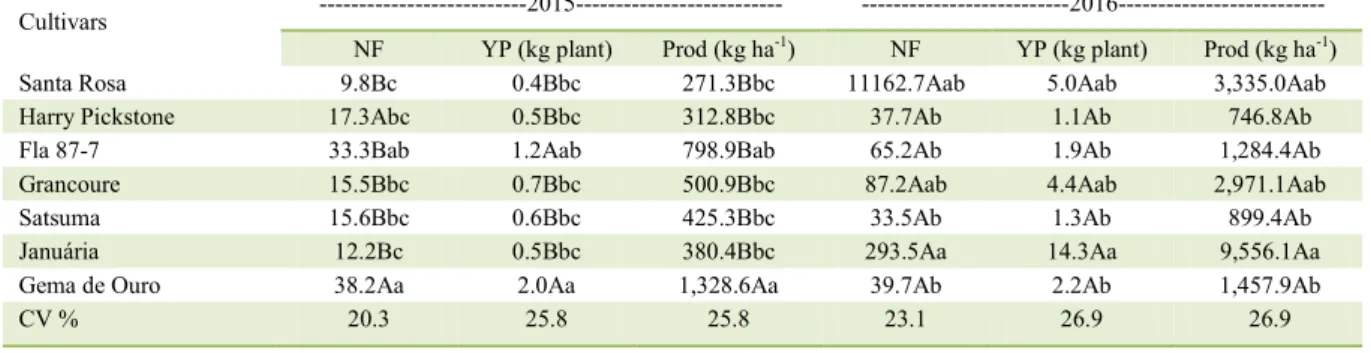
By comparing the cultivars for each crop cycle (Table 2), it can be observed that the ‘Gema
de Ouro’ significantly differed in relation to the other
cultivars for all productive variables analyzed in the
year 2015. For being the first crop year, the presented
results are considered below the average plum yield, corroborating with OLIVEIRA et al. (2011). In addition, the cultivars registered alternation of
production in the face of the marked water deficit
between July and September (Figure 1), which
possibly influenced the low caliber of the fruits and,
consequently, the low productivity.
For the second crop cycle, the ‘Januária’ stood out for showing the highest yield averages in relation to the other cultivars (Table 3), followed by ‘Santa Rosa’ and ‘Grancoure’. Conversely, the cultivars ‘Harry Pickstone’ and ‘Satsuma’ show the lowest yield averages. The yield increase in the 2016 crop cycle is probably related mostly to the cultivar’s adaptability to the soil and edaphoclimatic conditions from the subtropical region and the total or partially
synchronized flowering period of the cultivars.
In the principal component analysis, the first three components explained 84.87% of the total accumulated variance. The first component
(PC1) accounted by 52.08%, the second (PC2) by 21.36%, and third (PC3) by 11.44% (Table 4). The characteristics that most contributed to the components are those with higher weights in the principal components of eigenvalues. In contrast, the lower contribution are from those with higher eigenvectors in less eigenvalue components (CRUZ et al., 2004). Thereby, Table 4 shows that the first axis of the PC correlated mainly with fruit diameter (0.369) and fruit length (0.366), with 52.08% of the total variation. The second axis of PC, with 21.36% of total variation, was strongly correlated in module with soluble solids (-0.471) and fruit mass (-0.454). The chemical characteristic ratio (0.595) was strongly correlated with the third axis of the PC, which represented 11.44% of the total variation.
In general, the cultivars that showed
significant results for the analyzed variables can
be used in future crosses. The exploration of this variability can occur through the selection of plum
cultivars with cycle length significantly lower than
the other cultivars for crosses between individuals that stood out with larger fruits, soluble solids and number of fruits per plant in order to combine favorable characteristics in a single genotype.
CONCLUSION
The cultivars ‘Januária’ and ‘Grancoure’ are the most promising for subtropical regions because they show fruits with higher masses, quality and high yield.
Table 3 - Average number of fruits per plant (NF), yield per plant (YP) and estimated productivity (Prod) of plum cultivars for subtropical regions in the crop cycles 2015 and 2016.
Cultivars ---2015--- ---2016--- NF YP (kg plant) Prod (kg ha-1) NF YP (kg plant) Prod (kg ha-1) Santa Rosa 9.8Bc 0.4Bbc 271.3Bbc 11162.7Aab 5.0Aab 3,335.0Aab Harry Pickstone 17.3Abc 0.5Bbc 312.8Bbc 37.7Ab 1.1Ab 746.8Ab
Fla 87-7 33.3Bab 1.2Aab 798.9Bab 65.2Ab 1.9Ab 1,284.4Ab
Grancoure 15.5Bbc 0.7Bbc 500.9Bbc 87.2Aab 4.4Aab 2,971.1Aab
Satsuma 15.6Bbc 0.6Bbc 425.3Bbc 33.5Ab 1.3Ab 899.4Ab
Januária 12.2Bc 0.5Bbc 380.4Bbc 293.5Aa 14.3Aa 9,556.1Aa
Gema de Ouro 38.2Aa 2.0Aa 1,328.6Aa 39.7Ab 2.2Ab 1,457.9Ab
CV % 20.3 25.8 25.8 23.1 26.9 26.9
6 Pio et al.
ACKNOWLEDGEMENTS
This study was financed in part by the Coordenação de Aperfeiçoamento de Pessoal de Nível Superior - Brasil (CAPES)
- Finance Code 001 and Conselho Nacional de Desenvolvimento
Científico e Tecnológico (CNPq).
DECLARATION OF CONFLICTING INTERESTS
The authors declared no potential conflicts
of interest with respect to the research, authorship, and/or publication of this article.
AUTHOR’S CONTRIBUTIONS
All authors contributed equally for the conception and writing of the manuscript. All authors critically revised the
manuscript and approved of the final version.
REFERENCES
ALVARES, C.A. et al. Köppen’s climate classification map
for Brazil. Meteorologische Zeitschrift, v.22, n.6, p.711-728, 2013. Available from: <http://dx.doi.org/2948/2013/0507>. Accessed: Jan. 18, 2018. doi: 10.1127/0941-2948/2013/0507.
ARAÚJO, J.P.C. et al. Influence of the renewal pruning and
control of the rust in the carbohydrate reserves and production of precocious peach tree. Revista Brasileira de Fruticultura, v.30, n.2, p.331-335, 2008. Available from: <http://dx.doi.org/10.1590/ S0100-29452008000200011>. Accessed: Nov. 10, 2017. doi: 10.1590/S0100-29452008000200011.
BARBOSA, W. et al. Advances in low-chilling peach Breeding
at Instituto Agronômico, São Paulo State, Brazil. Acta Horticulturae, n.872, p.147-150, 2010. Available from: <http://
dx.doi.org/10.17660/ActaHortic.2010.872.17>. Accessed: Nov. 20, 2017. doi: 10.17660/ActaHortic.2010.872.17.
BETTIOL NETO, J.E. et al. Production and postharvest quality
of pear tree cultivars in subtropical conditions at eastern of São
Paulo state, Brazil. Ciência Rural, v.44, N.10, p.1740-1746, 2014. Available from: <http:// dx.doi.org/10.1590/0103-8478cr20131574>. Accessed: Jan. 20, 2018. doi: 10.1590/0103-8478cr20131574.
BETTIOL NETO, J.E. et al. Production and quality attributes of
quince tree cultivars in the eastern of the state of São Paulo. Revista Brasileira de Fruticultura, v.33, p.1035‑1042, 2011. Available from: <http://dx.doi.org/10.1590/S0100-29452011000300042>. Accessed: Sept. 10, 2018. doi: 10.1590/S0100-29452011000300042.
CASTRO, L.A.S. et al. Ameixeira: cultivares indicadas para
plantio nas regiões produtoras brasileiras. Brasília: Embrapa Informação Tecnológica, 2008, 16p.
CRUZ, C.D. GENES: A software package for analysis in experimental statistics and quantitative genetics. Acta Scientiarum, v.35, n.3, p.271-276, 2013. Available from: <http:// dx.doi.org/10.4025/actasciagron.v35i3.21251>. Accessed: Nov. 25, 2017. doi: 10.4025/actasciagron.v35i3.21251.
CRUZ. C.D. et al. Modelos biométricos aplicados ao melhoramento genético. 3ª ed. Viçosa, UFV. 2004. 480p.
CURI, P.N. et al. Production of blackberry and redberry in Lavras – MG, Brazil. Ciência Rural, v.45, N.8, p.1368-1374, 2015. Available from: <http:// dx.doi.org/10.1590/0103-8478cr20131572>. Accessed: Jan. 25, 2018. doi: 10.1590/0103-8478cr20131572.
GONÇALVES, M.A. et al. Fruit quality and productivity of peaches submitted to different pruning dates. Ciência Rural, v.44, n.8, p.1334-1340, 2014. Available from: <http://dx.doi. org/10.1590/0103-8478cr20120617>. Accessed: Jan. 12, 2018. doi: 10.1590/0103-8478cr20120617.
OLIVEIRA, M.C. et al. Selection of promising plum cultivars for the Mantiqueira Mountain Range. Revista Ceres, v.58, n.4, p.531-Table 4 - Principal components analysis showing the eigenvalue, ratio, and cumulative ratio among the quantitative traits from different
plum cultivars for the subtropical region.
Variables PC1 PC2 PC3 PC4 PC5 PC6
Fruit length (mm) 0.366 0.346 0.102 0.083 -0.045 0.314
Fruit diameter (mm) 0.369 -0.085 -0.268 0.198 -0.177 0.708
Fruit mass (g) 0.311 -0.454 -0.047 0.010 -0.189 -0.371
Soluble Solids (Brixº) 0.080 -0.471 0.534 0.045 0.436 0.238
Acidity (g100 g-1) -0.325 -0.067 0.166 0.684 0.182 0.087
Ratio 0.365 -0.180 0.197 -0.468 0.140 0.056
Flowering duration (days) -0.320 0.328 0.005 -0.430 0.412 0.243 Harvest duration (days) -0.266 0.068 0.595 -0.152 -0.707 0.163
Number of fruits 0.307 0.401 0.304 0.206 0.125 -0.252
Yield per plant (kg) 0.347 0.368 0.224 0.121 0.055 -0.213
Eigenvector 5.2 2.13 1.14 0.84 0.37 0.29
Total variation (%) 52.08 21.36 11.44 8.42 3.77 2.94
535, 2011. Available from: <http://dx.doi.org/10.1590/S0034-737X2011000400019>. Accessed: Jan. 15, 2018. doi: 10.1590/ S0034-737X2011000400019.
PETRI, J.L. et al. Phenology of wild apple species like pollinators of gala and fuji cultivars. Revista Brasileira de Fruticultura, v.30, p.868‑874, 2008. Available from: <http://dx.doi.org/10.1590/ S0100-29452008000400005>. Accessed: Sept. 05, 2018. doi: 10.1590/S0100-29452008000400005.
SAPIR, G. et al. Cloning of four new Japanese plum S-alleles and determination of the compatibility between cultivars by PCR analysis. Journal of Horticultural Science and Biotechnology, v. 79, n. 2, p. 223-227, 2004. Available from: <http://doi.org/10 .1080/14620316.2004.11511752>. Accessed: Sept. 05, 2018. doi: 10.1080/14620316.2004.11511752.
SIMONETTO, P.R. et al. Potential for Japanese plum (Prunus salicina L.) cultivation in Southern Brazil. Acta Horticulturae,
n. 985, p. 229-233, 2013. Accessed: Sept. 10, 2018. doi: 10.17660/ ActaHortic.2013.985.29.
SOUZA, F.B.M. et al. Adaptability and stability of reproductive and vegetative phases of peach trees in subtropical climate. Acta Scientiarum-Agronomy, v.39, n.4, p.427, 2017. Available from: <http:// dx.doi.org/10.4025/actasciagron.v39i4.32914>. Accessed: Jan. 11, 2018. doi: 10.4025/actasciagron.v39i4.32914.
SOUZA, F.B.M. et al. Fruit production and quality of selections and cultivars of peach trees in Serra da Mantiqueira, Brazil. Bragantia, v.72, p.133-139, 2013. Available from: <http:// dx.doi. org/10.1590/S0006-87052013005000024>. Accessed: Jan. 11, 2018. doi: 10.1590/S0006-87052013005000024.