www.ccarevista.ufc.br ISSN 1806-6690
Uniformity trials size for estimating cherry tomato plot size
1Tamanho do ensaio de uniformidade para estimativa do tamanho de parcela em
tomate cereja
Bruno Giacomini Sari2* and Alessandro Dal’Col Lúcio3
ABSTRACT - The aim of this study was to determine how the size of the uniformity trial influences the estimation of cherry tomato plot size. The size of plot required to evaluate the mean length of fruit per plant, mean fruit width per plant, mean fruit weight per plant, number of bunches per plant, number of fruits per bunch, number of fruits per plant and total weight of fruits per plant was estimated in uniformity trials in two greenhouses: large (250 m²) and small (200 m²). In each greenhouse and row, and for each variable, 3000 plot size estimates were obtained by resampling and used to determine of 97.5 and 2.5% percentiles. Each row needs to be treated as a specific uniformity trial because of significant row variability. It is recommended that uniformity trials are carried out on 35 plants in the large greenhouse and 23 plants in the small greenhouse in order to estimate cherry tomato production variables at a confidence interval of 30% of the mean.
Key words:Solanum lycopersicum L.. Resampling. Experimental Planning. Vegetable Crops.
RESUMO -O presente trabalho tem como objetivo determinar a influência do tamanho do ensaio de uniformidade sobre a estimativa do tamanho de parcela em caraterísticas produtivas do tomate cereja. O tamanho de parcela necessário para avaliar o comprimento médio de fruto por planta, largura média de fruto por planta, peso médio de fruto por planta, número de cachos por planta, número de frutos por cacho, número de frutos por planta e peso total de frutos por planta foram estimados em ensaios de uniformidade de diferentes tamanhos em duas estufas (uma grande de 250 m² e uma pequena de 200 m²). Em cada estufa, fileira e variável foram obtidas 3000 estimativas do tamanho de parcela através de reamostragens das plantas, e a partir delas foram determinados os percentis 97,5 e 2,5%. Há a necessidade de se considerar cada fileira como um ensaio de uniformidade específico, devido a variabilidade entre as fileiras de cultivo. É recomendado realizar ensaios de uniformidade compostos por 35 plantas na estufa grande e por 23 plantas na estufa pequena para estimar o tamanho de parcela das variáveis produtivas do tomate cereja com uma amplitude do intervalo de confiança igual a 30% da média.
Palavras-chave:Solanum lycopersicum L.. Reamostragem. Planejamento Experimental. Olerícolas.
DOI: 10.5935/1806-6690.20180074 *Corresponding author
Received for publication on 10/08/2015; approved 08/01/2018
1Artigo extraído de projeto de pesquisa financiada pela Universidade Federal de Santa Maria/UFSM
INTRODUCTION
A growing of vegetable crops species is of primary importance to the Brazilian economy. Among the vegetable crops species, the tomato crop has the greater importance. Tomatoes were grown on 63,717 hectares in 2017, producing over 4 million tons (IBGE, 2017). The cherry tomato fruit is characterized by its reduced size. They are used as decoration or aperitif snacks (GUSMÃO; GUSMÃO; ARAÚJO, 2006) and command a high commercial value compared to other types of tomato. Due to reduced size of the fruit, the cherry tomato production was directly related with the number of fruits per plant and not with the fruit size as in
salad tomato (SARIet al., 2017).
Due to the economic importance of the tomato, studies are needed to improve our knowledge of the crop. Trials are performed and need to be accurate in order to produce reliable information. One of the basic requirements in planning any trial is determining the plot size that minimizes the experimental error. Several methods are used to estimate optimum plot size, among which stands out: a) maximum curvature inspection method, b) maximum curvature method (LESSMAN; ATKINS, 1963), c) modified maximum curvature method (MEIER; LESSMAN, 1971); d) linear response model with plateau; e) maximum curvature of the coefficient of variation model (PARANAÍBA; FERREIRA; MORAIS, 2009); and f) maximum distance method (LORENTZ; ERICHSEN; LUCIO, 2012).
Among the methods mentioned above, the maximum curvature of the coefficient of variation model (CMCV) stands out. Unlike maximum curvature inspection, this method is not subjective. Furthermore, the models do not need to be adjusted as is the case with the maximum curvature method and linear response model with plateau. It also does not require the clustering of basic experimental unit data, which means that it is easier to carry out (PARANAÍBA; FERREIRA; MORAIS, 2009). Furthermore, since the basic experimental units (BU) do not need to be clustered, CMCV is ideal for uniformity
small trials (CARGNELUTTI FILHO et al., 2011a;
SCHWERTNER; LÚCIO; CARGNELUTTI FILHO, 2015a), like those performed in greenhouses.
CMCV has already been used in estimating plot size for rice (PARANAÍBA; FERREIRA, MORAIS, 2009), wheat and cassava (PARANAÍBA; MORAIS;
FERREIRA, 2009), maize (CARGNELUTTI FILHOet al.,
2011a) and tomato (LÚCIOet al., 2012). However, none
of the aforementioned references discusses how the size of the uniformity trial can affect the accuracy of estimated plot size. The influence of the size of the uniformity trials on the plot size estimation was studied by Storck, Bisognin
and Oliveira (2006), Cargnelutti Filho et al. (2011b),
Schwertner, Lúcio and Cargnelutti Filho (2015a,b) for potato, forage turnip and vegetables, respectively. Storck, Bisognin and Oliveira (2006) concluded that the size of the uniformity trial did not influence estimated plot size in the
potato crop. However, Cargnelutti Filhoet al. (2011b) e
Schwertner, Lúcio and Cargnelutti Filho (2015a,b) report that uniformity trials limited to a very small portion of the experimental area (with few BUs) lead to low precision estimates, and that the findings of Storck, Bisognin and Oliveira (2006) are relate to the very large minimum size of the uniformity trial used by the authors.
The high precision plot size estimates in limited experimental area would be advantageous in terms of cost, time, and labor-saving. Evidence that high precision estimates of plot size (in trials on different agricultural crops) can be obtained in limited experimental space could lead to changes in the planning of such trials. However, studies of this kind are scarce and very recent, and in the case of cherry tomatoes, no studies were found relating to the size of uniformity trials and its impact on plot size estimative.
Therefore, the aim of this study was to determine the influence of the size of uniformity trials on estimated plot size, in cherry tomato productivity traits.
MATERIAL AND METHODS
Two uniformity tests were carried out in plastic greenhouses, placed in the north–south direction, and of
different dimensions: 1) small greenhouse (20´ 10 m =
200 m2), 3 m right foot and 4 m in the central part; 2)
large greenhouse (25´ 10 m = 250 m2), 4.5 m right foot
and with 5.5 m in the central part. Both greenhouses were covered with a low-density polyethylene (LDPE) film, with 150-micron thickness and an anti-UV additive. The trials were performed on Lily hybrid cherry tomatoes in 2014 spring/summer season, in the Plant Science Department of the Federal University of Santa Maria (UFSM). The experimental area is located at latitude 29°43' S, longitude 53°43' W and 95 m altitude. The climate at the site of the experiments is classified as Cfa (subtropical humid with no defined dry season and hot summers) and the soil is classified as Sandy Dystrophic Red Argisol.
In the month prior to seedling the tomato crop, the soil pH was raised to 6.5 and phosphorus levels to
300 mg dm-3 in both greenhouses. The limestone and
distance between each one; drip irrigation was used. Seedling transplant was performed on the October 26 in both greenhouses. Following the crop recommendations, the seedlings were transplanted when the first flower appeared. Seedlings were spaced at 0.5 m
in both greenhouses and fertilized with 150 kg ha-1 of N,
250 kg ha-1 of P and 125 kg ha-1 of K. Two topdressing
fertilizations were performed with 30 kg ha-1 of N, 15
kg ha-1 of P, and 30 kg ha-1 of K with a 23 day interval
between them. Base and top dressing fertilizations were performed based on chemical analysis of the soil and according to the recommendations of the Network of Soil and Plant Tissue Analysis Laboratories of the states of Rio Grande do Sul and Santa Catarina (ROLAS, 2004).
The tomato plants were grown using two stems in both greenhouses, and all lateral growths were eliminated. Every 14 days were applied calcium and boron in order to avoid flower abortion and “black bottom” tomatoes. Fungicides and insecticides were also applied every 14 days to control plagues and diseases.
Each plant was treated as an experimental basic unit (BU) and, due to the differing row lengths the number of BUs per row was also different for the two greenhouses (44 BUs in the large greenhouse and 34 in the small greenhouse). Each fruit bunch, and each fruit, from all the plants were collected. Bunches were considered suitable to be harvested when the fruits changed the coloration from green to reddish. All the fruits were measured using a caliper ruler and weighed on a 0.01 g precision scale.
The following variables measured were mean fruit length per plant, corresponding to the transverse fruit measure, in cm; mean fruit width per plant, corresponding to the longitudinal fruit measure, in cm; mean weight of fruit per plant, in g; number of bunches per plant; number of fruits per bunch; number of fruits per plant; and total fruit weight per plant, in g.
Different uniformity trials sizes were planned in each crop row. In the large greenhouse, 38 uniformity trials per row (3 BUs, 4 BUs, ..., 40 BUs) were planned, while in the small greenhouse 28 trials per row were planned (3 BUs, 4 BUs, ..., 30 BUs). For each uniform trials planned, 3,000 resampling were performed. For each resampling, one plant was randomly selected in each row and adjacent plants were used to make up the trials of uniform size. For example, to determine the first sample for the initial uniformity trial size (3 BUs), a BU among the first and the 44th BEU in the row was randomly selected in the large greenhouse. If the first BU was selected, the first uniformity trial would consist of the first, second and third BUs. For the second resampling, one BU was randomly selected between the first and the 44th BU in the row again. If the 42nd BU was selected, the uniformity trial would consist
of the 42nd, 43rd and 44th BUs. The same procedure was followed for the remaining 2,998 resampling using three BUs, and for all the uniformity trials planned.
Thus, for each uniformity trial simulated and for all variables, 3,000 estimates of the following statistics
were obtained: variance (s2), mean ( ), first order spatial
autocorrelation coefficient ( ) using formula 1:
(1)
where: is the experimental error associated with each observation.
The optimal plot size ( ) was estimated using formula 2
(PARANAÍBA; FERREIRA; MORAIS, 2009):
(2)
For each of these values, a 95% confidence interval
(CI95%) was calculated based on the difference between the
97.5% and 2.5% percentiles. The uniformity trial size was determined when the amplitude of the confidence interval of was equal to or less than 30% compared to the estimated mean. Statistical analysis was performed using the R software (R DEVELOPMENT CORE TEAM, 2014).
RESULTS AND DISCUSSIONS
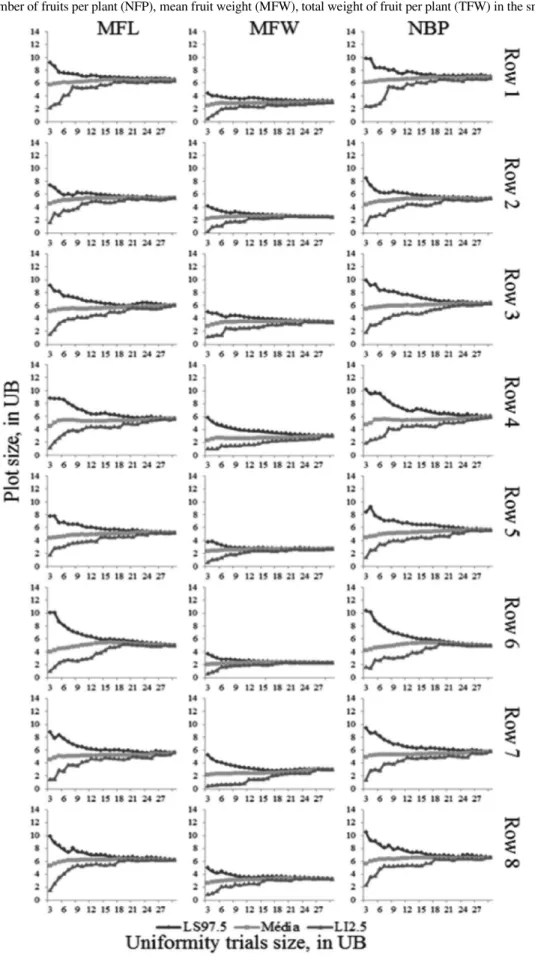
The plot size and the CI95% of these estimates for
each character in each simulated uniformity trial are given Figures 1 to 4. There was variability among the crop rows for these estimates, which was more marked for mean fruit length, mean fruit width and mean fruit weight in the large greenhouse, and mean fruit width and number of fruits per bunches in the small greenhouse. Even in situations where the variability was less marked, differences, albeit subtle, were observed among rows at
CI95% for each simulated trial.
The difference in the estimated plot size and CI 95% is the result of heteroskedasticity among the crop rows, a common phenomenon in vegetable crops grown in
a protected environment (LORENTZet al., 2005, LÚCIO
et al., 2008, 2011, 2012). These variability among crop
rows is consequence of the difference in proximity of the rows to sides of the greenhouse, the differentiating climate conditions inside the greenhouses and the intensive crop management carried out during the crop cycle (LÚCIO
et al., 2008). For this reason, each row was treated as
The reliability of the estimated plot sizes for each simulated trial on each row and for each variable is
indicated by the CI95%(Figures 1, 2, 3 and 4). When the
uniformity trials are performed with few UBs, the plot
sizes estimates are less precise (largest CI95%). As the size
of the uniformity trial increased, the CI95% of the , and
s2 fell, leading to more precise estimates of the plot size
(smaller CI95%). Cargnelutti Filhoet al. (2011b) reported
the fact that plot size estimates become more reliable as the size of the uniformity trial increases, in their study on forage turnip. Schwertner, Lúcio and Cargnelutti Filho (2015a,b) reached the same conclusion studying several vegetable crops, corroborating the findings herein.
Note that observing only CI95% can lead to
erroneous conclusions regarding the reliability of plot
size estimates. CI95% is related to the average of the
estimate, i.e. for variables where the estimated plot size was smaller, there is also a tendency for amplitude to be
lower, but this characteristic alone (lower CI95%) does not
denote that the estimate is of higher precise (Figures 1, 2 , 3 and 4). For instance, take the first row in the small
greenhouse. In the trial consisting of 3 BUs, the CI95% is
equal to 1.79 plants for the mean fruit length variable,
while for total fruit weight, CI95% is equal to 7.40 plants.
Based on CI95% alone, it could erroneously be concluded
that the plot size estimate is more precise for mean fruit length. However, based on the mean estimate of the
plot size for each of the variables, CI95% corresponds to
157.57% of the mean length of fruit and 121.93% of the mean total weight of fruit.
Researchers need to examine these finding based on their agronomic knowledge and common sense. It is obvious that if there is less heterogeneity (rows or
variables with smaller plot size), some flexibility to CI95%
can be allowed. Once again, taking the first row in the small greenhouse as an example, note that the respective 97.5 and 2.5% percentiles for mean fruit length were 1.53 and 1.22 plants, based on a 30% error in mean plot size estimate. Bearing in mind that it is impossible to work with less than one plant, the amplitude of 0.31 in practice does not exist, because for both percentiles, the optimal plot size in practice has to be two plants. In this case, researchers can work with smaller uniformity trials, i.e.,
with a higher CI95%.
Table 1 - Size of uniformity trials (number of plants) for cherry tomato production variables in each row and greenhouse for 95% confidence intervals equal to 30% of the estimated mean plot size
--- Large greenhouse
---R11 MFL
2 MFW NCP NFC NFP MFW TFW
23 24 24 16 26 25 27
R2 23 28 18 21 18 24 21
R3 33 33 24 30 28 33 28
R4 >40 >40 22 32 17 >40 17
R5 23 17 18 22 14 22 15
R6 32 32 21 32 20 32 19
R7 28 23 19 25 19 16 22
R8 35 35 28 32 25 35 25
- Small greenhouse
R1 MFL MFW NCP NFC NFP MFW TFW
21 18 16 14 14 16 14
R2 17 15 9 19 12 12 13
R3 14 10 17 14 16 16 17
R4 16 18 15 12 19 23 19
R5 12 15 14 11 14 11 19
R6 9 11 19 18 16 13 16
R7 14 22 15 14 12 18 14
R8 12 11 10 18 11 15 16
For cherry tomatoes, smaller uniformity trials
(allowing a higher AIC95%) can be conducted to calculate the
plot size needed to estimate the mean length, mean width and mean fruit weight. The plot size and the amplitude of the smaller confidence interval, as observed in some rows in the large greenhouse and in all rows in the small greenhouse, indicate that there is greater homogeneity among the plants for these variables compared to the others (Figures 1, 2, 3 and 4).
The studies conducted by Schwertner, Lúcio and Cargnelutti Filho (2015a,b) on vegetables crops did not take into account the fact reported above, possibly due to the small difference between plot size estimates, allowing the size of the uniformity trial to be determined from a fixed number of BUs for all crops studied. In our study, due to the significant differences in the plot size estimates among the variables, we chose to determine the optimal size of
the uniformity trial as the one in which CI95% was equal to
30% of the mean, thus achieving a single recommendation with the same criterion (Table 1). Thus, even in trials with
high plot size, the CI95% will always be less than two plants.
Note that only the variables of mean fruit length, mean fruit width and mean fruit weight in row four in the large greenhouse failed to satisfy this condition.
The uniformity trials size required to calculate the
plot size estimate with AIC95% equal to 30% of the mean
differed among crop rows for the same characteristic, confirming heteroskedasticity among them (Table 1). The results show that uniformity trials of 35 plants in the large greenhouse and 23 plants in the small greenhouse are required to estimate the plot size required to obtain the
cherry tomato production characteristics with CI95% equal
to 30% of the mean, regardless of the row and variable.
However, the maximum acceptable AIC95% required
should be decided by the researcher based on the results described and discussed herein.
CONCLUSIONS
1. The uniformity trial size required to estimate plot size varies from one row to another and according to the characteristics studied;
2. Uniformity trials of 35 plants in the large greenhouse and 23 plants in the small greenhouse are required to estimate the plot size to cherry tomato production
variables with CI95% equal to 30% of the mean.
REFERENCES
CARGNELUTTI FILHO, A.et al. Tamanho ótimo de parcela
em milho com comparação de dois métodos.Ciência Rural, v. 41, p. 1890-1898, 2011a.
CARGNELUTTI FILHO, A.et al. Tamanhos de parcela e de ensaio de uniformidade em nabo forrageiro.Ciência Rural, v. 41, p. 1517-1525, 2011b.
GUSMÃO, M. T. A.; GUSMÃO, S. A. L.; ARAÚJO, J. A. C. Produtividade de tomate tipo cereja cultivado em ambiente protegido e em diferentes substratos.Horticultura Brasileira, v. 24, n. 4, p. 431-436, 2006.
INSTITUTO BRASILEIRO DE GEOGRAFIA E ESTATÍSTICA. Levantamento sistemático da produção agrícola: pesquisa mensal de previsão e acompanhamento das safras agrícolas no ano civil: novembro 2017. Disponível em: < ftp://ftp.ibge.gov.br/Producao_Agricola/Levantamento_ Sistematico_da_Producao_Agricola_[mensal]/Fasciculo/lspa_ 201711.pdf>. Acesso em: 05 jan. 2018.
LESSMAN, K. J.; ATKINS, R. E. Comparisons of planning arrangements and estimates of optimum hill plot for grain sorghum yield tests.Crop Science, v. 3, p. 477-481, 1963. LORENTZ, L. H.et al. Variabilidade da produção de frutos de
pimentão em estufa plástica.Ciência Rural, v. 35, p. 316-323, 2005.
LORENTZ, L. H.; ERICHSEN, R.; LÚCIO, A. D. Proposta de método para estimação de tamanho de parcela para culturas agrícolas.Revista Ceres, v. 59, p. 772-780, 2012.
LÚCIO, A. D. et al. Estimativa do tamanho de parcela para
experimentos com alface.Horticultura Brasileira, v. 29, p. 510-515, 2011.
LÚCIO, A. D. et al. Tamanhos de amostra e de parcela
para variáveis de crescimento e produtivas de tomateiro. Horticultura Brasileira, v. 30, p. 660-668, 2012.
LÚCIO, A. D. et al. Variância e média da massa de frutos
de abobrinha-italiana em múltiplas colheitas. Horticultura Brasileira, v. 26, p. 335-341, 2008.
MEIER, V. D.; LESSMAN, K. J. Estimation of optimum field plot shape and size testing yield in Crambe abyssinica Hordnt. Crop Science, v. 11, p. 648-650, 1971.
PARANAÍBA, P. F.; FERREIRA, D. F.; MORAIS, A. R. Tamanho ótimo de parcelas experimentais: proposição de métodos de estimação.Revista Brasileira de Biometria, v. 27, p. 255-268, 2009.
PARANAÍBA, P. F; MORAIS, A. R; FERREIRA, D. F. Tamanho ótimo de parcelas experimentais: comparação de métodos em experimentos de trigo e mandioca. Revista Brasileira de Biometria, v. 27, p. 81-90, 2009.
R DEVELOPMENT CORE TEAM. R: a language and environment for statistical computing. Vienna: R Foundation for Statistical Computing, 2014.
ROLAS.Recomendações de adubação e de calagem para os estados do Rio Grande do Sul e Santa Catarina. Passo Fundo: Sociedade Brasileira de Ciência do Solo. Núcleo Regional Sul, 2004. 224 p.
SANTOS, D.et al. Tamanho ótimo de parcela para a cultura do
SARI, B. G.et al. Linear relationships between cherry tomato traits.Ciência Rural, v. 47, n. 3, p. 1-7, 2017.
SCHWERTNER, D. V.; LÚCIO, A. D.; CARGNELUTTI FILHO, A. Size of uniformity trials for estimating the optimum plot size for vegetables.Horticultura Brasileira, v. 33, p. 388-393, 2015b.
SCHWERTNER, D. V.; LÚCIO, A. D.; CARGNELUTTI FILHO, A. Uniformity trial size in estimates of plot size in restrict areas. Revista Ciência Agronômica v. 46, p. 597-606, 2015a. STORCK, L.; BISOGNIN, D. A.; OLIVEIRA, S. J. R. Dimensões dos ensaios e estimativas do tamanho ótimo de parcela em batata. Pesquisa Agropecuária Brasileira, v. 41, p. 903-909, 2006.