Department of Finance
Essays on Credit Rating Announcements
Paulo Viegas de Carvalho
Thesis presented in partial fulfillment of the requirements for the degree of Doctor in Finance
Supervisor:
Professor João Pedro Pereira
Assistant Professor of Finance, ISCTE - IUL
Department of Finance
Essays on Credit Rating Announcements
Paulo Viegas de Carvalho
Thesis Committee
President
Professor João Pedro Nunes, Professor, ISCTE-IUL
Committee Members
Professor João Pedro Pereira, Assistant Professor, ISCTE-IUL
Professor José Dias Curto, Associate Professor, ISCTE-IUL
Professor Miguel Almeida Ferreira, Professor, FE-UNL
Professor Paul Anthony Laux, Professor, University of Delaware
Professor Raquel Medeiros Gaspar, Associate Professor, ISEG-UTL
Abstract
This thesis is composed of three separate research papers on credit rating announcements. The first paper, in Chapter 1, addresses the effects of rating announcements issued by Fitch, Moody’s and S&P on the idiosyncratic volatility of a firm’s stock return. Such measure of volatility is quantified both in absolute terms and relative to total firm’s volatility, and the results obtained are in general consistent. The paper documents significant increases in volatility after downgrades, especially multi-agency downgrades, whereas no effect of upgrades is evident. Effects are largest for small and low rated firms. Volatility effects of S&P ratings downgrades are larger than those of other ratings agencies, implying that investors’ reactions depend not only on the type of announcements, but also on the agency making the announcement.
The second paper, in Chapter 2, reports systematic evidence on some unintended effects of rating downgrades on future credit defaults. Based on complementary causality methodologies and using an extensive database of long-term corporate obligation ratings issued by Moody’s, S&P and Fitch, from 1990 to 2012, the paper shows that downgrades crossing the threshold between investment grade and speculative grade may cause an increase of at least 3% in the 1-year probability of default. The increase in the probability of default seems to be stronger for deeper rating downgrades. The effect is also likely to be stronger for firms that already have a low initial rating.
The third paper, in Chapter 3, focuses on the quasi-regulatory role of credit ratings, which depends on the extent to which ratings are stable and reflect a through-the-cycle credit risk assessment. Introducing a new measure of rating dynamics summarizing all observed rating transitions, the paper examines if corporate ratings from the three major agencies fulfill such requirement. Changes in ratings are found to be greater around recessions, with S&P seeming more sensitive than Moody’s and Fitch to the conditions of the business cycle. Despite this sensitiveness to the business cycle, ratings remain a less volatile, though potentially less accurate, measure of credit risk than accounting-based models of default prediction.
JEL classification: D83; G24
Resumo
Esta tese é composta por três artigos de investigação sobre os anúncios de rating. O primeiro artigo, no Capítulo 1, analisa os efeitos dos anúncios da Fitch, da Moody’s e da S&P sobre a volatilidade idiossincrática da rendibilidade das ações das empresas. O artigo demonstra a existência de aumentos significativos na volatilidade na sequência de revisões em baixa nas notações de crédito, especialmente quando oriundas de várias agências; não foi detetada evidência conclusiva sobre os efeitos associados aos aumentos nas notações. A reação na volatilidade é também mais significativa nas pequenas empresas e nas empresas com baixos níveis de rating. Confirma-se ainda que, quando a revisão em baixa da notação é feita pela S&P, os efeitos são superiores aos das outras agências, revelando que os investidores reagem não só ao tipo de anúncio, mas também à agência que o emite.
O segundo artigo, no Capítulo 2, apresenta evidência sistemática referente a alguns efeitos não intencionais das reduções de notação sobre os incumprimentos futuros de crédito. Com base em metodologias de análise de causalidade e utilizando uma extensa base de dados referente a ratings de longo prazo a empresas, atribuídos pela Moody’s, S&P e Fitch, o artigo mostra que reduções de notação de grau de investimento para grau especulativo podem incrementar a probabilidade de incumprimento a 1 ano em, pelo menos, 3%. O aumento da probabilidade parece ser mais acentuado quando as revisões em baixa nas notações de crédito são mais profundas. O efeito esperado poderá igualmente ser intensificado caso as empresas registem uma baixa notação inicial.
O terceiro artigo, no Capítulo 3, incide no papel quase regulatório dos ratings, dependendo este da medida em que as notações são estáveis e refletem uma ótica "through-the-cycle". Propondo um novo indicador sobre a dinâmica dos ratings, que resume todas as migrações por estes registadas, o artigo analisa se os ratings atribuídos pelas três maiores agências a empresas cumprem tal requisito. A evidência encontrada demonstra que as alterações nas notações são mais elevadas durante as recessões económicas, particularmente no caso da S&P. Apesar da sensibilidade que manifestam face aos ciclos económicos, os ratings revelam ser uma medida do risco de crédito menos volátil, mas também potencialmente menos rigorosa, do que os modelos de previsão do incumprimento baseados em indicadores financeiros.
Classificação JEL: D83; G24
Acknowledgements
“If I have seen further it is by standing on ye sholders of Giants.”
Sir Isaac Newton Letter to Robert Hooke (5 February, 1676), in Turnbull, H. W. (Ed.) (1959), The Correspondence of Isaac
Newton, 1, 1661–1675, Cambridge University Press, p. 416.
This Ph.D. thesis benefited from direct and indirect contributions of several people, which eased the challenging and solitary path of scientific investigation; ultimately, they turned my journey through this path a truly rewarding experience. I would like to acknowledge them for that.
First and foremost, I am indebted to the supervisor of the thesis, Professor João Pedro Pereira, for his guidance from the very beginning of the Ph.D. program in Finance. Since the inception of this thesis, he exceeded what one can expect from a supervisor. His valuable comments, unconditional support and patience, shaped and substantially enriched the final contents of the thesis. The usual disclaimer applies; any errors that may remain are mine.
I am also grateful to Professor Paul Laux for finding time to provide extremely insightful suggestions, despite his numerous commitments. His clairvoyance and wisdom helped me organize ideas and to focus important issues that otherwise would have been forgotten. I would like as well to thank Professor José Dias Curto, for his availability in sharing knowledge on some econometric issues. His unrestricted willingness to help, as well as that of other faculty staff of the Ph.D. program in Finance, is a genuine example of why studying at ISCTE-IUL is a stimulating and worthwhile experience.
The thesis benefited as well from valuable suggestions presented by the remaining members of the jury, Professors João Pedro Nunes, Miguel Ferreira and Raquel Gaspar. To all of them, I address my sincere recognition.
Previous versions of the second paper were presented at the 2014 FMA European Conference, held in Maastricht, at the Portuguese Finance Network 8th Finance Conference, held in Vilamoura, and at the EFMA 2014 Annual Meetings, held in Rome. The third paper was presented at the IFABS 2014, held in Lisbon. Both papers received helpful comments and suggestions from discussants and participants at these conferences, which are highly appreciated.
Fundação para a Ciência e a Tecnologia provided helpful financial backing (research grant PTDC/EGE-GES/119274/2010), which is gratefully acknowledged. The use of an extensive amount of data for empirical research, a pillar of the investigation in the thesis, would not have been possible without such support. I also thank Nuno Rodrigues for helping in the gathering and management of the different databases.
An additional word of recognition is owed to all cited investigators along the work. By paving the way for the research of credit risk modelling and credit ratings, they allowed the preparation of this thesis and its scientific achievements. They are the giants on whose shoulders I had to stand upon, so that I was able to uncover issues that allow us all to see a little further.
My deepest gratitude goes to Sílvia, Guilherme and João. I am indebted to them for the many hours I needed while I was “away”. I sincerely hope to find ways to show them how grateful I am and reward their love and support. A special thought goes as well to my late parents, in particular my father, who passed away while this thesis was being finished. It was them who instilled in me the passion for the pursuit of knowledge.
Contents
Abstract ... iii
Resumo ... iv
Acknowledgements ... vi
List of Tables ... xi
List of Figures ... xii
Chapter 1
Credit rating announcements and stock markets: The volatility effect
1.1 Introduction ... 11.2 Related literature ... 4
1.3 Methodology ... 7
1.3.1 Absolute idiosyncratic volatility ... 7
1.3.2 Relative idiosyncratic volatility ... 9
1.4 Data and descriptive statistics ... 11
1.4.1 Data ... 11
1.4.2 Descriptive statistics of ratings ... 12
1.4.3 Descriptive statistics of volatilities ... 16
1.5 Analysis of absolute idiosyncratic volatility ... 19
1.6 Analysis of relative idiosyncratic volatility ... 23
1.6.1 Framework with unique announcements ... 24
1.6.2 Multiple announcements ... 27
1.7 Summary and conclusion ... 29
Chapter 2
Is There a Self-fulfilling Prophecy in Credit Rating Announcements?
2.1 Introduction ... 34
2.2 The relation between ratings and default ... 38
2.2.1 Literature review ... 38
2.2.1.1 Credit ratings and their determinants ... 38
2.2.1.2 Financial effects and information content of ratings ... 40
2.2.2 Naïve approach to the relation between the probability of default and ratings ... 43
2.2.2.1 Statistically-based credit default models ... 43
2.2.2.2 Rating downgrades and credit default ... 45
2.2.2.3 Influences of IGSG announcements ... 50
2.2.2.4 Influences of deeper downgrades ... 53
2.2.3 Research hypotheses ... 53 2.3 Data ... 55 2.3.1 Ratings ... 56 2.3.2 Defaults ... 57 2.3.3 Summary statistics ... 58 2.4 Causality analysis ... 63
2.4.1 Literature review of causality methods ... 63
2.4.1.1 Propensity score matching ... 63
2.4.1.2 The Heckman treatment effects ... 67
2.4.2 Results of the propensity score matching approach ... 68
2.4.3 Results of the Heckman treatment effects approach ... 71
2.4.4 Interpretation and implication ... 73
2.5 Summary and concluding remarks ... 74
References ... 76
Chapter 3
Assessing the stability of credit ratings
3.1 Introduction ... 803.2 Credit rating dynamics and trends ... 82
3.2.1 The conflict between stability and accuracy... 83
3.2.3 Changes in rating dynamics... 85
3.3 Methodology and data ... 86
3.3.1 Methodology ... 86
3.3.1.1 Sensitivity of ratings to changes in business cycles ... 87
3.3.1.2 Benchmarking the stability of ratings ... 89
3.3.1.3 Rating changes and rating reversals ... 90
3.3.2 Data ... 90
3.4 Empirical analysis ... 91
3.4.1 Business cycles effects ... 91
3.4.1.1 Regression analysis ... 92
3.4.1.2 Comparative analysis of 𝜗 ... 95
3.4.2 Benchmarking ratings stability ... 97
3.4.3 Rating changes and rating reversals ... 99
3.5 Summary and conclusion ... 100
List of Tables
Table 1.1: Distribution of firms per industry ... 13
Table 1.2: Distribution of announcements ... 14
Table 1.3a: Transition matrix for the 30-day window ... 15
Table 1.3b: Transition matrix for the 90-day window ... 15
Table 1.4: Descriptive statistics of rating announcements ... 16
Table 1.5: Descriptive statistics of volatility ... 18
Table 1.6: Absolute idiosyncratic volatility regression estimates ... 21
Table 1.7: Absolute idiosyncratic volatility regression estimates with dummies for rating level ... 23
Table 1.8: Relative idiosyncratic volatility regression estimates ... 24
Table 1.9: Relative idiosyncratic volatility regression estimates (announcements per agency) ... 26
Table 1.10: Relative idiosyncratic volatility estimates in a multiple announcements scenario ... 28
Table 2.1: Relevant variables determining credit ratings ... 39
Table 2.2: Credit default prediction ... 50
Table 2.3: Credit default prediction with IGSG announcements ... 52
Table 2.4: Credit default prediction with SGSG14 announcements ... 53
Table 2.5: Rating scales of different agencies ... 56
Table 2.6: Distribution of the sample of firm-years and ratings ... 58
Table 2.7: Yearly distribution of the sample ... 59
Table 2.8: Rate of default per type of prior rating announcements ... 61
Table 2.9: Prior rating information ... 61
Table 2.10: Financial indicators ... 63
Table 2.11: Prediction of Type-D announcements ... 69
Table 2.12: ATT estimations when IGSG or SGSG14 announcements are selected as treatment .... 71
Table 2.13: Treatment effects model estimates for SGSG14 announcements ... 72
Table 2.14: Estimated effects caused by IGSG and SGSG14 announcements on credit default ... 73
Table 3.1: Rating volatility regression estimates ... 92
Table 3.2: Structural break analysis ... 93
List of Figures
Figure 1.1: Yearly distribution of rating announcements ... 13
Figure 1.2: Distribution of credit ratings per rating class ... 15
Figure 1.3a: Average absolute annualized volatilities (30-day window) ... 17
Figure 1.3b: Average logistic relative idiosyncratic volatility (30-day window) ... 17
Figure 2.1: Credit ratings and credit spreads ... 47
Figure 2.2: Distribution of credit ratings ... 49
Figure 2.3: Yearly distribution of the prior 3-year announcements ... 60
Figure 3.1: Difference of rating volatility between Moody’s and S&P ... 95
Figure 3.2: Difference of rating volatility between S&P and Fitch ... 96
Figure 3.3: Difference of rating volatility between Moody’s and Fitch ... 96
Figure 3.4: Yearly evolution of ratings, probability of default and rate of default ... 98
Figure 3.5: Percentage of rating changes of 3 or more notches per rating agency ... 99
Chapter 1
Credit rating announcements and stock
markets: The volatility effect
1.1 Introduction
Credit rating agencies are considered as information specialists on the creditworthiness of bonds and other debt related securities, therefore influencing the cost of financing. The empirical evidence suggests, however, that announcements of rating changes convey significant information and bring forward financial effects beyond the simple cost of debt of rated firms. The extent to which these announcements add new information to financial markets is an issue explored by a strand of investigation in finance. Many papers analyse the effects of such announcements on the pricing of stocks, bonds, and credit default swaps. Norden and Weber (2004) present a comprehensive overview of this research. Although results vary, most evidence suggests a price overreaction after downgrades. However, the same does not apply to upgrades, revealing that distinct type of ratings changes generate asymmetric effects on securities returns.
Surprisingly, research on the effects of rating announcements has been mostly restricted to the influences on returns. As already underlined by Abad and Robles (2012), the literature of the impact of credit rating announcements on volatility of returns is almost inexistent, especially in the case of idiosyncratic risk. Given the potential destabilizing impact of rating changes on securities price returns, if they affect access to finance or future investment opportunities, it is in fact important to also consider volatility.
There are at least three reasons to expect volatility effects of ratings changes. First, if ratings agencies convey information that is subsequently evaluated and traded on by investors, the increased information flow about the firm should be expected to increase volatility. Second, if ratings downgrades result in restricted access to financing, or otherwise constrain a firm’s ability to develop its investment opportunities, then a volatility increase
might be expected as the firm’s economic activity declines and, consequently, its capacity to generate future earnings becomes restrained. Third, as the downgrade causes some investors to consider the firm to be an inappropriate investment, volatility might increase due to liquidity pressures as these investors search for buyers.
This paper addresses the potential effects of rating announcements on firm’s stock return volatility, selecting idiosyncratic volatility as the variable of interest. We analyze both absolute and relative idiosyncratic volatility; the use of complementary approaches to volatility should provide a more complete assessment on the effects of ratings. Earlier research on volatility concentrates on the analysis of absolute volatility. This type of analysis, of which we highlight the EGARCH model of Nelson (1991), incorporates the serial correlation (often observed in absolute volatility) by using autoregressive conditional heteroskedasticity models. On the other hand, relative idiosyncratic volatility is given by firm-specific stock return volatility relative to firm’s systematic volatility, therefore allowing us to control for market volatility. The use of such measure of volatility is motivated by works of Roll (1988), Durnev et al. (2004), Ferreira and Laux (2007), among others. Using both absolute and relative volatility, we model idiosyncratic volatility as a function of the rating announcement, controlling for some firm-related information and the macroeconomic conditions observed at the time of announcement.
We base the investigation on exhaustive ratings information covering a period over twenty years, with announcements from the three major agencies: Fitch, Moody’s and Standard & Poor’s (S&P). The paper documents results relative to announcements concerning at least 1,619 firms with 3,974 announcements. To the best of our knowledge, this is the first paper to address comprehensively the relation between idiosyncratic volatility of a firm’s stock return and rating announcements with the backing of a large amount of information.
The findings in the paper reveal that different types of rating announcements stimulate distinct reactions on volatility. Downgrades increase both relative and absolute idiosyncratic volatility; for example, downgrades by S&P intensify absolute volatility by 33.6% and lead to a 30.5% change in relative volatility. Upgrades do not have significant effects on absolute volatility, though reducing somewhat relative idiosyncratic volatility. This means that, similar to earlier findings about the stock’s return (e.g., Holthausen and Leftwich, 1986; Hand et al. 1992; Goh and Ederington, 1993; Norden and Weber, 2004), asymmetries also arise in the volatility of a stock's return subsequently to rating announcements.
By documenting that downgrades increase idiosyncratic volatility of returns, we close the triangular relation among rating announcements, future returns and volatility. This relation is
reinforced by two additional findings reported in previous literature. One is the negative correlation between returns and idiosyncratic volatility, confirmed by Ang et al. (2006) and Jiang et al. (2009); the effects of downgrades reported in this paper substantiate that correlation. The other is the leverage effect, first proposed by Black (1976) to explain the generally negative correlation between stock prices and volatility; this correlation is stronger as the firms’ debt-to-equity ratios increase. Blume et al. (1998), Amato and Furfine (2004), Jorion et al. (2009) and Güttler and Wahrenburg (2007) also demonstrate the negative influence of leverage on credit ratings. Hence, the evidence in this paper corroborates intuition raised by combined effects of leverage on ratings, returns and volatility.
Per agency, and particularly until one month after the announcement date, we find that downgrades by S&P imply more remarkable effects on volatility when compared with the other two agencies. In the case of Fitch, the effects remain insignificant, which is consistent with findings in Norden and Weber (2004). This is an additional important result of our paper, as it implies that it’s not only the type of news received by investors that influence volatility of returns; investors may also react depending on the agent issuing the news, meaning that ratings from different agencies do not have necessarily similar informational contents. We interpret the slightly greater effects of downgrades by S&P, when compared to those of Moody’s, with the somewhat lower average ratings of S&P in our sample. The relatively low representativeness in the study of Fitch’s announcements is an explanation for the generally low significance they reveal.
The paper also shows that higher volatilities of returns emerge in the case of small-size firms. Likewise, the lower is the announced rating level, the more volatile becomes the issuer stock’s return. In addition, a positive change in GDP increases the relative idiosyncratic volatility, but absolute idiosyncratic volatility is more likely to decrease, at least up to one month after the announcement. Therefore, cyclicality in relative idiosyncratic volatility is mostly due to absolute idiosyncratic volatility being less countercyclical than systematic volatility.
Extending the analysis to a framework with multiple contemporaneous announcements from different agencies, we detect that downgrades issued consistently by distinct agencies clearly amplify the effect over relative idiosyncratic volatility. When there is a lack of consensus in ratings from different agencies, the effects on volatility remain significant as long as the first agency announces a downgrade. Additionally, also when we allow for multiple rating announcements, the duration between announcements becomes statistically relevant, suggesting a negative relation with the volatility of returns; lower duration between
announcements means a higher flow of firm’s information generated from ratings and leads to higher return volatility.
Finally, drawing from Nelson’s EGARCH (Nelson, 1991), our specification of absolute idiosyncratic volatility encompasses lagged volatility among the explanatory variables. Consistent with the evidence in the literature about volatility of returns (e.g., Bollerslev, 1986; Glosten et al., 1993; Nelson, 1991), the results we obtain show that current volatility depends on the one-period lagged volatility; i.e. volatility clustering is quite significant.
Prior research on the effects of rating announcements on volatility of stock returns generally focus on restricted and small samples. For example, Abad and Robles (2012) also provide empirical evidence suggesting that rating changes affect asymmetrically volatility, but their analysis is confined to the Spanish stock market and to a sample of just 386 rating announcements. The vast majority of such announcements relates to the financial sector, reflecting the idiosyncrasies of Spanish bond issuers. Kliger and Sarig (2000) restrict the analysis to deviations from investors’ expectations in ratings of 118 firms. Fulop (2007) finds evidence of influence of downgrades from investment grade to speculative grade in 168 firms, but does not investigate upgrades and other type of downgrades. Hooper et al. (2008) and Brooks et al. (2012) analyze as well the effects of rating announcements on stock volatility, although their study centers only on the effects over systematic volatility.
The remainder of the paper is organized as follows. Section 1.2 reviews the main findings reported in previous literature about the stock price reactions to credit rating announcements. Section 1.3 describes the methodological principles adopted in the study for empirical analysis. The data selected and descriptive statistics are reported in Section 1.4. In Sections 1.5 and 1.6, we present regression results, respectively, for absolute and relative idiosyncratic volatility, and examine their implications. Section 1.7 concludes.
1.2 Related literature
Relevant corporate news is a potential trigger of corporate credit rating announcements. It is not unexpected, therefore, that significant financial effects emerge near the date of the announcement; still, it is not so evident how, when and where these effects take place exactly. The need for evidence concerning the linkage between announcements and financial effects opened an avenue for research dating back from the 1970’s. Most of it focuses on the effects on asset price returns, of which we highlight the case of stocks.
Previous literature generally underlines abnormal effects of negative announcements in terms of returns. Usually based on event study methodology that calculates cumulative abnormal returns, results reported to date suggest that stock returns overreact negatively to rating downgrades. However, a symmetric overreaction is not witnessed in upgrades. Striking evidence about this asymmetry is in Pinches and Singleton (1978), Griffin and Sanvicente (1982), Holthausen and Leftwich (1986), Hand et al. (1992), Goh and Ederington (1993), Dichev and Piotroski (2001), Norden and Weber (2004), and in Jorion and Zhang (2007).
Goh and Ederington (1993) complement by adding that downgrades related with deteriorations in the firm's financial prospects lead to negative market reactions, whereas those associated to an increase in leverage generate non-significant reactions. Dichev and Piotroski (2001) also report how the effects vary after the downgrade. The negative abnormal stock returns last at least a year after the downgrade and may be as low as -14 percent during that period, despite being more remarkable in the first months. According to them, abnormal returns associated to a downgrade are also more negative for small and low-credit-quality firms. Comparing rating changes and reviews for rating changes from the three major agencies, Norden and Weber (2004) find that negative announcements from S&P and Moody’s relate to abnormally low returns around the announcement; no significance is detected however relative to announcements by Fitch.
Ederington and Goh (1998) advance two main reasons for the returns overreaction to negative ratings changes. The first is that markets receive valuable new information when agencies release negative announcements about the issuer; they have access to private information that rated firms are typically averse to disclose directly to the market. The second is that, due to reputational concerns, the agencies expend more resources in detecting deterioration in credit quality than improvements. Jorion et al. (2005) additionally interpret the “downgrade effect” and the implicit fall in stock prices as the capitalized value of higher borrowing costs of the issuer. They conclude that, after a SEC regulatory change in 2000, the consequences of rating downgrades became larger than before and that market reaction to upgrades started to be significant.1
Consistent with previous literature, Jorion and Zhang (2007) confirm the asymmetric return response to rating announcements. However, they also find some relevant effects following upgrades, despite these are much lower than those from downgrades. They reveal that asymmetry of effects hinges on the rating level prior to announcement, wherein effects of
1 In 2000, the Regulation Fair Disclosure attributed a favored position to the rating agencies comparatively to
downgrades in low-rated issuers are greater. An explanation, suggested by these authors, is that a downgrade by one notch for a low-rated firm implies an absolute greater variation in the implicit probability of default, than what happens in a similar downgrade applied to a high-rated firm. As a reflection of the higher magnitude on the probability of default, larger impacts arise in bond yield spreads and on stock prices.
If the investigation on effects that ratings changes produce on stocks returns is abundant, the same does not happen in what concerns to volatility of returns. Yet, some interesting findings have been already reported. For example, Kliger and Sarig (2000) examine the effects generated by rating deviations from investors’ expectations on the volatilities implied by 118 option prices on stocks. Using Moody’s announcement of refined ratings on April 26, 1982, and computing implied volatilities on a 5-day window around that date, they find that a decline (rise) on volatilities follows better (worse) than expected refined ratings.2 Other works include Fulop (2006), which explores the existence of feedback effects of rating downgrades and finds support for an increase in volatility around the announcement of downgrades. Because his sample is composed of 168 U.S. public firms which were downgraded from investment to speculative grade, he does not quantify the impact of upgrades. Focusing on Spanish issuers, Abad and Robles (2012) report evidence of a reduction in both systematic and unsystematic risk following positive rating announcements, which include rating changes, rating watches and rating outlooks. Regarding negative announcements, they reveal a rebalancing of the systematic and unsystematic risk, with systematic risk increasing after the announcement, whereas the reaction in unsystematic risk is not so clear as it might decrease depending on the methodology of analysis they use.
With regard to sovereign ratings, Hooper et al. (2008) determine that downgrades (upgrades) contribute to a significant increase (decrease) in stock index returns volatility, although the effect is again more prominent in the case of downgrades. A similar conclusion is reached by Brooks et al. (2012), who confirm that rating levels have a significant negative relationship with realized volatilities among national stock markets. It seems, therefore, that sovereign ratings announcements have an impact on market and systematic volatility. Overall, these references contribute to the hypothesis that ratings convey relevant information to financial markets, which appears to materialize not only in abnormal returns, but also in volatility patterns of returns.
2 In this case, the 5-day window compares the volatility on the five trading days prior the announcement with the
1.3 Methodology
Consider a market model adjustment for a stock’s return,
𝑟𝑖,𝑡 = 𝛼𝑖+ 𝛽𝑖𝑟𝑚,𝑡+ 𝜀𝑖,𝑡 (1.1)
where 𝑟𝑖,𝑡 and 𝑟𝑚,𝑡 are respectively the stock’s return of firm 𝑖 and the market’s return, both observed in time period 𝑡; 𝛼 and 𝛽 are parameters and 𝜀 is an error term. The variation of the firm’s stock return may be both market-related as well as firm-specific. Correspondingly, computing volatility as the variance of returns and assuming COV(𝑟𝑚, 𝜀𝑖) = 0, the total
volatility of stock 𝑖’s return, 𝜎𝑖2, splits into the non-diversifiable or systematic volatility and the idiosyncratic volatility, as shown below
𝜎𝑖2 = 𝛽𝑖2𝜎𝑚2 + 𝜎𝜀2𝑖 (1.2)
𝜎𝑚2 denotes the market-wide volatility, 𝛽𝑖2𝜎𝑚2 expresses firm 𝑖’s systematic risk, whereas 𝜎𝜀2𝑖 is
the firm’s idiosyncratic volatility. The latter is the variation in the firm’s return explained by idiosyncratic factors, such as firm-specific news (e.g. announcements on its ratings). Its calculation is given by the difference between the observed return and the correspondent estimated return, 𝑟𝑖,𝑡 − 𝑟̂𝑖,𝑡, which is precisely the residual of a regression applied to equation
(1.1). The idiosyncratic volatility of firm 𝑖’s return is therefore the variance of that residual.
1.3.1 Absolute idiosyncratic volatility
A classical approach to analyze volatility of returns resides in modeling absolute volatility. Numerous approaches use the exponential generalized autoregressive conditionally heteroskedastic (EGARCH) approach, proposed by Nelson (1991). This model reflects evidence of stock return volatility upsurges following bad news and volatility decreases when good news are disclosed (e.g., Braun et al., 1995). Likewise, volatility exponentially modeled adds the appealing property that no parameter restrictions are needed to ensure positiveness of estimated variances. The log transformation of volatility, which emerges in the linearized version of this model, also diminishes the risk of potential heteroskedasticity problems.
Previous literature on absolute volatility of returns points to volatility clustering, confirming a somehow predictable behavior of variance (see, for example, Engle, 1982; Bollerslev, 1986; Glosten et al., 1993; Nelson, 1991). An important predictor of future variance of returns lies, therefore, in past history of returns. Glosten et al. (1993) extend this
analysis by showing that other explanatory variables have also significant effects on volatility of stock returns.
Hence, in order to analyze the absolute idiosyncratic volatility, we add the lagged idiosyncratic volatility to an exponential model which measures the effects of rating announcements on stock’s return volatility. Denoting 𝑡 as the day when firm 𝑖 has been given a rating announcement, and allowing for the impact of ratings through time to be measured in the time window 𝑁, we model absolute idiosyncratic volatility as
ln(𝜎𝜀2𝑖,𝑡+𝑁) is the natural logarithm of idiosyncratic volatility estimated in [𝑡; 𝑡 + 𝑁]. For each
𝑁, we compute the idiosyncratic volatility after the announcement (𝜎𝜀2𝑖,𝑡+𝑁), as well as the
lagged idiosyncratic volatility (𝜎𝜀2𝑖,𝑡); no overlapping and no gap either exist between 𝜎𝜀2𝑖,𝑡+𝑁
and 𝜎𝜀2𝑖,𝑡. The idiosyncratic volatility is computed based on equation (1.2) and on the sample variances of the firm’s daily return, and the daily return of the Standard & Poor's Composite Index, as reported by CRSP. 𝑍𝑗,𝑖,𝑡 stands for each of the 𝑠 control variables, which include rating covariates. 𝜃1, 𝜃2 and 𝜇𝑗 are parameters; ν𝑖,𝑡+𝑁 is the regression error.
To measure the effect of each type of announcement, 𝑍𝑗,𝑖,𝑡 includes dummies for upgrades
and downgrades; all dummies equal 1 when the variable they refer to is observed and 0 when it is not. In addition, based in Norden and Weber (2004), which underscore the significance of the source of announcement, we evaluate the extent to which the agency making the announcement is relevant to explain stock volatility; specific dummies are accordingly defined. Motivated by the findings of Jorion and Zhang (2007), confirming that lower rated firms reveal a greater negative stock return reaction to downgrades, we add the announced rating level to evaluate the respective effects on volatility.
The analysis also allows for asymmetries of information between issuers and investors. For example, as seen in Behr and Güttler (2008), reactions in the stock market to rating announcements indicate that smaller firms exhibit higher informational opaqueness than larger companies; the opaqueness is more pronounced in some sectors than others. Less precise evidence about a firm’s risk in smaller firms and in some sectors explains why the disclosure of new relevant information, especially when it conveys negative news, has a greater impact on volatility. Therefore, we measure size effects and evaluate the relevance of the sector of activity.
ln(𝜎𝜀2𝑖,𝑡+𝑁) = 𝜃 1+ 𝜃2ln(𝜎𝜀𝑖,𝑡 2 ) + ∑ 𝜇 𝑗𝑍𝑗,𝑖,𝑡 𝑠 𝑗=1 + ν𝑖,𝑡+𝑁 (1.3)
The same rationale concerning asymmetric information might be applicable to the frequency of announcements, assuming that, the more often the information is conveyed to investors, the more informed they should remain. Likewise, the lower is the distance or duration between ratings announcements, the more informed investors should be in relation to the firm. In such circumstance, the news disclosed should be less unexpected. However, if ratings announcements wield indeed significant effects on volatility, the conclusion might be too that higher stock return volatility reflects a lower duration between announcements. Consequently, it seems a priori relevant to test the extent to which volatility differs due to rating duration. In this case, duration denotes the number of years since the last rating announcement, regardless of the agency concerned. As we endeavour to gauge the effects of rating announcements, and bearing in mind the fact that such announcements are supposed to incorporate already the firm’s main idiosyncratic factors, we do not add further firm-specific information to the covariates.
Given the potential influence on ratings brought by changes in Gross Domestic Product (Güttler and Wahrenburg, 2007), and assuming that investors’ stock price expectations vary with the economic context, we further allow the effects of ratings announcements on volatility to differ depending on changes in GDP. This assumption is also supported by the relatively long time span of our sample, together with findings from Schwert (1989), revealing that market volatility is higher during recessions. In this regard, we test if the effects of rating announcements change with macroeconomic dynamics, by adding as covariate the quarterly change in real U.S. GDP corresponding to the quarter when the announcement occurs.
Finally, we bear in mind the results in Dichev and Piotroski (2001), highlighting the more pronounced rating effects on returns in the first months after the announcement. Consistent with this, our paper evaluates differences in volatility corresponding to distinct time windows. To draw conclusions about such question, we split the analysis in time windows 𝑁 of 30 and 90 days, within each window computing the respective volatility, which brings forth separate estimates of the parameters relative to equation (1.3).
1.3.2 Relative idiosyncratic volatility
To obtain a broader perspective on the effects that ratings may exert on volatility, we draw from previous literature to investigate relative idiosyncratic volatility of returns. This line of research is pioneered by Roll (1988). Focusing on the influence of firm’s idiosyncratic factors to explain stock price variations, he investigates the extent to which firm-specific news
explain divergences in the 𝑅2 of the market model, as described by equation (1.1), when applied to different firms. The higher is 1 − 𝑅𝑖2, the greater will be the influences of firm 𝑖’s specific information over its specific stock returns variation. Using the adjusted 𝑅𝑖2, represented as 𝑅̅𝑖2, we obtain that 1 − 𝑅̅𝑖2 =𝜎2𝜀𝑖⁄𝜎𝑖2, from where we may assess the relation between 1 − 𝑅̅𝑖2 and 𝑅̅ 𝑖 2, as 1 − 𝑅̅𝑖2 𝑅̅𝑖2 = 𝜎𝜀2𝑖 𝛽𝑖2𝜎 𝑚2 = 𝜎𝜀2𝑖 𝜎𝑖2− 𝜎 𝜀2𝑖 , 𝜎𝑖 > 𝜎𝜀𝑖 (1.4)
This implies that the previous relation is equivalent to firm-specific stock return volatility, measured relative to systematic volatility. Studying the influence on returns exerted by specific idiosyncratic features of the firm, Morck et al. (2000), Durnev et al. (2004), as well as Ferreira and Laux (2007), select as variable of interest such measure of volatility, which we call the relative idiosyncratic volatility.
We adopt a similar analysis, in order to reinforce the role of firm-specific information as a determinant of idiosyncratic volatility and to control for market volatility. The higher are values of relative idiosyncratic volatility, the smaller will be the proportion of total stock return variation described by market-wide variation, comparatively to what is explained by firm-specific variation.
Given that 1 − 𝑅̅𝑖2 is bounded within the interval [0; 1], and in line with Morck et al. (2000), Durnev et al. (2004), and Ferreira and Laux (2007), we apply natural logarithms to equation (1.4), obtaining a logistic transformation of 1 − 𝑅̅𝑖2. By adjusting the dependent variable, we hope as well to obtain skewness and kurtosis closer to a normally distributed variable, and therefore avoid a highly skewed error distribution that may compromise the interpretation of the estimates in the model. In addition, the logarithmic transformation of (1.4) reduces the risk of obtaining heteroskedastic residuals. The resulting dependent variable, identified as the logistic relative idiosyncratic volatility, is thus as follows
Ψ𝑖 ∶= ln(𝜎𝜀2𝑖) − ln(𝛽
𝑖2𝜎𝑚2) , Ψ ∈ ℝ (1.5)
We should note that due to the application of logarithms to relative idiosyncratic volatility, negative values of Ψ𝑖 will arise whenever firm-specific volatility is lower than systematic volatility, i.e. when 𝜎𝜀2𝑖 < 𝛽
𝑖2𝜎𝑚2.
𝜃 and 𝛿𝑗 (𝑗 = 1, … , 𝑘) are parameters, Ψ𝑖,𝑡+𝑁 is estimated in [𝑡; 𝑡 + 𝑁], 𝑡 is the
announcement date relative to firm 𝑖, and 𝑁 = {30; 90}. For each 𝑁, we estimate the logistic relative idiosyncratic volatility after the announcement (Ψ𝑡+𝑁), and the lagged logistic relative idiosyncratic volatility (Ψ𝑡). 𝑋𝑗,𝑖,𝑡 denotes control variables, which include rating
covariates, such as dummies for upgrades and downgrades, and ξ𝑖,𝑡𝑖+𝑁 is the regression error.
1.4 Data and descriptive statistics
1.4.1 Data
The empirical analysis in this paper is based on ratings information from Moody’s Default & Recovery Database, the database of S&P Capital IQ, and Bloomberg (RATC: Company Credit Rating Changes); the latter is the source used for ratings issued by Fitch. Information on each firm’s stock price daily return and on S&P’s Composite Index daily return derives from CRSP. To measure the firm’s size, we obtain the firm’s assets from COMPUSTAT. We also retrieve the quarterly GDP change from the Bureau of Economic Analysis (U.S. Department of Commerce); the information pertains to the seasonally adjusted annual rate based on chained 2005 dollars.
Following previous ratings literature (e.g., Amato and Furfine, 2004; Jorion and Zhang, 2007), we assign to each rating level a score that replicates the order of each rating letter and rating modifier. In this paper, we consider 22 rating classes. The highest rating available for each agency corresponds to 1 (i.e., rating AAA from S&P or Fitch, and rating Aaa from Moody’s), the second highest rating matches 2 (i.e., rating AA+ from S&P or Fitch and rating Aa1 from Moody’s), and so forth. The worst rating, which stands for default, is the 22nd class.
The sample of ratings refers to U.S. firms with at least one rating assigned by Moody’s, S&P or Fitch, between January 1990 and February 2012. This sample encompasses firms listed or which have been listed in this time period in the NYSE, AMEX or NASDAQ, according to CRSP. As in previous literature (e.g., Hull et al., 2004; Jorion and Zhang, 2007; Hooper et al., 2008), we initially restrict the sample to unique rating events within 𝑁. Unique announcements are those that have not been preceded or followed by other rating events related with the same firm, in the interval [𝑡 − 𝑁; 𝑡 + 𝑁]. The selected cases lead to two
Ψ𝑖,𝑡+𝑁 = 𝜃 + ∑ 𝛿𝑗𝑋𝑗,𝑖,𝑡 𝑘
subsamples for announcements, one for 𝑁 = 30 and the other for 𝑁 = 90. In order to evaluate the effects when more than one agency makes announcements within the same timeframe, we extend subsequently the sample for 𝑁 = 30 to include all rating announcements observed in that timeframe.
In order to directly evaluate the significance of the potential effects of downgrades and upgrades, we allow for all type of announcements, including situations where rating is left unchanged. Such situations may occur whenever the same issuer has more than one long term rated obligation (with similar seniority) and subsequent ratings announced by one agency for these obligations are equal. An additional explanation for unchanged ratings lies in announcements of rating outlooks, the majority of them “Stable”. Accordingly, if an announcement occurs due to a rating outlook, we classify it as rating unchanged.
Consistent with the previous time intervals, the extraction of market information refers to the time windows of 30 and 90 calendar days. Within each window, we calculate the daily volatility of the firm’s stock price returns prior and after an announcement. Among the firms in CRSP, some have insufficient market information around the announcement date, because either the oldest date or the most recent one with market information are less distant than 30 or 90 days relative to the announcement date. To overcome this problem, but at the same time avoid losing relevant information, when focusing the analysis on 𝑁 = 30 we remove from the sample announcements without at least a minimum window size of 10 days for returns; 30 days is the minimum size when dealing with 𝑁 = 90.
1.4.2 Descriptive statistics of ratings
From a total of 36,337 initially detected rating announcements, issued by the three agencies between January 1990 and February 2012, we restrict the samples to 9,237 rating announcements when considering the 30-day time window; 3,974 is the number of announcements for the 90-day time window. Figure 1.1 displays the yearly distribution of rating announcements in each case. Excluding the first years and 1999, the figure shows relatively well spread distributions of announcements, especially in the 90-day window.
Figure 1.1: Yearly distribution of rating announcements
When we detail the yearly distribution per type of announcement, we find that downgrades prevail when the economy deteriorates; in economic expansions upgrades are prominent. For example, in the mid-nineties, when the economy was booming, the number of upgrades per each downgrade topped 1.45, considering the 30-day window; conversely, during the downturn of 2001 this relation fell to a minimum of 0.34. The representativeness of information, which substantially lowers the risk of biased conclusions, is equally confirmed by the number of firms: the subsample of 30-day time window comprises 1,921 firms, whereas the 90-day window reaches 1,619 firms.
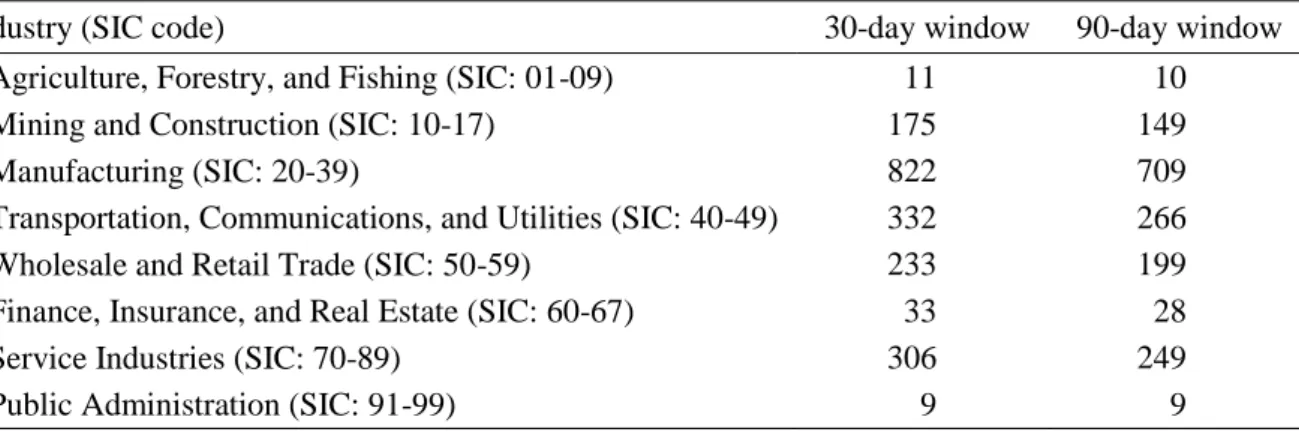
Table 1.1 illustrates the respective distribution per industry, from where we observe a high proportion of firms belonging to Manufacturing.
Table 1.1: Distribution of firms per industry
This table reports the distribution of firms per industry in the 30-day and 90-day samples, with information aggregated at the first two digits of the SIC code.
Industry (SIC code) 30-day window 90-day window
Agriculture, Forestry, and Fishing (SIC: 01-09) 11 10
Mining and Construction (SIC: 10-17) 175 149
Manufacturing (SIC: 20-39) 822 709
Transportation, Communications, and Utilities (SIC: 40-49) 332 266
Wholesale and Retail Trade (SIC: 50-59) 233 199
Finance, Insurance, and Real Estate (SIC: 60-67) 33 28
Service Industries (SIC: 70-89) 306 249
Public Administration (SIC: 91-99) 9 9
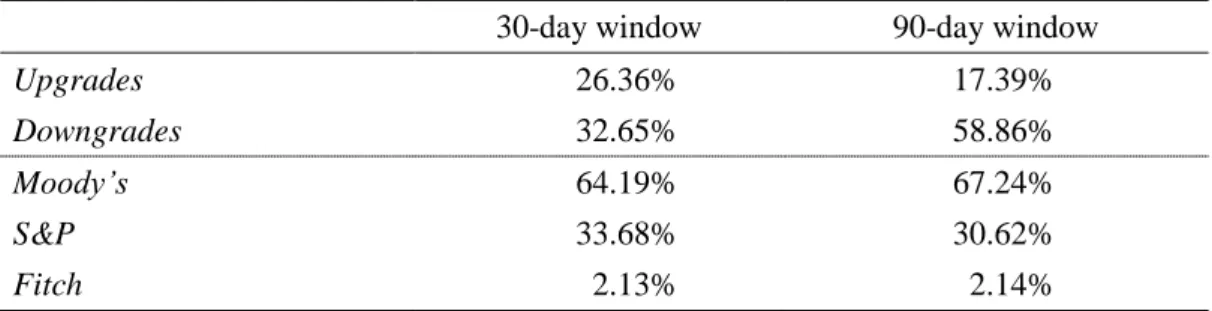
Information concerning the distribution of ratings per direction or type of announcement and per rating agency is in Table 1.2. The values reported confirm that downgrades clearly
0 100 200 300 400 500 600 700
exceed upgrades, especially in the 90-day window sample; the remaining type of announcements includes all situations where rating is left unchanged. The high proportion of downgrades is consistent with descriptive statistics in Norden and Weber (2004); specifically, they analyze ratings from 2000 to 2002 and report a total of downgrades six-fold the number of upgrades. The number of announcements of Moody’s largely outweighs those of S&P and, in particular, of Fitch, the latter representing a marginal weight. The representativeness of information from this agency becomes more relevant from 2000 onwards, after the significant corporate reorganization it went through in 1998.
Table 1.2: Distribution of announcements
This table illustrates the percentage of announcements per direction of change and rating agency. 30-day window 90-day window
Upgrades 26.36% 17.39%
Downgrades 32.65% 58.86%
Moody’s 64.19% 67.24%
S&P 33.68% 30.62%
Fitch 2.13% 2.14%
In order to detect patterns in rating announcements, we analyze the distribution of changes between consecutive ratings. Accordingly, we build transition matrices for the 30-day and 90-day time windows, with ratings distributed according to the letters; that is, rating modifiers are grouped. The grouping in the ratings of S&P(Fitch)/Moody’s and its correspondence with the score or numeric scale is as follows: AAA/Aaa = 1; AA/Aa = 2-4; A/A = 5-7; BBB/Baa = 8-10; BB/Ba = 11-13; B/B = 14-16; CCC/Caa = 17-19; CC-D/Ca-C = 20-22. Due to the respective small number of cases they contain, the lowest ratings are grouped too. Tables 1.3a and 1.3b display the results, from where we are able to evaluate the level of rating stability.
Reporting relatively similar distributions, both tables place the majority of ratings in the middle of the rating scale, with near 75% of all announcements in the rating interval between levels 8 and 16 (Figure 1.2). Likewise, relative stability is evidenced from the almost inexistent changes far from the main diagonal of the transition matrices; as a reference, around 40% of announcements denote maintenance of the prior rating.
Table 1.3a: Transition matrix for the 30-day window
Tables 1.3a and 1.3b describe the observed rating changes respectively for the 30-day and 90-day samples. Ratings are grouped according to the letters and are represented by their respective score. Except where denoted, values in the matrices are percentages.
Prior rating Announced rating Number
of ratings 1 2-4 5-7 8-10 11-13 14-16 17-19 20-22 1 75.4 11.5 8.2 4.9 - - - - 61 2-4 1.2 79.1 16.2 3.2 0.3 - - - 345 5-7 0.1 1.4 79.7 17.1 1.2 0.3 0.1 - 1,557 8-10 0.1 0.0 6.5 78.3 11.6 2.8 0.6 0.1 2,237 11-13 - - 0.4 12.0 60.8 24.9 1.7 0.2 2,029 14-16 - - 0.1 0.9 18.1 68.5 10.9 1.5 2,577 17-19 - - - 0.3 5.2 38.7 46.3 9.4 382 20-22 - - - - 6.1 32.7 32.7 28.6 49 Number of ratings 55 303 1,458 2,300 2,001 2,500 524 96 9,237 Table 1.3b: Transition matrix for the 90-day window
Prior rating Announced rating Number
of ratings 1 2-4 5-7 8-10 11-13 14-16 17-19 20-22 1 82.1 7.1 7.1 3.6 - - - - 28 2-4 2.2 76.1 17.4 2.9 1.4 - - - 138 5-7 0.2 0.8 82.8 14.5 1.2 0.3 0.2 - 647 8-10 0.1 - 5.5 85.6 6.9 1.6 0.2 - 938 11-13 - - 0.3 8.6 78.8 10.8 1.4 - 858 14-16 - - 0.1 0.9 10.6 82.6 5.3 0.4 1,198 17-19 - - - 1.4 1.4 20.9 74.3 2.0 148 20-22 - - - 10.5 10.5 78.9 19 Number of ratings 28 112 618 989 880 1,133 191 23 3,974
Figure 1.2: Distribution of credit ratings per rating class
The outcomes in the previous transition matrices do not differ much from the empirical evidence towards stability of ratings reported in prior literature for the one-year transition
0% 5% 10% 15% 20% 25% 30% 1 2-4 5-7 8-10 11-13 14-16 17-19 20-22
analysis (e.g., Nickell et al., 2000; Altman and Rijken, 2004). Such comparison of results extends to the detection of higher volatility of rating transitions in the lower graded classes. In fact, although not evidenced by the 90-day window, the transition matrix for the 30-day window reveals a reduction in the percentage of cases that remain in the prior class when credit quality declines. Despite the closeness between our results and those of prior research, we should stress that, contrary to such research, there is not a fixed time horizon in our rating matrices. The potential differences that subsequently might emerge are lessened, however, by the relatively similar duration of announcements (average duration near one year; see Table 1.4), at least in the 30-day window.
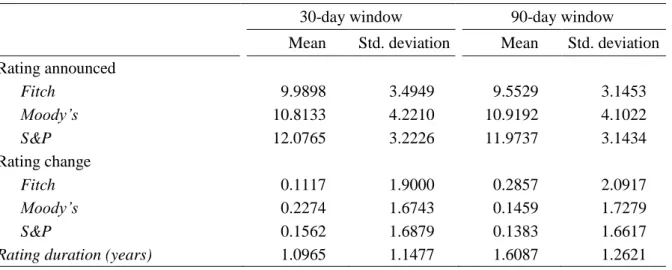
Table 1.4 provides additional details about announcements per agency. We note that the overall mean of announced ratings is near the transition levels to speculative grade. In addition, on average, S&P seems to apply slightly lower levels (higher score), corresponding to a rating close to BB (Ba2 in Moody’s notation), the second level of the speculative grade. In contrast, Fitch’s ratings are nearer to BBB- (Baa3 in Moody’s notation), the last level of the investment grade. The mean of ratings changes, positive in all cases, points to slight downgrades both in the shortest and longest time windows.
Table 1.4: Descriptive statistics of rating announcements
This table displays the mean and the standard deviation of ratings announced per agency.
30-day window 90-day window
Mean Std. deviation Mean Std. deviation Rating announced Fitch 9.9898 3.4949 9.5529 3.1453 Moody’s 10.8133 4.2210 10.9192 4.1022 S&P 12.0765 3.2226 11.9737 3.1434 Rating change Fitch 0.1117 1.9000 0.2857 2.0917 Moody’s 0.2274 1.6743 0.1459 1.7279 S&P 0.1562 1.6879 0.1383 1.6617
Rating duration (years) 1.0965 1.1477 1.6087 1.2621
1.4.3 Descriptive statistics of volatilities
Selecting as reference the 30-day window, we calculate the monthly average annualized volatilities of daily returns along the observation period. Figure 1.3a displays the evolution of absolute idiosyncratic volatility (𝜎𝜀2), the systematic volatility (𝛽2𝜎𝑚2) and total firm risk (𝜎2),
whereas Figure 1.3b exhibits the evolution of the logistic relative idiosyncratic volatility, ln[𝜎𝜀2/(𝛽2𝜎
𝑚2)]. With all values of volatility winsorized at the bottom and top 1% levels, both
figures refer to 𝑡 + 30.
Figure 1.3a: Average absolute annualized volatilities (30-day window)
Figure 1.3b: Average logistic relative idiosyncratic volatility (30-day window) 0% 30% 60% 90% 120% 150% 180% -1 0 1 2 3 4 5
As depicted by Figure 1.3a, there is striking evidence of abnormal volatilities in periods of major economic crises, such as in 2001 and 2007-2008. Also revealing the presence of volatility clustering, this evidence is applicable not only to the systematic risk, but also and especially to the firm's idiosyncratic risk, and consequently to the total firm risk. Moreover, there is some suggestion of rising volatilities even before crises mature. Yet, in what concerns the logistic relative idiosyncratic volatility, the evolution seems to be somewhat unaffected by the occurrence of major crises (Figure 1.3b). This should reflect the fact that, when computing relative idiosyncratic volatility, the effects of such crises are already mostly incorporated in systematic risk. We expect therefore the relative idiosyncratic volatility and the rebalancing of the total risk of the firm to be determined primarily by firm-specific factors, some of which may nonetheless be somewhat influenced by economic cycles.
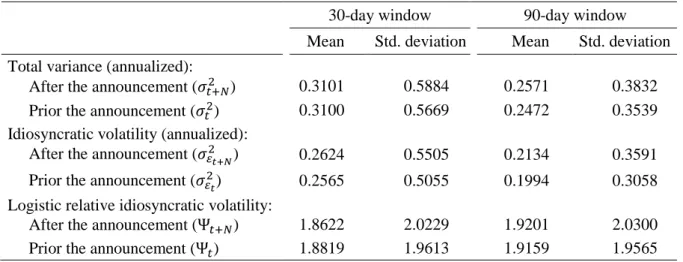
Table 1.5 includes the volatility levels prior and after ratings announcements. The table shows that total volatility mostly reflects the influence of idiosyncratic volatility; 76% (77%) of the variations in total volatility is explained by idiosyncratic volatility in our 30-day (90-day) sample. The annualized mean idiosyncratic volatility reported in the table (approximately, 26%), is above the 19.4% reported in Ferreira and Laux (2007), mostly due to the distinct periods analysed. For example, our sample covers 2007 and 2008, a period characterized by remarkably high volatilities in the stock markets, not included in their study.
Table 1.5: Descriptive statistics of volatility
This table displays the mean and the standard deviation of volatilities.
30-day window 90-day window Mean Std. deviation Mean Std. deviation Total variance (annualized):
After the announcement (𝜎𝑡+𝑁2 ) 0.3101 0.5884 0.2571 0.3832
Prior the announcement (𝜎𝑡2) 0.3100 0.5669 0.2472 0.3539
Idiosyncratic volatility (annualized):
After the announcement (𝜎𝜀2𝑡+𝑁) 0.2624 0.5505 0.2134 0.3591
Prior the announcement (𝜎𝜀2𝑡) 0.2565 0.5055 0.1994 0.3058
Logistic relative idiosyncratic volatility:
After the announcement (Ψ𝑡+𝑁) 1.8622 2.0229 1.9201 2.0300
Prior the announcement (Ψ𝑡) 1.8819 1.9613 1.9159 1.9565
In what concerns mean volatility prior and after the announcement, the evidence suggests a slightly higher idiosyncratic volatility after the announcement, both in the 30 and 90-day windows. Actually, in the longer term, all indicators of volatility are higher than what the period prior the announcement reflects. However, in the shortest term of 30 days, the relative
idiosyncratic volatility is somewhat lower. Note that such results may reflect mixed influences, namely those from upgrades and downgrades. Therefore, to achieve a precise outlook on the distinct reactions in volatilities of returns following rating announcements, we need to take into account the type of announcements and control for other potential determinants of volatility; the next sections report the results of such analysis.
1.5 Analysis of absolute idiosyncratic volatility
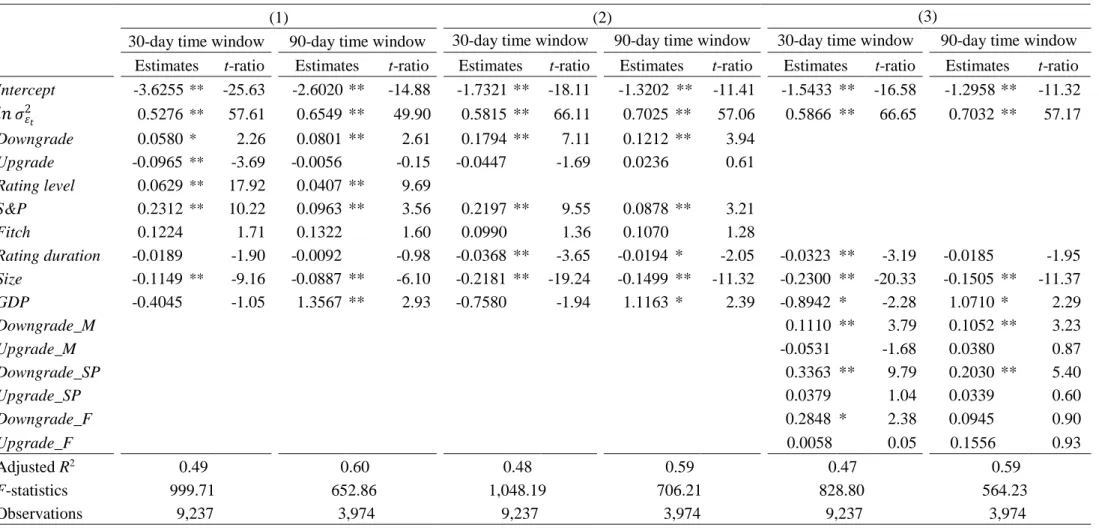
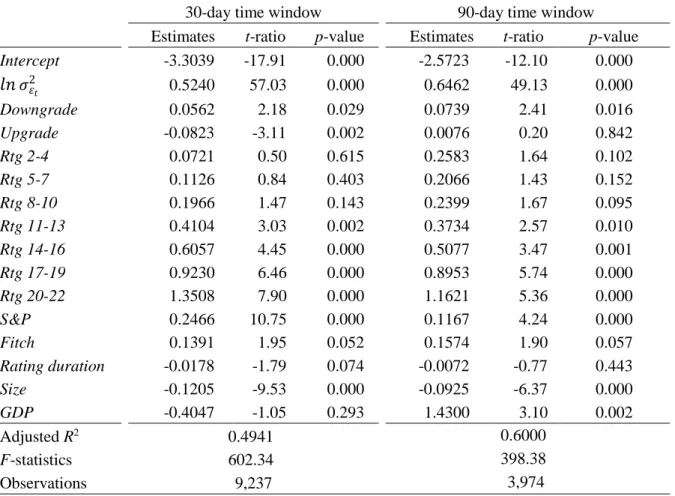
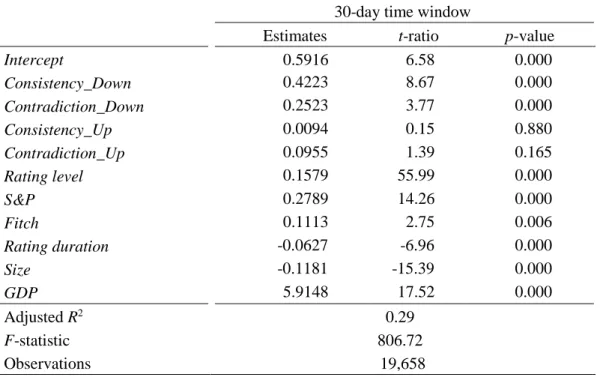
We estimate regression equation (1.3) using the 30-day and 90-day samples, and selecting three alternative sets of exogenous variables, so that a more complete understanding of the announcements' impact over absolute volatility comes out. In the first set we choose the following variables: dummies for downgrades, upgrades, S&P and Fitch, as well as the rating level and duration, the firm’s size, computed by the natural logarithm of firm’s assets, and the annualized quarterly change in real GDP.3 As we show in Section 1.6, the rating level expands the effect of rating downgrades; i.e., the worse is the rating announced the stronger is the effect of the downgrade. However, this probably means as well that a significant part of the true effect of downgrades is absorbed by the coefficient of the rating level. Therefore, we select a second group of variables by excluding the rating level from the previous set, so that coefficients related to the announcements incorporate all the effects generated by such announcements. For the last set of variables, we split the type of announcements per agency, which replace Downgrade, Upgrade, S&P and Fitch in the second set of variables.
Table 1.6 displays the results corresponding to the previous three sets of variables. In each set, the proportion of idiosyncratic volatility explained by the variation in covariates, as exhibited by the respective adjusted R-squared, confirms a better fitted regression in the longer time window; non-specified factors in the regressions seem to have lesser influence in the longer time window. We confirm that downgrades are always relevant, both in the shortest and longest time span. In addition, when the rating level is removed we detect a significant rise in the effects of downgrades over volatility, particularly in the 30 days after the announcement. Actually, in that time frame, a firm with a previous annualized idiosyncratic volatility near the average (26%), ceteris paribus will see an instantaneous effect on its volatility of 1.1794 26% = 30.66% if its ratings are downgraded. Yet, the effects of
3 We also test industry effects by including the sector of activity as potential covariate of volatility, defined
according to the first digit of the SIC code. No significant influences stand out however, both in the 30-day and the 90-day windows. Due to the respective very low t-ratios, implying no major differences in volatility per industry, we opt not to include that information in the model.
upgrades are not so evident; if we exclude the rating level or split the type of announcement per agency, upgrades actually become always non-significant at the 5% significance level.
The table also substantiates the influence of the agency making the announcement. Indeed, announcements by S&P produce the strongest effects on volatility of returns, namely when such announcements are downgrades. For example, considering the 30 days after announcement, when S&P downgrades an issuer whose annualized idiosyncratic volatility is again 26%, the respective instantaneous effects on volatility of stock returns will increase to 34.74%. This is above the average effect generated by downgrades during the same time span (as seen before, downgrades in general cause an increase in volatility up to 30.66%). The comparatively greater influence of S&P announcements on volatility is to some extent in line with Norden and Weber (2004), who point to announcements by S&P and Moody’s showing a greater impact on the stock price return than announcements by Fitch.
From the estimated parameter related with Size, we see that larger firms reveal lower volatility, which corroborates the higher informational opaqueness mentioned by Behr and Güttler (2008) for smaller firms. A 1 percentage point increase in a firm’s asset size reduces its idiosyncratic volatility of returns subsequent to rating announcements by as much as 23%; moreover, the effect of the asset size tends to diminish as we move away from the date of announcement, i.e. when we move to the 90-day window.
Regarding the influence of GDP change, we find no clear evidence. The coefficients are generally non-significant at the 1% significance level, and in the longest time window their respective signal is counterintuitive; indeed, in line with what we find in the 30-day time window, we expect that economic growth is countercyclical with volatility. The negative signal of the coefficient estimates related to Duration, especially in the second and third regressions, where we find statistically significant estimates, imply that more frequent announcements lead to more volatility of returns.
Table 1.6: Absolute idiosyncratic volatility regression estimates
This table reports Ordinary Least Squares estimates of regressions on absolute idiosyncratic volatility using three sets of variables. The explanatory variables comprise the prior idiosyncratic volatility (𝑙𝑛𝜎𝜀2𝑡), dummies for rating downgrades and upgrades, dummies for ratings by S&P and Fitch, and for rating downgrades
by Moody’s (Downgrade_M), S&P (Downgrade_SP) and Fitch (Downgrade_F), as well as for upgrades per agency (Upgrade_M, Upgrade_SP and Upgrade_F). Also included are the announced rating level, the number of years since the last rating (Rating duration), the log of the firm’s assets (Size), and the annualized quarterly change in real GDP; the latter is entered as decimals, not as percentage points.
(1) (2) (3)
30-day time window 90-day time window 30-day time window 90-day time window 30-day time window 90-day time window Estimates t-ratio Estimates t-ratio Estimates t-ratio Estimates t-ratio Estimates t-ratio Estimates t-ratio
Intercept -3.6255 ** -25.63 -2.6020 ** -14.88 -1.7321 ** -18.11 -1.3202 ** -11.41 -1.5433 ** -16.58 -1.2958 ** -11.32 𝑙𝑛𝜎𝜀2𝑡 0.5276 ** 57.61 0.6549 ** 49.90 0.5815 ** 66.11 0.7025 ** 57.06 0.5866 ** 66.65 0.7032 ** 57.17 Downgrade 0.0580 * 2.26 0.0801 ** 2.61 0.1794 ** 7.11 0.1212 ** 3.94 Upgrade -0.0965 ** -3.69 -0.0056 -0.15 -0.0447 -1.69 0.0236 0.61 Rating level 0.0629 ** 17.92 0.0407 ** 9.69 S&P 0.2312 ** 10.22 0.0963 ** 3.56 0.2197 ** 9.55 0.0878 ** 3.21 Fitch 0.1224 1.71 0.1322 1.60 0.0990 1.36 0.1070 1.28 Rating duration -0.0189 -1.90 -0.0092 -0.98 -0.0368 ** -3.65 -0.0194 * -2.05 -0.0323 ** -3.19 -0.0185 -1.95 Size -0.1149 ** -9.16 -0.0887 ** -6.10 -0.2181 ** -19.24 -0.1499 ** -11.32 -0.2300 ** -20.33 -0.1505 ** -11.37 GDP -0.4045 -1.05 1.3567 ** 2.93 -0.7580 -1.94 1.1163 * 2.39 -0.8942 * -2.28 1.0710 * 2.29 Downgrade_M 0.1110 ** 3.79 0.1052 ** 3.23 Upgrade_M -0.0531 -1.68 0.0380 0.87 Downgrade_SP 0.3363 ** 9.79 0.2030 ** 5.40 Upgrade_SP 0.0379 1.04 0.0339 0.60 Downgrade_F 0.2848 * 2.38 0.0945 0.90 Upgrade_F 0.0058 0.05 0.1556 0.93 Adjusted R2 0.49 0.60 0.48 0.59 0.47 0.59 F-statistics 999.71 652.86 1,048.19 706.21 828.80 564.23 Observations 9,237 3,974 9,237 3,974 9,237 3,974