i i
“main” — 2015/4/20 — 11:36 — page 419 — #1
i i
Revista Brasileira de Geof´ısica (2014) 32(3): 419-431 © 2014 Sociedade Brasileira de Geof´ısica ISSN 0102-261X
www.scielo.br/rbg
NICKEL PROSPECTIVE MODELLING USING FUZZY LOGIC ON NOVA BRASIL ˆANDIA
METASEDIMENTARY BELT, ROND ˆ
ONIA, BRAZIL
Lucas Barros de Andrade
1,3, Adalene Moreira Silva
2and Carlos Roberto de Souza Filho
3ABSTRACT.Multisource spatial data integration represents a common tool in mineral prospecting, especially with the advent of Geographic Information Systems (GIS), which allow manipulation, interpretation, analysis, integration and modelling of spatial data. The Nova Brasilˆandia Metasedimentary Belt (NBMB), located in SW Amazonian craton, is part of a geological context with considerable metallogenic potential for base metals, although significant deposits are not known yet. The present paper aimed to process aeromagnetometry and aerogammaspectrometry data for integration with geochemical and geological mapping campaigns in order to build a prospectivity model for nickel in the NBMB region of in a 1:500,000 scale. Using knowledge-driven approach modelling, fuzzy logic was chosen to combine geophysics, geochemistry and geological mapping data. As result, it was possible to build a prospectivity model for nickel, consistent with the distribution of nickel occurrences registered by the Geological Survey of Brazil (Servic¸o Geol´ogico do Brasil – CPRM), and which may guide detailed prospecting campaigns in the region.
Keywords: airborne geophysics, fuzzy logic, prospective modelling, metasedimentary belt, Nova Brasilˆandia.
RESUMO.A integrac¸˜ao de dados espaciais multifontes ´e ferramenta consagrada na prospecc¸˜ao mineral, especialmente com o advento dos Sistemas de Informac¸˜oes Georreferenciadas (SIG), que permitem a manipulac¸ ˜ao, interpretac¸˜ao, an´alise, integrac¸˜ao e modelagem de dados espaciais. O Cintur˜ao Metassedimentar Nova Brasilˆandia (CMNB), situado no SW do cr´aton amazˆonico, insere-se em contexto geol´ogico com consider´avel potencial metalogen´etico para metais b´asicos, ainda que dep´ositos expressivos n˜ao sejam conhecidos. O presente trabalho teve por objetivo processar dados de aeromagnetometria e aerogamaespectrometria para integrac¸˜ao de dados de campanhas de prospecc¸˜ao geoqu´ımica e mapeamento geol´ogico regionais a fim de construir um modelo de prospectividade para n´ıquel na regi˜ao do CMNB em escala 1:500.000. Foi adotada a abordagem guiada pelo conhecimento para a modelagem proposta, utilizando-se l´ogicafuzzypara combinar dados de geof´ısica, geoqu´ımica e mapeamento geol´ogico. Como resultado, foi poss´ıvel construir um modelo de prospectividade para n´ıquel, compat´ıvel com a distribuic¸˜ao de ocorrˆencias cadastradas pelo Servic¸o Geol´ogico do Brasil (CPRM), que pode nortear campanhas de prospecc¸˜ao de maior detalhe na regi˜ao.
Palavras-chave: aerogeof´ısica, l´ogicafuzzy, modelagem prospectiva, cintur˜ao metassedimentar, Nova Brasilˆandia.
1Departamento de Pol´ıcia Federal, Unidade T´ecnico Cient´ıfica da Delegacia de Pol´ıcia Federal em Mar´ılia/SP, Av. J´oquei Clube, 87, Bairro J´oquei Clube, 17521-450 Mar´ılia, SP, Brazil. Phone: +55(14) 3303-3033; Fax: +55(14) 3303-3031 – E-mail: lucas.lba@dpf.gov.br
2Universidade de Bras´ılia, Instituto de Geociˆencias, Campus Universit´ario Darcy Ribeiro s/n, 70910-900 Bras´ılia, DF, Brazil. Phone: +55(61) 3307-2877; Fax: +55(61) 3340-4759 – E-mail: adalene@unb.br
3Universidade Estadual de Campinas, Instituto de Geociˆencias, P.O. Box 6152, 13083-970 Campinas, SP, Brazil. Phone: +55(19) 3521-4535; Fax: +55(19) 3521-4552 – E-mail: beto@ige.unicamp.br
INTRODUCTION
Integration of multisource data as geophysics, geochemistry and remote sensing is a very common tool used in mineral prospec-tion. Initially performed in analog way by overlapping maps in lightboxes, recently significant advances have been reached by the use of Geographic Information Systems (GIS), which al-lows easier manipulation, interpretation, analysis, integration and modelling of spatial data involving math, logic and probabilistic (Bonham-Carter, 1994, 1997).
The Nova Brasilˆandia Metasedimentary Belt (NBMB), located in the Southwest of the Amazonian craton, presents considerable metallogenic potential for base metals (Rizotto, 1999), although significant deposits are not known yet. Therefore, corresponds to a Brazilian border where regional exploration works are indicated to select targets for detailed exploration.
This paper aims to process aerogeophysical data of the region NBMB and then integrate these data with stream sediments geo-chemical surveys and lithological mapping in order to develop, through fuzzy logic, a mineral prospectivity model for nickel (Ni) in the study area on a regional scale (1:500,000).
GEOLOGIC CONTEXT
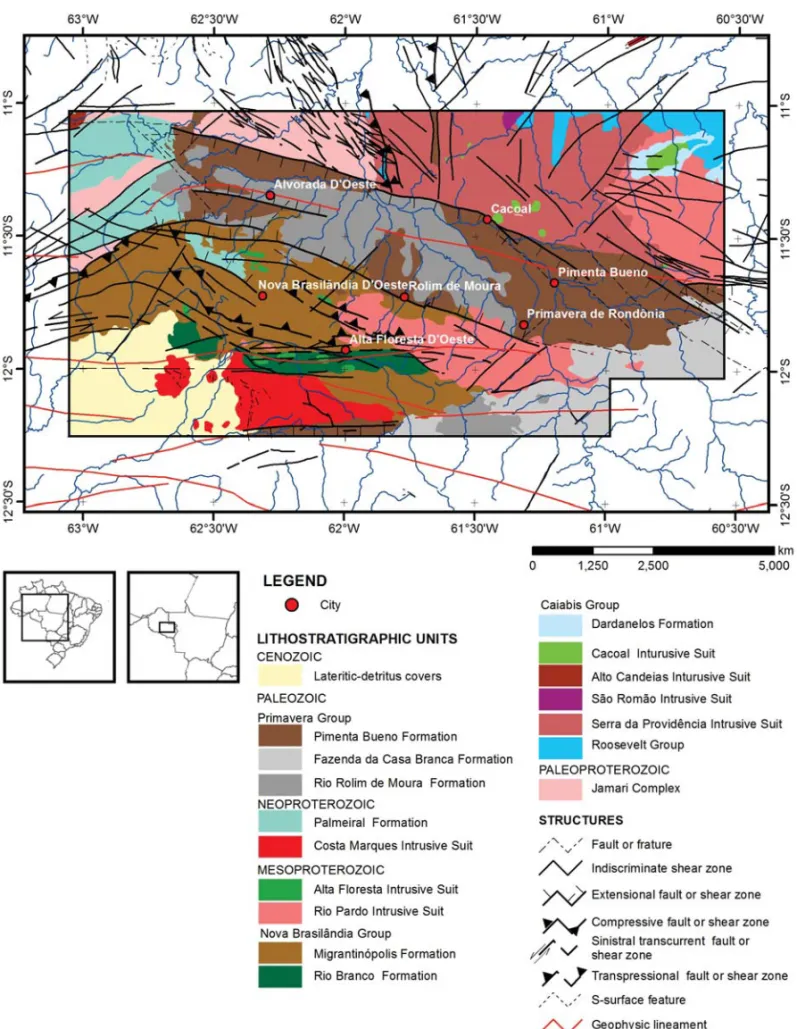
Figure 1 shows the geological map of the study area modified from Schobbenhaus et al. (2004). The regional geological con-text is related to the boundary between the Rondˆonia-Juruena and Suns´as Provinces (Santos, 2003), partially covered by Phanero-zoic sediments.
The Rondˆonia-Juruena Province is represented in the study area mainly (i) by Jamari Complex, consisting of felsic to inter-mediate polycyclic gneisses, metamorphosed and migmatizeds in amphibolite facies, (ii) Serra da Providˆencia Intrusive Suit and (iii) Roosevelt Group, respectively volcanic and plutonic compo-nents of the magmatic arc that encloses the tectonic structura-tion this province (Tohver et al., 2004). The intrusive suits S˜ao Rom˜ao, formed by metaplutonic high-K calc-alkaline rocks, Alto Candeias, composed by charnokitos and monzo to sieno grani-toids, and Cacoal, of basic to ultrabasic nature, are also part of the province, as well as sedimentary rocks of Dardanelos Forma-tion, base of the Caiabis Group (Schobbenhaus et al., 2004).
The Migrantin´opolis Formation, essentially composed by metasedimentary rocks, and the White River Formation, of intru-sive metabasic nature, are units of the Suns´as Province (Santos, 2003) and locally form the Nova Brasilˆandia Metasedimentary Belt (NBMB) (Rizzotto, 2001; Tohver et al., 2004). In this belt, numerous signs and occurrences of Au, Ni, Cu, Cr and Pt are
cataloged by the Geological Survey of Brazil (Servic¸o Geol´ogico do Brasil – CPRM) (Schobbenhaus et al., 2004). However, except for some artisanal gold mining, more expressive metallic deposits still unknown.
Granites of the Rio Pardo Intrusive Suit occur as oval bodies concordant with the foliation of host rocks and mark the end of the orogenic cycle that affected the NBMB in the Esteniano-Tonian limit (Scandolara, 1999; Rizzotto, 1999).
The Alta Floresta Intrusive Suit comprises a combination of basic rocks, which occurs as hectametric sills (Scandolara, 1999) and may be related to a later distensive stage in the Mesopro-terozoic orogeny (Rizzotto, 1999). The Costa Marques Intrusive Suit consists of subvolcanic granites, granofires, rhyolites, rhy-odacites, trachytes and lamprophyres dykes occurring as ellip-soidal to circular stocks (Scandolara, 1999). Teixeira and Tassi-nari (1984) obtained ages of 1018± 76 Ma for these rocks and suggest a correlation with the Younger Granites of Rondˆonia of Kloosterman (1968).
Many Neoproterozoic and Phanerozoic sedimentary units overlays older rocks in the SW Amazonian craton (Tohver et al., 2004). The oldest of them is the Palmeiral Formation, deposited in the Rondˆonia Basin, formed in the Paca´as Novos, Upioanes and St. Lawrence grabens (Scandolara, 1999). An expressive package of Paleozoic sedimentary rocks, deposited mainly in grabens di-rected WNW-ESSE (Pimenta Bueno Graben and Parecis Graben), comprise the Primavera Group, which includes Rio Rolim de Moura, Pimenta Bueno and Fazenda da Casa Branca Formations (Scandolara, 1999). The unit lateritic-detritus covers includes var-ied types of Cenozoic colluvial, eluviais, alluvial, lacustrine and swamp deposits (Rizzotto et al., 2000), beyond lateritic soils.
The structural setting observed in the area reflects the com-plex polycyclic tectonic evolution which affected the region be-tween the Paleo and Mesoproterozoic. Subparalelism bebe-tween deformational events and reactivation of older structures difficult the understanding of the geological history of the area.
In the Paleoproterozoic basement of Rondˆonia-Juruena Province (Santos, 2003), predominate NW shear zones developed during the structuring of Rio Negro Juruena Arc (Tohver et al., 2005).
At the end of the Mesoproterozoic, the development of NBMB was mainly in a sinistral transpressive regime that gen-erated extensive thrusting and dextral shear zones, with vergence to NE in the southern and SW in the northern of the belt (Tohver et al., 2004).
Extensional efforts at the end of the Precambrian were re-sponsible for the extensional reactivation of older structures and
i i
“main” — 2015/4/20 — 11:36 — page 421 — #3
i i
ANDRADE LB, SILVA AM & SOUZA FILHO CR
421
developement of normal faults on a large scale. This distensional phase formed a system of grabens, that includes Pimenta Bueno Graben, which came to be filled in the Phanerozoic.
AEROGEOPHYSICAL DATA
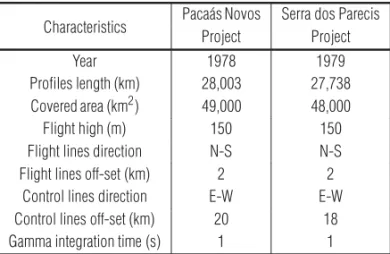
In this work, the authors used aeromagnetometric and aerogam-maespectometry data obtained by Geological Survey of Brazil – CPRM at the end of the 70’s. The study area is covered by to differ-ent surveys: Paca´as Novos Project and Serra dos Parecis Project, performed by GEOFOTO S/A. Table 1 shows the characteristics of both surveys, consistent with the scale proposed (1:500,000). The raw data were provided by the Geophysics Division of CPRM.
Table 1 – Characteristics of aerogeophysical surveys.
Characteristics Paca´as Novos Serra dos Parecis Project Project
Year 1978 1979
Profiles length (km) 28,003 27,738 Covered area (km2) 49,000 48,000 Flight high (m) 150 150 Flight lines direction N-S N-S Flight lines off-set (km) 2 2
Control lines direction E-W E-W Control lines off-set (km) 20 18 Gamma integration time (s) 1 1
The magnetometry data were received as anomalous mag-netic field values, already corrected IGRF. The gammaspectromet-ric data were received in separated channels for K, U and Th, in counts per second.
For using geophysical data, it was necessary to perform some pre-processing procedures, as interpolation, microniveling and geophysical surfaces generation, using the Oasis Montaj, Geosoft Inc. software.
Preprocessing steps include the construction of a digital database containing the geophysical data of each block. In this step were corrected (i) spurious peaks in the magnetic data using the methods Fourth Difference and “P” Parameter (Blum, 1999) and (ii) negative values in the gammaspectrometric data by adding the standard deviation value for each channel. Geophysical blocks were jointed using the Grid Knitting algorithm. In this operation, whenever necessary, the algorithm removes an order zero, one or two trend surface, in order to equalize the base level of the grids. Data interpolation for each block and each channel (mag-netometry, gammaspectrometry) was performed after the prepro-cessing. The interpolation method chosen was the minimum cur-vature, because its sensitivity to the difference between frequency
of sampling between and along the lines of flight. The surfaces generated by interpolating were microniveled (Minty, 1991; Blum, 1999) for subsequent generation of processed products.
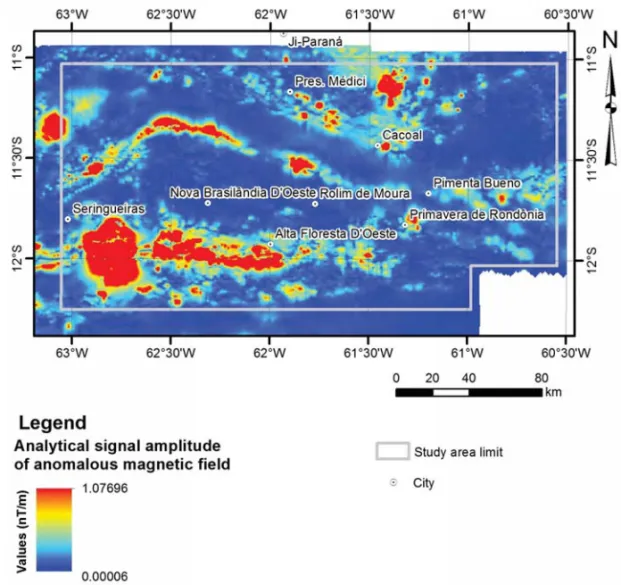
The products 1 vertical derivative, horizontal gradient and an-alytic signal amplitude were generated based on the anomalous magnetic field. Figure 2 shows the analytic signal amplitude map, used in the prospective modelling representing intensity and po-sition of magnetic anomalies.
Gammaspectrometric data are obtained by measuring the gamma radiation emitted by certain elements that compose the various rock types. Gamma radiation measured is proportional to concentration of the elements. Gammaspectrometric data are complementary to the magnetometric products. The magnetic sources on diferent depths contribute to the measured field, while the radiometric data represent only the first 30 to 40 cm from the surface.
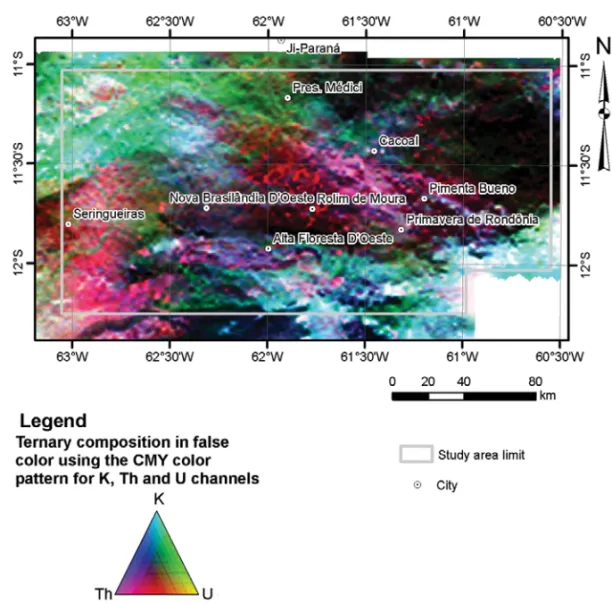
From the data in counts per second (cps), maps were gener-ated for each gammaspectrometric channel: K, U and Th, which were combined in false color ternary compositions for visual analysis.
Figure 3 shows the ternary composition in false color using the CMY color pattern, product that allows better visualization of the correspondence between the geological units and their gam-maspectrometric responses.
STREAM SEDIMENTS GEOCHEMICAL DATA
Interpolated surfaces generated from eight hundred and twenty five (825) samples of stream sediments were used to the con-struction of the nickel mineral prospectivity model for the NBMB. These samples comprise the collection of Southeast Rondˆonia Project, conducted by the Geological Survey of Brazil – CPRM (Pinto Filho, 1977).
Although stream sediments concentrations interpolation is cause for controversy in mineral exploration, the use of interpo-lated surfaces is often necessary to construct models of mineral prospectivity (Andrade, 2008).
Collection, preparation and analysis procedures described by Pinto Filho (1977) were as follows: (i) samples of stream sedi-ments were collected in beds active drainage below the water level, in straight stretches and approximate quantity 1 kg, sieved in frac-tion< 32 mesh, (ii) sample preparation followed the routine of air drying in paper bags, sieving in the fraction< 80 mesh, spraying a 100/150 mesh and total acid digestion (iii) analyzes were then conducted by emission spectrographic technique, also known as optical emission spectrometry.
i i
“main” — 2015/4/20 — 11:36 — page 423 — #5
i i
ANDRADE LB, SILVA AM & SOUZA FILHO CR
423
Figure 2 – Analytic signal amplitude map. The high values are positioned on magnetic anomalies sources, associated with
basic and/or ultrabasic rocks, structural sutures and sources covered by Phanerozoic rocks and sediments.
Samples with not detected results, below detection limit and with interference were subjected to statistical preprocessing de-scribed by Lins (2003) in Technical Handbook of Geochemistry Area of CPRM.
Ni and Co analyzes were selected for the study because anomalous concentrations of these elements are commonly associated with base metals mineralizations.
The Inverse Weighting Distance Multifractal, or IDW-Multi-fractal (Cheng, 1999; Li et al., 2004), was the interpolatory tech-nique chosen. Unlike interpolation by Inverse Distance Weight-ing, the interpolation by IDW-Multifractal bases not only on the distance between the estimated and known values in a given neighborhood, but makes an adjustment by a power law related to the data set fractal dimension (Cheng, 2000; Robinson Jr. et al., 2004).
This interpolator takes into account not only the spatial asso-ciation, but also local singularities of the data by assigning sig-nificant weights to extreme values of the original dataset, so that the surfaces interpolated maintain the local variability of the data,
without the smoothing of anomalous values, focus of geochem-istry exploration (Robinson Jr. et al., 2004).
The geochemical maps of Co and Ni were interpolated on a regular grid with cells of 500 m using GeoData Analysis System (GeoDAS) (Cheng, 2000), with a minimum of three samples within a radius of 10 km (Andrade, 2008). The interpolated geochemical surfaces used in the construction of nickel prospectivity model in the NBMB are shown in Figures 4 and 5.
NICKEL PROSPECTIVITY MODEL BASED ON FUZZY LOGIC
Fuzzy logic is an adaptation of boolean logic. In boolean logic, the process of assigning weights to different evidence regarding the presence or absence of a phenomenon is respectively based on the values 0 or 1. In fuzzy logic, these values, called fuzzy possi-bility or relevance, are fractional and vary between 0 for absence and 1 for the potential presence of the phenomenon. Intermedi-ate values mean different degrees of possibility of whether or not
Figure 3 – Ternary composition in false color using the CMY color pattern for K, Th and U channels. The chosen composition
allows better visualization of correspondence between the geological units and their gammaspectrometric responses.
the phenomenon (eg, mineral deposit) (Bonham-Carter, 1994; Harris et al., 2001; N´obrega, 2001; Porwal et al., 2003; Nykanen & Ojala, 2007; Carrino et al., 2011; Magalh˜aes & Souza Filho, 2012; Silva et al., 2012).
In addition to greater flexibility in the weights defining, fuzzy logic has a wider range of operators (Bonham-Carter, 1994). The
AND and OR operator keeps respectively the smallest and largest
values from fuzzy possibility of evidence involved. The Fuzzy
Al-gebraic Product is a multiplicand between the fuzzy
possibili-ties of various evidence, resulting in decreased fuzzy possibility, but, unlike the AND operator, all evidence must participate. The
Fuzzy Algebraic Sum is calculated as the difference between
the unit and the mutiplicand of the differences between the unit and the fuzzy possibilities of combined evidence, which always generates an increase in the fuzzy possibility and has the contri-bution of all the evidence. The Gamma Fuzzy operator makes combination between the Fuzzy Algebraic Product and Fuzzy Al-gebraic Sum, where a weight ratioγ is determined by the expert
with a value between 0 and 1, or favoring the effect of the product or the effect of increasing the sum.
Fuzzy logic, therefore, is considered a more malleable form to integrate and model geological data. This flexibility is ideal for the phenomena associated with mineral deposits the formation in areas where such deposits are not known. In this case, the effec-tiveness of the models depends on the degree of expert’s knowl-edge on the type of deposit prospected.
In fuzzy logic modelling, the expert functions, according to the prospective model chosen, are: (i) assign, in each of the in-formation plans (or evidences) as geological map and geophysical or geochemical surface, different fuzzy possibility classes and (ii) determine which fuzzy operators will be used in information plans integration.
The fuzzy possibility assignment to data is made in two ap-proaches. In categorical data approach, like lithological map, classes in the information layer have not numerical meaning, so to each class (lithology), the expert determines a specific fuzzy
i i
“main” — 2015/4/20 — 11:36 — page 425 — #7
i i
ANDRADE LB, SILVA AM & SOUZA FILHO CR
425
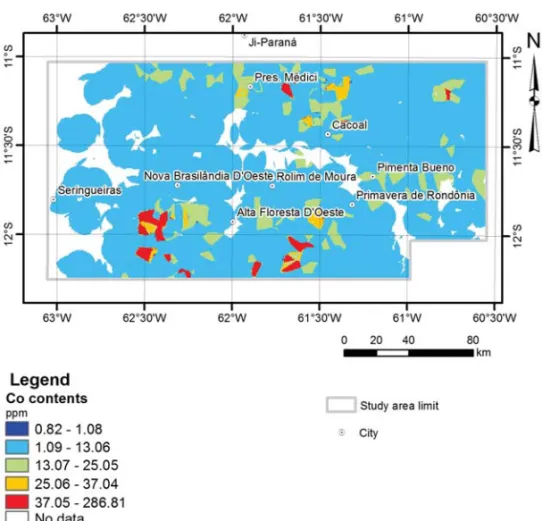
Figure 4 – Co contents in stream sediments geochemical map. The surface presented was interpolated using the IDW-Multifractal (Andrade, 2008).
possibility. In numerical data approach, like geochemical and geophysical maps, information plans represent numeric values, and the assign of fuzzy possibilities can be done following specific functions.
In this work, the following information plans were used to design a nickel prospectivity model in NBMB based on fuzzy logic: lithological map, analytic signal amplitude image, gam-maspectrometric images of K, Th and U channels and interpo-lated surfaces of Co and Ni contents in stream sediments inter-polated by IDW-Multifractal. The modelling was conducted in Ar-cGIS software, developed by Environmental Systems Research In-stitute (ESRI), using Spatial Data Modeller (Arc-SDM) extension (Sawatzky et al., 2009).
The prospective model adopted for favorable areas considers (i) the occurrence of basic and/or ultrabasic rocks, (ii) high val-ues for analytic signal amplitude representing magnetic anoma-lies, (iii) low levels of gamma radiation in the channels K, Th and U and (iv) geochemical anomalies Co and Ni surfaces interpolated by IDW-Multifractal (Andrade, 2008).
The different lithostratigraphic units on the geological map were divided into six groups of fuzzy possibility according to Ta-ble 2. Fuzzy operators do not consider missing values and fuzzy possibility must always vary between 0 and 1. The fuzzy possibil-ity was considered 0 (zero) for Phanerozoic areas because in these areas, gammaspectrometry represents the responses of sedimen-tary rocks overlying the older units and may cover favorable areas. Fuzzy possibilities for geophysical information plans, all of numeric nature, were defined based on Small and Large functions, which respectively assign highest fuzzy possibility to lower and higher values in the information plan. Small and Large functions are shown respectively in Equation 1 and Equation 2, whereμ(x) is the fuzzy possibility,x represents determined value information layer,M is the midpoint and S is the spreading. The constant b equals 0 for information plan with non-negative numerical data or equal to the minimum value for information plans containing negative values.
μ(x) =1 + ((x − b)/M)1 S (1)
μ(x)= 1 + ((x − b)/M)1 −S (2)
Both functions assign fuzzy possibility near 0.5 to values concentrated around a midpoint, defined by the expert, which also determines spreading value used in the functions. The larger the spreading, the more abrupt transition between lower and higher values than the midpoint.
The analytic signal amplitude image was first converted to 8 bits resolution. Fuzzy possibilities for this information layer was defined based on Large function, with midpoint at 150, spreading equal ro 5 and ‘b’ constant equal to 0 (Fig. 6). Large function was chosen by assigning high values of fuzzy possibility to magnetic anomalies, according the prospective model proposed.
Fuzzy possibilities for gammaspectrometry images were de-fined based on Small functions, with midpoints at 18 for K, 19 for 12 for Th and U, scatterings of 7 and ‘b’ constants equal to 12 for K, 21 for Th and 13 for U. Figure 6 shows functions graphics applied to gammaspectrometric data. Small function was chosen for ability to assign higher values of the fuzzy possibilities to areas with low values of gamma radiation for the three channels.
Fuzzy possibilities for geochemical information plans were defined based on the Linear function in Arc-SDM. This feature gives the fuzzy possibility respectively equal to 0 or 1 for val-ues smaller or larger than some minimum or maximum valval-ues defined by the expert and also distribute linearly fuzzy possibil-ity values between 0 and 1 to values between the minimum and maximum set.
Equation 3 gives the Linear function used in defining fuzzy possibilities to geochemical data, whereμ(x) is the fuzzy pos-sibility, x represents determined value information layer and m and M are respectively the minimum and maximum values defined by the expert.
μ(x)= 0 to x ≤ m; μ(x)= 1 to x ≥ M; and
μ(x)= (M − m)−1.x − m/(M − m)
(3) For both geochemical maps (Co and Ni), the fuzzy possibili-ties were defined based on Linear functions, using as a minimum threshold values between background and 1st order anomaly (98 ppm Co and 15 ppm Ni) and maximum thresholds values between 1st and 2nd orders anomalies (199 ppm for Co and 104 ppm for Ni), defined in Andrade (2008). The functions graph-ics used are shown in Figure 7.
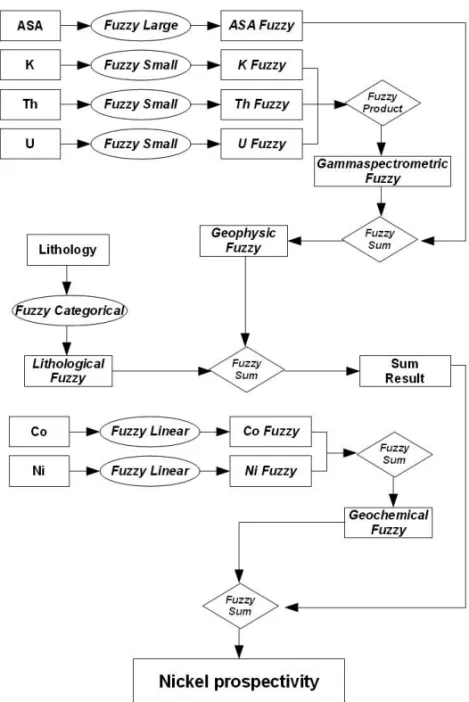
Defined the fuzzy possibilities for all information plans, these were combined using various fuzzy logic operators. Figure 8 il-lustrates the flowchart of fuzzy modelling described below.
The fuzzy possibility maps of gammaspectrometric data were combined using the FUZZY PRODUCT, generating a Gammaspec-trometric Fuzzy Map. This map, was then combined with the fuzzy possibility of analytic signal amplitude map using FUZZY SUM operator, resulting in Geophysical Fuzzy Map.
The fuzzy possibilities maps of geochemical data (Co and Ni) were combined through FUZZY SUM, resulting in Geochemical Fuzzy Map.
i i
“main” — 2015/4/20 — 11:36 — page 427 — #9
i i
ANDRADE LB, SILVA AM & SOUZA FILHO CR
427
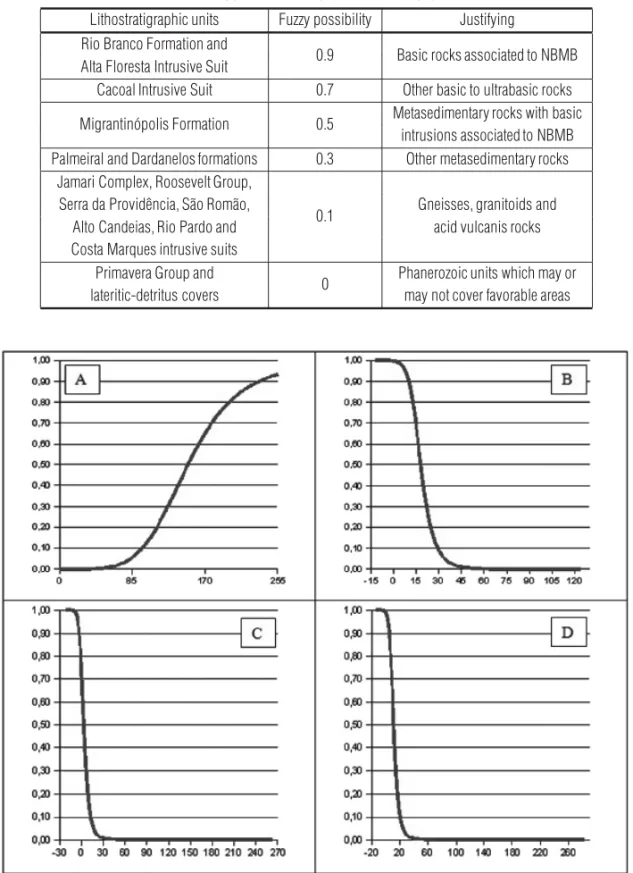
Table 2 – Fuzzy possibilities assignment to lithostratigraphic units.Lithostratigraphic units Fuzzy possibility Justifying Rio Branco Formation and
0.9 Basic rocks associated to NBMB Alta Floresta Intrusive Suit
Cacoal Intrusive Suit 0.7 Other basic to ultrabasic rocks Migrantin´opolis Formation 0.5 Metasedimentary rocks with basic
intrusions associated to NBMB Palmeiral and Dardanelos formations 0.3 Other metasedimentary rocks
Jamari Complex, Roosevelt Group,
0.1 Gneisses, granitoids and Serra da Providˆencia, S˜ao Rom˜ao,
acid vulcanis rocks Alto Candeias, Rio Pardo and
Costa Marques intrusive suits Primavera Group and
0 Phanerozoic units which may or lateritic-detritus covers may not cover favorable areas
Figure 6 – Functions used in assigning fuzzy possibilities for geophysical maps. Graphs: (A) Large Function used to assign
fuzzy possibilities for ASA map. (B) Small Function used to assign fuzzy possibilities for K gammaspectrometric map. (C) Small Function used to assign fuzzy possibilities for Th gammaspectrometric map. (D) Small Function used to assign fuzzy possibilities for U gammaspectrometric map.
The Lithological Fuzzy Map resulted from the fuzzy possibili-ties assigning for map lithological map.
The Geophysical and Lithologic fuzzy maps were combined using the FUZZY SUM operator. The resulting fuzzy map of this
sum was also combined with Geochemical Fuzzy Map through FUZZY SUM, resulting in Nickel Prospectivity Map for NBMB, which was reclassified into five classes of Ni prospectivity: High, with values between 0.85 and 1.00; Intermediate to High, with
Figure 7 – Functions used in assigning fuzzy possibilities for geochemical maps. Graphs: (A) Linear Function used to assign fuzzy
possibilities for Co contents map. (B) Linear Function used to assign fuzzy possibilities for Ni contents map.
i i
“main” — 2015/4/20 — 11:36 — page 429 — #11
i i
ANDRADE LB, SILVA AM & SOUZA FILHO CR
429
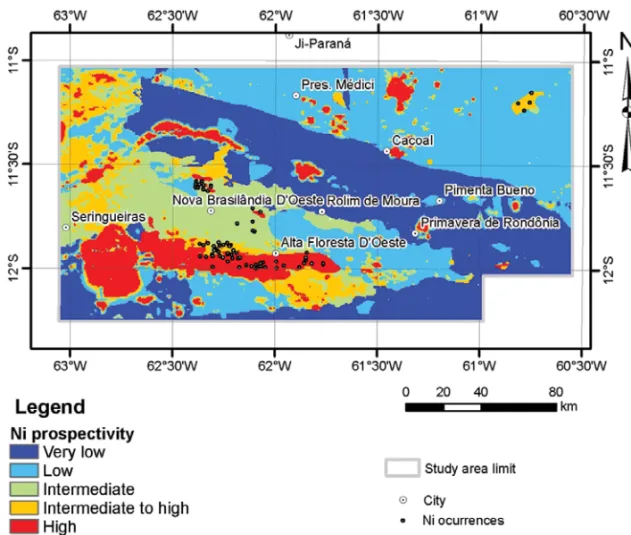
Figure 9 – Nickel Prospectivity Map for NBMB. Note that most of the Ni occurrences indexed by CPRM are located in high Ni
prospectivity areas or very close to them.
values between 0.60 and 0.84; Intermediate, with values between 0.40 and 0.59; Low, with values between 0.10 and 0.39; and Very Low, with values between 0.00 and 0.09 (Fig. 9).
RESULTS AND DISCUSSION
In the nickel prospectivity map shown in Figure 9, considering the 76 occurrences of Ni registered by CPRM, 49% are located in areas with high nickel prospectivity, 16% in areas with interme-diate to high nickel prospectivity, 26% in areas with intermeinterme-diate prospectivity and 9% in areas with low nickel prospectivity.
These occurrences are mostly anomalous Ni contents in sam-ples of stream sediments. Therefore, it is acceptable that there is an offset between the occurrence and its source area, as in the case of occurrences situated North to the Rio Branco Formation, a high nickel prospectivity area.
There are also areas with high nickel prospectivity where Ni occurrences cataloged by CPRM are not observed. In these ar-eas, where the occurrence coincides with lithostratigraphic units of basic or ultrabasic nature, Ni occurrences may not exist or have not been identified by regional prospecting campaigns. But
when such areas are related to magnetic anomalies covered by Phanerozoic rocks or sediments, Ni occurrences cannot be identi-fied based on surface prospection, but only in drilling campaigns. The distribution of the areas with high nickel prospectivity on the developed model is mainly determined by the presence of strongly magnetic bodies, with high values of analytic signal amplitude, and lithostratigraphic units composed by basic or ul-trabasic rocks (Figs. 1, 2 and 9). This distribution is consistent with the adopted fuzzy logic model.
Regarding magnetic bodies, the assignment of fuzzy possi-bility to analytical signal amplitude used Large function, giving greater fuzzy possibilities to high values of analytical signal am-plitude related to these bodies. Combining this information plan with gammaspectrometric layers through FUZZY SUM resulted in a Geophysical Fuzzy Map where fuzzy possibilities were con-trolled predominantly by aeromagnetic data.
In the case of lithostratigraphic units, were assigned high fuzzy possibility values (≥ 0.7) for Rio Branco Formation, Alta Floresta Intrusive Suit and Cacoal Intrusive Suit, where basic or ultrabasic rocks dominate. Combining this information pan with the Geophysical Fuzzy Map through FUZZY SUM resulted in a
map in which the largest fuzzy possibilities were then determined by the occurrence of magnetic bodies and/or basic or ultrabasic lithostratigraphic units.
Because high spatial correlation between Co and Ni geo-chemical and basic or ultrabasic lithostratigraphic units distribu-tion (Figs. 1, 4 and 5), combinadistribu-tion of Geochemical Fuzzy Map by Fuzzy Sum with the result of the FUZZY SUM of Geophysi-cal Fuzzy Map and Lithologic Fuzzy Map gave little influence of geochemical data on the final model.
CONCLUSIONS
The growing demand for minerals goods stimulates the creation of new techniques that can help mineral exploration, as tools for modelling and mapping mineral prospectivity in GIS environ-ment, such those presented in this paper.
Mineral potential in Amazon region is still poorly understood and exploited. The Amazonian craton, one of the largest cratonic entities in the world, home to several world-class deposits in the Caraj´as region. However, in other areas like in NBMB in SW Amazonian craton, significant mineral deposits are not yet known. In these areas, regional prospecting techniques can assist the work of exploration geologists in the arduous task of finding economically viable mineral deposits.
Mineral potential in GIS mapping represents a way to inte-grate and model geological data to determine areas favorable to the occurrence of mineral deposits.
The knowledge-driven approach given to nickel prospectivity modelling and mapping in NBMB by fuzzy logic, based on litho-logical, geophysical and geochemical criteria, showed consistent results in locating areas with high Ni potential, when compared with Ni occurrences cataloged by CPRM.
Modelling results invariably depend on the scale and res-olution of the data. In this study, we used appropriate data to 1:500,000 scale. Thus, the results represent potential for regional exploration and cannot be used, for example, to locate drillholes, but are useful for defining areas to more detailed prospection.
REFERENCES
ANDRADE LB. 2008. Mapeamento do potencial mineral para n´ıquel e ouro no Cintur˜ao Metassedimentar Nova Brasilˆandia – Rondˆonia por meio de l´ogica nebulosa (fuzzy) e redes neurais artificiais. Master disser-tation on Geosciences, Post-graduate Program in Geosciences, Instituto de Geociˆencias, Universidade Estadual de Campinas, 69 pp.
BLUM MLB. 1999. Processamento e Interpretac¸˜ao de Dados de Geof´ısica A´erea no Brasil Central e sua Aplicac¸˜ao `a Geologia Regional e `a
Prospecc¸˜ao Mineral. Doctorate thesis on Geology, Post-graduate Pro-gram in Geology, Instituto de Geociˆencias, Universidade de Bras´ılia, 229 pp.
BONHAM-CARTER GF. 1994. Geographic Information Systems for Geo-scientists: Modelling with GIS. Pergamon Press, Ontario, 398 pp. BONHAM-CARTER GF. 1997. GIS Methods for Integrating Exploration Data Sets. In: Exploration 97: Decennial International Conference On Mineral Exploration, 4., 1997, Toronto. Proceedings. Toronto: Prospec-tors and Developers Association of Canada, p. 59–64.
CARRINO TA, SILVA AM, BOTELHO NF & SILVA AAC. 2011. An´alise prospectiva para ouro nas regi˜oes Ouro Roxo-Cantagalo e Chico Torres, Prov´ıncia Mineral do Tapaj´os. Brazilian Journal of Geophysics, 29(1): 135–154.
CHENG Q. 1999. Multifractality and spatial statistics. Computer & Geo-sciences, 25(9): 949–961.
CHENG Q. 2000. GeoData Analysis System (GeoDAS) for Mineral Ex-ploration: User’s Guide and Exercise Manual. York University, Toronto, 204 pp.
HARRIS JR, WILKINSON L, HEATHER K, FUMERTON S, BERNIER MA, AYER J & DAHN R. 2001. Application of GIS Processing Techniques for producing mineral prospectivity maps – A case study: Mesothermal Au in the Swayze Greenstone Belt, Ontario, Canada. Natural Resources Research, 10(2): 91–124.
KLOOSTERMAN JB. 1968. Uma prov´ıncia do tipo nigeriano no sul da Amazˆonia. Revista de Engenharia, Minerac¸˜ao Metalurgia, 47(278): 59– 64.
LI C, MA T & CHENG J. 2004. A fractal interpolation approach to geochemical exploration data processing. Mathematical Geology, 36(5): 593–606.
LINS CAC. 2003. Manual T´ecnico da ´Area de Geoqu´ımica. CPRM, Rio de Janeiro, 35 pp.
MAGALH˜AES LA & SOUZA FILHO CR. 2012. Targeting of Gold Deposits in Amazonian Exploration Frontiers using Knowledge- and Data-Driven Spatial Modelling of Geophysical, Geochemical and Geologic Data. Surveys in Geophysics, 33: 211–241.
MINTY BRS. 1991. Simple micro-levelling for aeromagnetic data. Explo-ration Geophysics, 22: 591–592.
N ´OBREGA RP. 2001. An´alise espacial‘knowledge-driven’ e ‘data-driven’ : o uso das l´ogicas boolena, fuzzy e redes neurais para gerac¸˜ao de mapas de favorabilidade mineral na regi˜ao centro-leste da Bahia. Master disser-tation on Geosciences, Post-graduate Program in Geosciences, Instituto de Geociˆencias, Universidade Estadual de Campinas, 72 pp.
NYKANEN VM & OJALA VJ. 2007. Spatial analysis techniques as suc-cessful mineral-potential mapping tools for orogenic gold deposits in the northern Fennoscandian shield, Finland. Natural Resources Research, 16(2): 85–92.
i i
“main” — 2015/4/20 — 11:36 — page 431 — #13
i i
ANDRADE LB, SILVA AM & SOUZA FILHO CR
431
PINTO FILHO FP. 1977. Projeto Sudeste de Rondˆonia. CPRM, Rio deJaneiro, 100 pp.
PORWAL A, CARRANZA EJM & HALE M. 2003. Knowledge-driven and data-driven fuzzy models for predictive mineral potential mapping. Nat-ural Resources Research, 12(1): 1–25.
RIZZOTTO GJ. 1999. Petrologia e Ambiente Tectˆonico do Grupo Nova Brasilˆandia – RO. Master dissertation on Geosciences, Post-graduate Program in Geosciences, Instituto de Geociˆencias, Universidade Federal do Rio Grande do Sul. 136 pp.
RIZZOTTO GJ. 2001. Reavaliac¸˜ao do Ciclo Orogˆenico Suns´as/Aguape´ı no Sudoeste do Cr´aton Amazˆonico. In: Workshop Geology of the SW Amazonian Craton: State-of-the-Art, 2001, S˜ao Paulo. Extended Ab-stracts, S˜ao Paulo: IGC-USP, p. 66–70.
RIZZOTTO GJ, SCANDOLARA JE & ADAMY A. 2000. Geologia e Geo-morfologia dos Munic´ıpios de Alta Floresta e Alto Alegre dos Parecis. Porto Velho. CPRM. 64 pp.
ROBINSON Jr GR, KAPO KE & GROSSMAN JN. 2004. Chemistry of stream sediments and surface waters in New England. Available on: <http://pubs.usgs.gov/of/2004/1026/>. Access on: January 15, 2013. SANTOS JOS. 2003. Geotectˆonica dos Escudos das Guianas e Brasil-Central. In: BIZZI LA, SCHOBBENHAUS C, VIDOTTI RM & GONC¸ALVES JH (Eds.). Geologia, Tectˆonica e Recursos Minerais do Brasil. Bras´ılia, CPRM, p. 169–226.
SCANDOLARA J. 1999. Geologia e Recursos Minerais do Estado de Rondˆonia: Texto Explicativo e Mapa Geol´ogico do Estado de Rondˆonia. Porto Velho, CPRM, 97 pp.
SCHOBBENHAUSC, GONC¸ALVES JH, SANTOS JOS, ABRAM MB, LE˜AO NETO R, MATOS GMM, VIDOTTI RM, RAMOS MAB & JESUS JDA.
2004. Carta Geol´ogica do Brasil ao Milion´esimo, Sistema de Informa-c¸˜oes Geogr´aficas – SIG e 46 folhas na escala 1:1.000.000. Bras´ılia, CPRM. 41 CD-ROM.
SILVA EC, SILVA AM, TOLEDO CLB, MOL AG, OTTERMAN DW & SOUZA RC. 2012. Mineral Potential Mapping for Orogenic Gold De-posits in the Rio Maria Granite Greenstone Terrane, Southeastern Par´a State, Brazil. Economic Geology and the Bulletin of the Society of Eco-nomic Geologists, 107: 1387–1402.
SAWATZKY DL, RAINES GL, BONHAM-CARTER GF & LOONEY CG. 2009. Spatial Data Modeller (SDM): ArcMAP 9.3 geoprocessing tools for spatial data modelling using weights of evidence, logistic regres-sion, fuzzy logic and neural networks. ArcSDM Manual. Available on: <http://www.ige.unicamp.br/sdm/ArcSDM10/source/ReadMe.pdf>. Access on: January 17, 2013.
TEIXEIRA W & TASSINARI CCG. 1984. Caracterizac¸˜ao geocronol´ogica da prov´ıncia Rondoniana e suas implicac¸˜oes geotectˆonicas. In: Sympo-sium Amazˆonico, 2., 1984, Manaus. Proceedings... Manaus: SBG – N´ucleo Norte, p. 175.
TOHVER E, VAN DER PLUIJM B, MEZGER K, ESSENE E, SCANDOLARA J & RIZZOTTO GJ. 2004. Significance of the Nova Brasilˆandia metased-imentary belt in western Brazil: Redefining the Mesoproterozoic bound-ary of the Amazon craton. Tectonics, 23: 1–20.
TOHVER E, VAN DER PLUIJM B, MEZGER K, SCANDOLARA J & ESSENE E. 2005. Two stage tectonic history of the SW Amazon Craton in the late Mesoproterozoic: identifying a cryptic suture zone. Precambrian Research, 137(1): 35–59.
Recebido em 11 julho, 2013 / Aceito em 13 fevereiro, 2014 Received on July 11, 2013 / Accepted on February 13, 2014
NOTES ABOUT THE AUTHORS
Lucas Barros de Andrade. Geologist from Universidade de Bras´ılia (UnB, 2003), Geoprocessing Specialist from the same institution in 2003 and M.Sc. in Geosciences
from the Universidade Estadual de Campinas (UNICAMP, 2008). Currently, serves as Federal Forensic Expert in Departamento de Pol´ıcia Federal (Brazilian Federal Police Department), working in areas as geographic information systems (GIS), digital image processing, remote sensing and geophysics, especially in forensic application of these technologies.
Adalene Moreira Silva. Geologist Engineer from Universidade Federal de Ouro Preto (UFOP, 1989), M.Sc. and Ph.D. in Geology from UnB (1992 and 1999,
respectively). Professionally, worked as researcher in United States Geological Survey (1997-1999), Visiting Professor at UnB (2000-2002), Post-doctoral research (05/2002-04/2003) and Professor (04/2003-10/2005) at the Institute of Geosciences of UNICAMP. Currently, works in UnB and develops main projects on new process-ing, interpretation and data integration applied to mineral exploration, geological mapping and crustal evolution.
Carlos Roberto de Souza Filho. Geologist Engineer from Universidade Federal de Ouro Preto (UFOP, 1988). Holds a Masters in Metallogenesis (UNICAMP, 1991);
Ph.D. in Earth Sciences and Remote Sensing (Open University, England, 1995); Young-Research Fellowship (FAPESP-UNICAMP, 1995-1997); Assistant-Professorship (UNICAMP, 1997-2002); and Associate-Professorship (UNICAMP, 2002-2008). Currently, is a Full Professor at the Geology and Natural Resources Department of the Geosciences Institute (IG) of UNICAMP and leader of the Geotechnology Research Group. Is also a CNPq Researcher (level 1A) and responsible for several research laboratories, including those related to infrared reflectance and emissivity spectroscopy, remote sensing and digital image processing; GIS and data integration. Is a NASA researcher for the ASTER, Mars-Earth Analogs and HyspIRI programs. Presently contributes with the editorial board of numerous international journals, including the International Journal of Applied Earth Observation and Geoinformation and Mathematical Geosciences.