RBRH, Porto Alegre, v. 23, e38, 2018 Scientific/Technical Article
https://doi.org/10.1590/2318-0331.231820170107
This is an Open Access article distributed under the terms of the Creative Commons Attribution License, which permits unrestricted use, distribution,
Clustering of historical floods observed on Iguaçu River, in União da Vitória, Paraná
Agrupamento de cheias históricas observadas no Rio Iguaçu, no município de União da Vitória, Paraná
Patrícia Cristina Steffen1 and Júlio Gomes1
1Universidade Federal do Paraná, Curitiba, PR, Brasil
E-mails: [email protected] (PCS), [email protected] (JG)
Received: July 06, 2017 - Revised: May 25, 2018 - Accepted: July 02, 2018
ABSTRACT
The occurrence of flood events has become more frequent, and, in Brazil, there are regions that suffer with the repetition of those events. In União da Vitória, located in Paraná State, Brazil, those phenomena are commonly recorded, generating series of consequences for each flood event, such as financial losses, environmental damages, home losses and deaths. So, since it is not possible to avoid the occurrence of floods, it is necessary to reduce its impacts, and in a scenario of repeated flood events, as observed in União da Vitória, it is justified the clustering of historical floods, aiming to improve the knowledge about the river basin hydrological behavior
and to assist in the determination of hydrological models parameters. Clustering analysis aims to establish sets of events with similar
characteristics, and, for this, based on fuzzy logic, the present study uses the fuzzy c-means method to cluster Iguaçu river floods, observed in União da Vitória, using a set of different flood severity indicators. The classification defined four clusters, according to different flood severity levels, so-called: low; medium; high; and, disaster or catastrophe. Therefore, by the analysis of similar features among different clusters of events, it is further possible to study the flood formation mechanisms, contributing to the reduction of its impacts, through real-time flood alert and forecasting systems, for instance.
Keywords: Flood clustering; Flood indicators; Flood intensity; Fuzzy c-means; Flood forecasting.
RESUMO
A ocorrência de eventos de cheia tem se tornado mais frequente e, no Brasil, existem regiões que sofrem com a repetição destes
eventos. Em União da Vitória, no estado do Paraná, estes fenômenos são comumente registrados, gerando, a cada evento, uma série
de consequências, como, por exemplo, prejuízos financeiros, danos ambientais, perdas de casas e mortes. Assim, uma vez que não é possível evitar a ocorrência das inundações, procura-se diminuir os seus impactos, e, em um cenário de repetição de eventos de cheia, como observado no município de União da Vitória, justifica-se a aplicação do agrupamento de cheias históricas, com o objetivo de melhorar o conhecimento sobre o comportamento hidrológico da bacia hidrográfica e auxiliar na determinação de parâmetros de modelos hidrológicos. O objetivo do agrupamento de cheias consiste em estabelecer conjuntos de eventos com características semelhantes, e,
para isso, baseando-se na lógica difusa, o presente estudo utilizou o algoritmo fuzzy c-means como ferramenta para agrupar as cheias
do rio Iguaçu, observadas na cidade de União da Vitória, a partir da definição de diferentes indicadores de severidade de uma cheia. Esta classificação, por sua vez, foi capaz de definir quatro diferentes grupos de eventos de cheias, com distintos níveis de severidade, assim denominados: severidade baixa; severidade média; severidade alta; desastres ou catástrofes. Desta forma, através da análise das características semelhantes entre os eventos de cada grupo, acredita-se que, posteriormente, seja possível estudar os mecanismos de formação das cheias de cada grupo e contribuir para a diminuição dos seus impactos, através, por exemplo, de sistemas de alerta e
previsão de cheias em tempo real.
INTRODUCTION
Recently, natural disasters such as floods, droughts, landslides and extreme temperatures have hit Brazil and affected thousands
of people (EM-DAT, 2015). Among these occurrences, floods are most relevant natural disaster since they represent the largest number of occurrences and cause the largest number of deaths due to natural disasters in the country, according to the Emergency
Disasters Data Base (EM-DAT, 2015).
Droughts and minor magnitude floods represent most of
the hydrological period, and they limit the discharge to the main
riverbed. However, when extreme floods occur, the elevation of water levels exceeds the river banks and overflow to the flooding
plains (TUCCI; BERTONI, 2003; PAZ et al., 2009).
That concept represents the definition of flood applied to the present work, which is summarized as ‘flow that exceeds the
drainage capacity of a river main channel’ (CASTILHO et al., 2005; TUCCI, 2012). In those cases, floods may generate consequences
for the region beyond the financial losses, such as the occurrence
of deaths and environmental damages, which are called intangible
damages, due to the difficulty of translating those consequences into
financial losses (MACHADO et al., 2005; MESSNER et al., 2006).
Thus, to reduce the impacts from those great magnitude
floods, a series of control measures can be adopted. Control measures of the structural type modify the fluvial system, while
control measures of the non-structural type seek to reduce the
impacts through the adequate coexistence of the population
with the events (TUCCI, 2012). In addition, it is important to
emphasize that, in order to adopt the most adequate control
measures, some aspects of the watershed must be studied to prevent possible local impacts from being transferred to the nearby regions (TUCCI et al., 1995).
Flood forecasting and warning system is an example of
non-structural control measure (TUCCI, 2012). In general, the
development of such type of system requires the use of hydraulic
and hydrological models, which are better adjusted through a better knowledge of the river basin hydrological behavior. The usual approach to apply hydraulic and hydrological models involves
the steps of calibration, verification and simulation. Especially in
the calibration stage, it is sought to establish a group of events
that allows defining a unique set of model parameters, aiming the flood formation process dynamics in river basin is relatively well
represented by the model.
Chebana et al. (2013) state that, for hydrological extreme
event forecasting, frequency analysis procedures are essential
and commonly applied, and in this approach, variables such as
maximum water flow and maximum water level are adopted to define the magnitude of the events. However, those variables are not able to represent all the complexity involved in flood events,
once they can be different in many ways. For this reason, it is
questionable whether it is possible to capture the complexity of
such dynamics with a single set of parameters, or whether it is
necessary to define more than one set of parameters, trying to
represent events or cluster of events with distinct characteristics.
Therefore, the present work assumes that the definition of different sets of model parameters, each one representing flood
characteristics inherent to certain events or cluster of events, enables the improvement of hydrological models. So, it believes that it is possible to achieve this goal using clustering analysis to
identify patterns in flood formation mechanism of each cluster. Certainly, considering a real-time flood forecasting and warning
system, the results obtained with the present study can reduce the
amplitude of flow forecasting by means of identifying to which cluster the flood best fits as the flood hydrograph evolves.
Flood indicators are initially stablished for definition of
clusters of events with similar features. According to Wang et al. (2014), the flood indicators must be able to evaluate the intensity
of flood events, once the adequate characterization of those
phenomena is not possible without the adoption of a set of
different parameters (characteristics), in addition to maximum flow and maximum water level.
However, only the adoption of those indicators does not
allow the full characterization of an extreme flood event. For this,
Wang et al. (2014) suggest that a clustering method can be used
to determine sets of flood events with similar characteristics, based on the adopted set of flood indicators. In this case, those
clusters are distinct from each other, because of the severity of
the floods that belong to each cluster.
Data clustering is based on the principle of object classification,
“so that each object is similar to the others in the clustering, based on a set of chosen characteristics” (HAIR JUNIOR et al., 2009).
Therefore, as one of the multivariate statistics techniques and
that it has been applying to several areas of Science, including Hydrology, the data clustering was used in this work to obtain sets
of flood events with similar intrinsic characteristics.
In the literature, there are three main techniques of data clustering applied to Hydrology: Self Organizing Feature Map (SOFM), and K-means and Fuzzy c-means (fcm) algorithms.
Jingyi and Hall (2004) present, initially, the Self Organizing Feature Map (SOFM) method, whose goal is to capture the topology and probability distribution of the input data, reducing the space of entrance in representative characteristics through a
“self-organization” process. According to Srinivas et al. (2007),
the SOFM method is widely applied in flow regionalization studies. However, according to those authors, it is not exactly a data clustering technique, due to the complexity in interpreting
the results. For this reason, Lampinen and Oja (1992) proposed its use as a support for other data clustering methods.
Jingyi and Hall (2004) also present the second mentioned data clustering method, the K-means algorithm. According to
the authors, despite of its simplifications, the method produces satisfactory results, including in Hydrology. Due to the acceptable
results produced by the method, several applications are found in the literature. Chang et al. (2010), for example, applied the K-means method to subdivide a study area according to the
flood characteristics, and to identify control points of each
cluster identified. Burn and Goel (2000) and Lin and Chen (2004),
respectively, applied the algorithm K-means in order to analyze the frequency of floods and to create a rainfall-runoff model.
Zahmatkesh et al. (2015) used the K-means method to improve
the results obtained from rainfall-runoff models for the Bronx
River basin in the United States.
In the present study, among the three techniques for
hydrological data clustering listed by Jingyi and Hall (2004), it
was used the third method, fuzzy c-means (fcm). The fcm is an algorithm based on fuzzy logic, which aims to establish the similarities
1984), and to represent the uncertainties inherent to the real data
(SATO-ILIC; JAIN, 2006).
The concept of clustering based on fuzzy logic can be better understood when it is compared to the classical definition
of clustering. According to Sato-Ilic and Jain (2006), in the traditional approach, when a sample data is clustered, it belongs only to one cluster, without sharing similar characteristics to the
others. In clustering based on fuzzy logic, however, Sato-Ilic and
Jain (2006) affirm that each sample data present distinct degrees of similarity with each cluster. In other words, the clustering is
defined by the membership (similarity) degree of the sample data
in relation to each one of the clusters. The sample data is assigned to the group to which it presents the highest membership degree, but it still shows a similarity to the other groups. It means by that
the objects can only return values 0 (zero) or 1 to the membership
function to a certain cluster in the traditional approach, while the
membership function admits values in the range from 0 (zero) to 1 in clustering based on fuzzy logic. So, it allows the objects have
a relation to all clusters, in a higher or lower degree, depending on the pertinence level presented in relation to each cluster.
In Hydrology, the application of clustering based on
fuzzy logic is widespread. He et al. (2011), for example, applied
the clustering based on fuzzy logic to evaluate flood damages.
Lohani et al. (2014), in turn, applied the same concept to improve
a real-time flood forecasting system.
The choice of the fuzzy c-means (fcm) algorithm as the clustering method in the present study is justified by its higher
sophistication compared to other methods applicable to hydrology,
and by its wide use in hydrological studies, as, for example, in
Kaviski et al. (2004), Jingyi and Hall (2004), and Sadri and Burn (2011), who applied the fcm algorithm to obtain the regionalization of hydrological parameters in their study areas. Furthermore, Wang et al. (2014) developed a clustering analysis of floods to
define the intensity and magnitude of the events, as well as the similar characteristics among them. Therefore, it is verified the applicability of the fuzzy c-means algorithm as a clustering method of hydrological data and, consequently, Iguaçu River flood events,
observed in municipality of União da Vitória, based on a set of
flood severity indicators.
Due to the frequency of flood events on Iguaçu river, in
União da Vitória, and to the fact there is a cascade of reservoirs
for electricity generation on Iguaçu River, located downstream the
same city, previous studies have presented hydrological models
to forecast Iguaçu river flow in União da Vitória. As an example,
there are the studies of Mine and Tucci (1999), Mine and Tucci (2002), and Breda (2015).
Based on Foz de Areia hydroelectric reservoir, located
approximately 100 km downstream from União da Vitória, Mine
and Tucci (1999) presented a method for real-time forecasting
of tributary flows to hydroelectric reservoirs. Due to operational
limitations, both upstream and downstream from the reservoir, the authors used the combination of a linear stochastic model (ARIMA model) and a deterministic rainfall-runoff model (IPH II model),
using a traditional approach to define the model parameters
Mine and Tucci (2002) studied the management of energy
production in hydroelectric power plants, choosing Foz de Areia power plant as the study area. The main goal was to maximize
its energy production, keeping both favorable conditions for the reservoir and the safety of upstream population, as well as
helping flood control in União da Vitória through the power plant
operation. The authors applied the same hydrological models used in a previous study (MINE; TUCCI, 1999), ARIMA and IPH II models, and again followed a traditional approach for hydrological studies.
On the other hand, Breda (2015), based on the flood occurred
in União da Vitória in 2014 year, the third largest monitored flood in the city, applied a hydrological model with flood hydrograph
splitting to perform the flow forecast. For this, Breda (2015) also
used IPH II model, among others.
Thus, it observed that none of cited studies used clustering
analysis of flood events neither to understand the river basin
hydrological behavior in events of different magnitudes, nor to
determine sets of distinct parameters, each one related to a specific cluster, considering all possible identified clusters.
Therefore, based on the presented considerations, this study
aims performing a clustering analysis of historical floods, observed on Iguaçu River, in União da Vitória, Paraná state, Brazil, by means of defining flood indicators and using fuzzy c- means algorithm. Thus, it expects that such kind of analysis can contribute to the development of more efficient flood forecasting and warning
systems, due to both a better knowledge of the river basin and a
specific calibration of the hydrological and/or hydraulic model for each cluster, identified by the clustering analysis.
STUDY AREA
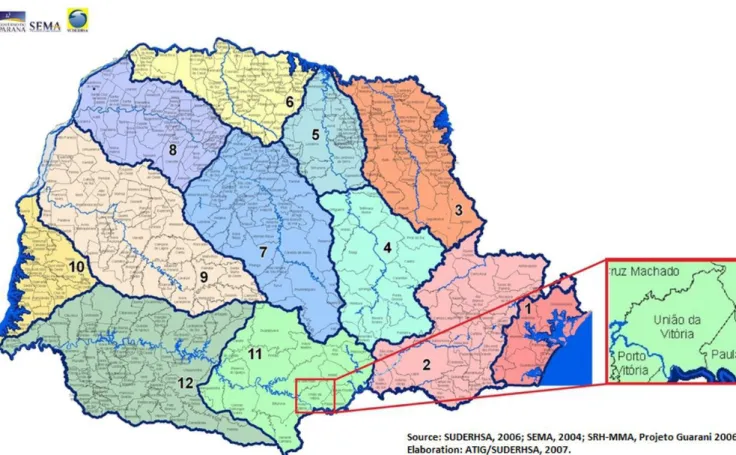
The study area includes the drainage area of Iguaçu river basin, defined by a cross section of interest, located approximately
at 26° 13’ 44” S and 51° 04’ 58” W in União da Vitória, Paraná
state, Brazil. The city rised on Iguaçu River banks and there are flood records since 1891, reinforcing the importance of flood
studies in the region.
Iguaçu River is about 1.320 km long, crossing over most
of Paraná state (PEREIRA; SCROCCARO, 2010), and it belongs
to the Paraná River basin. The Iguaçu River is divided into three stretches: upper, middle and lower Iguaçu, respectively represented
by numbers 2, 11 and 12 in Figure 1, that also shows the location
of União da Vitória in the middle stretch of Iguaçu River. The flow data, used in the present study, were recorded at União da Vitória gauging station (code ANA 65310000).
METHODS
The development of the present study required the
execution of the following steps:
1. Collecting flow and water level data; 2. Filling gaps in flow and water level data; 3. Definition of the overflow threshold; 4. Selection of annual flood events;
5. Definition and calculation of flood indicators; 6. Data pretreatment;
7. Data clustering;
Collecting flow and level data
Flow and water level data were collected from the União
da Vitória gauging station (code ANA 65310000). However, it was necessary to correct flow data from 1980 to 2015, using
water level observed from the R5 Porto Vitória gauging station
(code ANA 65365800), as explained in the following.
The operation of the Foz de Areia Hydroelectric Power
Plant began in 1980, under the responsibility of the Companhia Paranaense de Energia (COPEL). The plant reservoir created a backwater effect over the water levels observed in the União da
Vitória gauging station (code ANA 65310000). Therefore, a family
of discharge curves, as shown in Figure 2, represents its relation between water level and discharge. As one can see, each discharge
curve refers to a specific water level observed in R5 Porto Vitória gauging station (code ANA 65365800), located at upstream from the
reservoir and downstream from the União da Vitória gauging station.
In order to correct flow data, it was used a computer program available by COPEL, that calculates flow in União da
Vitória from the water levels observed in União da Vitória and R5 Porto Vitória gauging stations, considering the family of discharge curves, presented in Figure 2.
Table 1 presents the source of hydrological data used for
developing the present work, after flow data correction.
It is necessary to mention that the cited gauging station codes correspond to those established by the HidroWEB platform,
under the responsibility of the National Water Agency (ANA).
However, the data were collected from the Instituto das Águas do Paraná database, as mentioned in Table 1. For further details about the collection of data carried out for the study, it suggests to consult Steffen (2017).
Filling gaps in flow and water level data
Data gaps were observed only in water level data from R5 Porto Vitória gauging station (code ANA 65365800) in 1980 to 2015 period, which were used to correct flow data from União
Figure 1. Location of União da Vitória in Paraná state and in Iguaçu River basin (adapted from ÁGUAS PARANÁ, 2016) (no scale indication here).
Figure 2. Discharge curves for União da Vitória gauging station
(code ANA 65310000) (adapted from CASTANHARO; BUBA,
da Vitória gauging station (code ANA 65310000), as mentioned
previously. Water level duration curves for 1980 to 2015 common
period were used to fill those gaps.
Basically, it was adopted the hypothesis that water level duration curves shows a strong relationship because the gauging stations are close to each other. In other words, it was assumed that water levels observed in both stations at the same time present the same duration. So, concerning to any day that shows a gap
in water level in R5 Porto Vitória, the procedure to fill the gaps
is presented as follows.
First, it was defined the duration (pi,UV) for the observed
water level (hi,UV) in União da Vitória from its duration curve. Based on the adopted hypothesis, the duration (pi,PV) for the water level (hi,PV) in R5 Porto Vitória was made equal to the duration (pi,UV) for the observed water level in União da Vitória. Finally, the water level (hi,PV) in R5 Porto Vitória was defined from its own duration curve.
Equation (1) resumes the procedure applied to fill the gaps
in R5 Porto Vitória water levels.
, , , ,
i UV i UV i PV i PV
h →p =p →h (1)
In addition, it is necessary to say that the gaps observed in water level data from R5 Porto Vitória gauging station (code
ANA 65365800) corresponds to 23 consecutive days only, from
1982 July to August 1982. Probably, such short time period did not produce any meaningful effect on the results obtained in this work.
Definition of the overflow threshold
The overflow elevation coincides with the expropriation elevation defined for the Iguaçu riverside area, in União da Vitória,
as performed by COPEL. That elevation correspond to 744.50 m above sea level.
The expropriation level, or overflow level, corresponds
to 4.89 m water level in União da Vitória gauging station
(code ANA 65310000), once the “zero” of the limnimetric ruler is equal to 739.61 m above sea level.
However, in order to estimate the flow rate corresponding to the overflow level, it is important to restate that União da Vitória water levels are influenced by the R5 Porto Vitória water levels, as mentioned previously. That fact leads to exist a family of rating curves for União da Vitória gauging station (code ANA 65310000),
as shown in Figure 2, causing the overflow elevation (744.50 m) to
have a corresponding flow rate in four discharge curves. In other words, 744.50 m elevation corresponds to four different flow
values in Figure 2. Once the overflow threshold seeks to establish
a unique value that represents an overflow situation, it was adopted
1387 m3/s as the threshold flow value, which corresponds to the
lowest flow rate among the four possible values, considering the
744.50 m elevation and the family of rating curves.
Therefore, the expropriation elevation provided two reference
values for the present study, 4.89 m and 1387 m3/s, representing,
respectively, threshold values for water level and flow rate.
Selection of annual flood events
It was selected the largest annual flood event observed in each
year, considering a period of 85 years, ranging from 1931 to 2015.
This procedure was adopted in respect to the classical frequency analysis methods, that uses annual data series; however, it does not represent a limitation of the clustering analysis. The definition of the largest annual flood event happened regardless of whether, or not, there was overflow of the main channel.
Each selected event always contains the maximum annual flow, except for 1970 and 1980 years. In those years, the annual
maximum flows occurred on the December, 31th, and did not
correspond to the hydrograph peaks. In both cases, the flood
hydrographs were considered as belonging to the following years (1971 and 1981), and may, or may not, represent the largest annual
observed flood event. For 1970 and 1980 years, the flood events correspond to the second largest annual observed flow rate.
In order to determine the duration of each annual flood event, that is, to define the beginning and the ending points of each event, the minimum flows located to the left and to the right in relation to hydrograph peak were identified. Those points were
adopted as, respectively, the beginning and the ending points of
each event, allowing the calculation of the flood duration.
Definition and calculation of flood indicators
Seven flood indicators were defined as variables for the
clustering analysis, basically representing characteristics of the
flood hydrograph, but also implicitly related to social and economic impacts. Such number of variables requires the use of multivariate statistics for the clustering analysis, which can be defined as “a set of procedures to analyze the association between two or more sets
of measurements that were made on each object in one or more samples of objects” (LATTIN et al., 2011). The chosen flood
indicators, as well as their definitions and defining equations, are
presented in Table 2.
In Equations from (2) to (6), n is the total number of time
periods over the overflow threshold; Vi is the overflow volume in
i-th time period; Δti is the time period over the overflow threshold
in the i-th period (days); te0, the starting time of the first overflow;
t0, the starting time of the flood hydrograph; Q0 is the flow rate
at the starting time of the flood hydrograph (m3/s); Q
ref, is the
reference flow (1387 m3/s); t
max is the hydrograph peak time; tefpeak
is the ending time of the overflow period where the peak discharge
is included; Qmax is the peak discharge (m3/s).
In Steffen (2017), one can see some figures that explain with
more details each one of the flood indicators presented in Table 2.
In addition, it is important to emphasize a peculiarity in
water level data set. Instead of the common hydrological operation Table 1. Source of the hydrological data for União da Vitória
gauging station (code ANA 65310000).
Variable (years)Period Source
Water
level 1931 to 2015 Instituto de Águas do Paraná (raw data)
with two daily observations, União da Vitória gauging station (code
ANA 65310000) presents two measurements only after 1989.
Before 1989, daily water level data were available at 7 am, only.
Therefore, in the present study, after 1989, the maximum daily water level was adopted to generate the flow data, since the
objective of this work is to identify the clustering based through
the flood severity.
Data pretreatment
Due to their physical and, consequently, measurement differences, it was applied a pretreatment to the flood indicators,
using a normalization method. Equation (7) (WANG et al., 2014)
presents the normalization method applied to the flood indicators,
where xij and x0
ij are, respectively, the treated and non-treated
values of the i-th observation of the j-th indicator, and x0
jmin and
x0
j max are, respectively, the minimum and maximum values of
the j-th indicator.
min
max min
0 0 ij j
ij 0 0
j j x x x x x − =
− (7)
The xij elements assemble the matrix X, whose elements are
defined from Equation (7) and belong to the [0, 1] range. Then,
those elements represent dimensionless values and present the same order of magnitude.
Data clustering
The clustering method adopted in this study, the fuzzy
c-means (fcm) algorithm, establishes the similarities that a sample data shares with each cluster.
Aiming to minimize its objective function (Fob), the fcm
is characterized by being an iterative method that follows the sequence presented as follows, where the iterations are denoted
by (p) = 0, 1, 2, ..., n:
1. The number of clusters (c) and the accuracy degree of the method (r) are assumed. In the following section, the
method applied to define those parameters (r and c) is
presented, regardless of the fcm method;
2. Randomly, the initial fuzzy partition matrix (U0) is
determined, which is composed by c lines and I columns, where c is the number of clusters and I is the total number
of observations;
3. The matrix contained the centroids of the c clusters (V) is
calculated from Equation (8), where vki is the coordinate
of the j-th flood indicator of the k-th centroid; xij is the
treated value of the i-th observation of the j-th flood
indicator; uki is the fuzzy partition matrix (U) element of
the i-th observation of the k-th cluster; c is the total number
of clusters; and, r is the accuracy degree of the method:
( ) ( ) c r ki ij k 1 kj c r ki k 1 u x v u = = = ∑
∑ (8 )
4. The Euclidian distance matrix from the sample data to
the centroids of the c clusters (D) is calculated from
Equation (9), where dik is the Euclidian distance of the
i-th observation to the k-th cluster; xij is the treated value of the i-th observation of the j-th flood indicator; vki is the coordinate of the j-th flood indicator of the k-th centroid; and, J is the total number of flood indicators:
(
)
2J
ik ij kj
j 1
d x v
=
= ∑ −
(9)
5. The objective function value (Fob) is calculated from Equation (10), where r is the accuracy degree of the method; dik is
the Euclidian distance from the i-th observation to the centroid of the k-th cluster; uki is the adherence level of the i-th observation of the k-th cluster of the fuzzy partition Table 2. Definition of the flood indicators.
Flood indicator measureUnit of Description Defining equation Equation number
Peak discharge (I1) (m3/s) Maximum flow of the selected annual event selected Data set
---Peak water level (I2) (m) Maximum water level of the selected annual event
selected
Data set
---Total overflow volume (I3) (km3) Total volume of water over the overflow threshold
during all the selected annual event
n
3 i
i 1
I V
=
=∑ (2)
Total time over the overflow threshold (I4)
(day) Elapsed time of the selected flood event over the overflow threshold n 4 i i 1 I t =
=∑∆ (3)
Elapsed time between the starting time of the event and the overflow threshold exceeding (I5)
(day) For the selected annual event, this is the elapsed time from the starting time of the event to the
starting time of overflow 5 e0 0
I =t −t (4)
Average ascension rate of flood hydrograph (I6)
(m3/s/day) Ratio of the difference between the reference flow
and the initial hydrograph flow, and the I5 indicator
0 ref 0 6 e 0 Q Q I t t − = − (5)
Average recession rate of flood hydrograph (I7)
(m3/s/day) Ratio of the difference between the peak and the
reference flows, and the elapsed time between them,
taken along the hydrograph recession reach max
max ref 7
ef peak
matrix (U); c is the total number of clusters; and, I is the total number of observations of the sample:
( ) ( )
c I r 2
ob ki ik
k 1 i 1
F u d
= =
=∑ ∑
(10)
6. The fuzzy partition matrix (U(p)) is updated from Equation
(11), where uki(p+1) is the adherence level of the i-th observation
of the k-th cluster of the fuzzy partition matrix (U(p+1)); c is
the total number of clusters; dik(p) and d jk
(p) are the Euclidian
distances from the i-th and j-th observations, respectively, to the centroid of the k-th cluster, obtained from the U(p)
matrix; and, r is the accuracy degree of the method:
( ) ( ) ( )
1 2
p r 1 c
p 1 ik
ki p
j 1 jk
d
u
d
− − +
=
=
∑
(11)
7. If U(p+1) does not differ from U(p) more than an established
limit (the maximum error tolerated), as presented in Equation (12), the iterative process is finished; otherwise,
steps from 3 to 7 are repeated:
( )
max p 1
ε + ≤ε
(12)
In the present study, the maximum error tolerated (εmax)
was adopted equal to 10-5, and the error obtained at each new
iteration (p+1) (ε(p+1)) was calculated from the Equation (13),
where uki is the element of the i-th observation of the k-th cluster
of the fuzzy partition matrixes (U(p) and U(p+1)):
(p 1) max
{
(p 1) ( )p}
ki uki uki
ε + = + − (13)
Definition of r and c parameters
The parameters r and c are, respectively, the accuracy
degree of the fuzzy c-means algorithm and the defined number
of clusters. According to Ross (1995), the appropriate interval
for r is 1.25 ≤ r ≤ 2.00. The number of clusters (c), in turn, is
defined by the researcher, according to the data used, and it can
range from 2 to the total number of indicators.
To define those parameters, it was adopted the method
presented by Bezdek et al. (1984). That method is based on the estimation of three new parameters, Fc and Hc, obtained from
Equations (14) and (15), and (1 - Fc), which is the complement
of Fc. In Equations (14) and (15), uki is the element of the i-th
observation of the k-th cluster of the final fuzzy partition matrix
(U); a is the logarithm base, equal to 10; c, the number of clusters;
and, I is the number of sample observations. Bezdek et al. (1984)
stated those parameters define the ideal number of clusters (c)
and the accuracy degree (r), when Fc approaches 1, and (1 - Fc)
and Hc approach zero.
( ) /
I c 2
c ki
i 1 k 1
F u I
= =
=∑ ∑ (14)
( )
(
.log)
/I c 2
c ki a ki
i 1 k 1
H u u I
= =
= −∑ ∑ (15)
It is necessary to highlight that Equations (14) and (15),
used to calculate Fc, Hc and (1 - Fc), do not belong to the fuzzy c-means method, but rather they are a recommended initial step
for the data clustering algorithm, allowing the definition of both
the number of clusters (c) and the fcm method accuracy degree (r).
Results analysis
The results interpretation has begun with the calculation of
the seven flood indicators for each event of the data set, followed by the identification of the most severe events, according to each
one of the indicators.
This classification aimed to obtain the ten most severe
events, according to each one of the used indicators. So, it is
important to emphasize that, for I1, I2, I3, I4 and I6 indicators, the
classification followed the descending order, while for I5 and I7
indicators, it followed the ascending order, once the lower those values (I5 and I7), the greater is the severity of the event.
Using the seven flood indicators (I1 to I7), calculated for
each observation (each annual flood event), it was made the data pretreatment, by the normalization method, to further application of the fuzzy c-means algorithm.
The ideal number of clusters (c) and the accuracy degree
(r) were defined by trial and error, with c ranging from 3 to 7 and
r ranging from 1.25 to 2.00, in both cases using a 0.25 variation. For each combination of c and r, the Fc, Hc and (1 - Fc) parameters were calculated. So, the ideal values of the number of clusters (c) and of the accuracy degree of the method (r) were reached from
the maximum value of Fc, and the minimum values of Hc and
(1 - Fc) obtained among the attempts.
Finally, after the identification of the ideal values of
number of clusters (c) and accuracy degree, it was analyzed the
results from the application of the fuzzy c-means algorithm. The analysis of results followed this sequence: identification of the defined clusters; verification of the maximum adherence level of the events to their clusters; analysis of the cluster centroids; identification of each cluster severity level; and, event frequency
analysis, according to their severity level.
RESULTS AND DISCUSSION
After the estimation of the flood indicators, they were
ranked according to the severity level. Table 3 presents the ranking
of the top ten highest flood events exhibited by their year of occurrence, according to each flood indicator. Some of the main
events are highlighted in Table 3.
According to the Table 3, it is possible to realize that the
ranking changes according to the flood indicator. For example, the
1983 event is known as the most severe event in the study area, but
other flood indicators, the 1983 event is not even ranked among
the top ten higher events. On the other hand, the 2010 event, which is ranked as the eighth position for I1 and I2 indicators and
it was not even classified among the top ten events for the other
indicators, occupies the first position for I5 and I6 indicators.
In addition, according to the Table 3, it is possible to note a change in the ranking of the highest events for 1957 and
1976 events. The 1957 event appears in the first position only for
I4 indicator, and its ranking position varies for the other indicators.
In a similar way, 1976 event occupies to the first position only
for I7 indicator, and, according to the other indicators, it is not
ranked among the top ten flood events. It is possible to verify,
once more referring to the Table 3, other changes in the ranking
of the events, for example, 1935, 1992 and 2014 events.
If, instead of only presenting the ranking of the top ten
highest flood events, it was presented the complete ranking, with all the 85 events analyzed, it would be possible to affirm that such
variation in the ranking is also observed for the complete data set
of the flood events.
After the estimation of the seven flood indicators
(I1 to I7) for each observation (each annual flood event), the data
pretreatment (normalization method) was applied prior the use of the fuzzy c-means method. The ideal values of the number
of clusters (c) and the accuracy parameter (r) were defined by trial and error, as mentioned previously. Table 4 shows Fc, (1 - Fc) and Hc values, which are the recommended parameters for the
definition of c and r. According to the results, the suggested c and
r values were, respectively, equal to 1.25 and 4, which combination
corresponds to the maximum value of Fc and to the minimum
values of (1 - Fc) and Hc.
Once the goal of the fuzzy c-means algorithm is to minimize
its objective function (Fob), Table 5 presents the Fob values, calculated
for each iteration, using from Equation (10) and adopting c equal
to 4 and r equal to 1,25.
In Table 5, it is possible to notice that the objective
function achieved a stop criterion equal to 10-2 at the iteration
18 (Fob equal to 6.11). However, the process was only interrupted
at the iteration 36, because the maximum error tolerated was
adopted equal to 10-5.
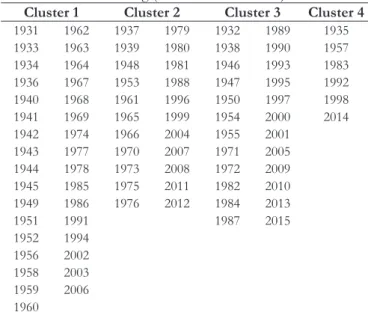
Table 6 presents the clusters identified by the application of the
fuzzy c-means algorithm, considering r equal to 1.25 and c equal to 4,
to the data set of normalized flood indicators.
Considering the clusters presented in Table 6 and the
observed flood events, it can be stated that Cluster 1 is composed, mostly, by events without overflow, except for the 1931 year.
The other clusters (2, 3 and 4) are composed by the events with
overflow, which severity levels differ among themselves.
The composition of the clusters, presented in Table 6,
was determined from the fuzzy partition matrix (U), generated at the end of the process. The fuzzy partition matrix (U) defines
the adherence level of each selected event to each generated
cluster. The maximum adherence level of an event to a given
cluster determines the group to which the event belongs. For
example, it was identified that the highest degree of membership
of the 1931 event was to Cluster 1, so the event belongs to this cluster, while the highest degree of membership of 1932 event
was to Cluster 2, placing this event in cluster 2. Figure 3 shows
the maximum adherence degree of each event.
The adherence degrees, presented in Figure 3, can explain,
for instance, the insertion of an event with extravasation, as the
case of the 1931 event, in Cluster 1, a cluster of events without Table 3. Classification of the top ten highest flood events, according to the flood indicators.
I1 I2 I3 I4 I5 I6 I7
1º 1983 1983 1983 1957 2010 2010 1976
2º 1992 1992 1957 1983 1972 1972 1966
3º 2014 1935 1992 1998 1957 1957 2008
4º 1935 2014 1998 1997 2000 2000 1973
5º 1993 1957 1935 2011 2013 2013 1965
6º 1998 1993 2014 2009 1989 1984 1997
7º 1957 1998 1997 1935 1984 2005 1970
8º 2010 2010 1993 2005 1931 1989 1955
9º 1995 1971 2011 1946 1938 1938 1937
10º 1971 1954 1971 1955 2005 1950 2009
Table 4. Determination of the ideal number of clusters (c) and accuracy degree (r).
r c Fc (1 - Fc) Hc
1.25 3 0.9273 0.0727 0.1266
4 0.9317 0.0683 0.1274
5 0.9289 0.0711 0.1375
6 0.9233 0.0767 0.1464
7 0.9310 0.0690 0.1367
1.50 3 0.8350 0.1650 0.2897
4 0.8335 0.1665 0.3176
5 0.8291 0.1709 0.3383
6 0.8059 0.1941 0.3925
7 0.8128 0.1872 0.3941
1.75 3 0.7568 0.2432 0.4299
4 0.7362 0.2638 0.5075
5 0.7128 0.2872 0.5885
6 0.6578 0.3422 0.7082
7 0.6986 0.3014 0.6726
2.00 3 0.6905 0.3095 0.5459
4 0.6515 0.3485 0.6711
5 0.6183 0.3817 0.7835
6 0.6035 0.3965 0.8569
7 0.5929 0.4071 0.9223
Table 5. Objective function (Fob) values (for c = 4 and r = 1.25). Iteration Fob Iteration Fob Iteration Fob Iteration Fob
1 15.26 10 6.45 19 6.11 28 6.11
2 13.61 11 6.34 20 6.11 29 6.11
3 8.69 12 6.27 21 6.11 30 6.11
4 7.29 13 6.23 22 6.11 31 6.11
5 6.95 14 6.19 23 6.11 32 6.11
6 6.83 15 6.16 24 6.11 33 6.11
7 6.77 16 6.13 25 6.11 34 6.11
8 6.70 17 6.12 26 6.11 35 6.11
extravasation. Observing Figure 3, one can noticed that the 1931 event has a relatively low adherence degree (close to 0.50), while most of the events presented membership degrees of near 1
(maximum value for adherence degree).
Furthermore, from Figure 3, among the 85 events, there were only 12 cases in which the highest membership degree had values lower than 0.90, and there were only 3 situations in which the highest membership degree was lower than 0.50, including the 1931 event, mentioned previously.
It is important to highlight that maximum membership
degree (adherence degree) lower than 0.50 may indicate that the
classification of the event in the cluster is not well defined. Besides,
it is possible that such uncertainty has some relation with the
definition of the initial fuzzy partition matrix, that it was randomly estimated, which could make difficult to the method converges. In the present study, since the maximum adherence degree to a
given cluster was close to 1 for most of the events, the clustering presented in Table 6 was accepted.
Table 7 presents the non-normalized coordinates of the Clusters 1 to 4 centroids, resulted from the application of fcm method.
In Table 7, Cluster 1 represents the set of events without
extravasation, identified by the lowest values of the indicators
centroids. Also, from Table 7, it is also possible to notice that there is a gradual increase in the centroid values for the indicators: peak discharge (I1); peak water level (I2); total overflow volume (I3); time
over the extravasation threshold (I4); and, average rate of flood
hydrograph recession (I7). In other words, Cluster 4 presented higher values than Cluster 3, which, in turn, presented higher values than Cluster 2, and so on. However, that was not observed for indicators I5 and I6, which did not present a well-defined trend.
The variation of the centroid coordinates in each cluster can be better observed in Table 8, through its normalized values,
allowing a graphical representation of easy visualization, shown
in Figure 4.
In addition, it is important to note that the variables I5
and I7 represent quantities inversely proportional to the severity
level. In other words, the lower their values, the more critical
the events, unlike the other flood indicators. Moreover, in the performed analysis, when the events did not show extravasation, a value equal to zero was assigned to those variables, making the
result of the coordinates I5 and I7 of the Cluster 1 centroid also
approached zero, which would represent a catastrophic event for
those indicators. That could be solved by using the complement in relation to the unit from the value obtained for those indicators
in the normalization process, or simply assigning a value equal to 1 when the event did not show extravasation. However, it would not affect the results of the clustering analysis and, for this; this
procedure was not adopted in the present work.
Thus, considering the centroid coordinates, severity levels
were associated to the 4 clusters, defined by the cluster analysis.
For this, the general coordinate behavior of the centroids was used as criterion. In this way, the clusters were named as:
− Cluster 1: low severity; − Cluster 2: medium severity;
Figure 3. Maximum adherence degrees between each event and its cluster.
Table 6. Flood clustering (for c = 4 and r = 1.25).
Cluster 1 Cluster 2 Cluster 3 Cluster 4
1931 1962 1937 1979 1932 1989 1935
1933 1963 1939 1980 1938 1990 1957
1934 1964 1948 1981 1946 1993 1983
1936 1967 1953 1988 1947 1995 1992
1940 1968 1961 1996 1950 1997 1998
1941 1969 1965 1999 1954 2000 2014
1942 1974 1966 2004 1955 2001
1943 1977 1970 2007 1971 2005
1944 1978 1973 2008 1972 2009
1945 1985 1975 2011 1982 2010
1949 1986 1976 2012 1984 2013
1951 1991 1987 2015
1952 1994
1956 2002
1958 2003
1959 2006
1960
Table 7. Centroids coordinates of Clusters 1 to 4 (non-normalized
values for c = 4 and r = 1.25).
Cluster I1
(m3/s)
I2
(m) (kmI33)
I4
(day) (day)I5 (m3/s/day)I6
I7
(m3/s/day)
1 1035.0 4.2 0.0 0.1 0.2 2.3 0.5
2 1657.9 5.4 0.3 12.9 23.6 59.5 32.9
3 2165.3 6.3 1.0 25.8 12.0 135.2 74.7
4 3463.4 8.2 4.5 54.3 19.1 88.4 106.9
Table 8. Centroids coordinates of Clusters 1 to 4 (normalized
values for c = 4 and r = 1.25).
Cluster I1 I2 I3 I4 I5 I6 I7
1 0.10 0.16 0.00 0.00 0.00 0.00 0.00
2 0.24 0.33 0.03 0.15 0.40 0.12 0.17
3 0.35 0.45 0.10 0.29 0.21 0.27 0.40
− Cluster 3: high severity;
− Cluster 4: disasters or catastrophes.
Figure 5 shows the time distribution of events according to their group (or severity level). In Figure 5, the vertical line represents the 1970 year that divides the period from 1931 to 2015,
analyzed in the present study, in two sub periods: from 1931 to 1970
(40 years) and from 1971 to 2015 (45 years).
Table 9 provides a better understanding of the results presented in Figure 5, through the absolute and relative frequencies of events observed in each cluster, for the 1931 to 1970 and from 1971 to 2015 sub periods.
From Figure 5 and Table 9, one can see that there was a
decrease in the absolute frequency of low severity events (Cluster 1)
for the 1971 to 2015 period in relation to the previous period (from 1931 to 1970). There were 23 low severity events between 1931 and 1970 (40 years) and only 10 events with the same severity level between 1971 and 2015 (45 years). On the other hand, there were 9
events classified as high severity or disaster level (Clusters 3 and 4) in the period 1931 to 1970, while 21 events classified at the same
severity levels were observed in the period from 1971 to 2015.
Those variations cannot be explained simply by the difference in size of the two periods analyzed.
In addition to the higher absolute frequency of events classified as high severity (Cluster 3) or disaster (Cluster 4) after 1970, the most catastrophic (highest impact) floods, historically
observed in the study region (1983, 1992 and 2014 events), also occurred in the 1971 to 2015 period.
Observing also the relative frequencies in the two sub
periods presented, according to Table 9, it is even more noticeable
the increase in the more severe event frequency (Clusters 2 to 4)
and the decrease only for Cluster 1, which indicates mostly the
events without extravasation.
Therefore, those observations suggest, in principle, an
aggravation of the flood problem in União da Vitória in recent years. Moreover, it is important to emphasize that is not a goal of the present work to explain the reasons for the decrease or increase in the frequency of flood events classified at a certain severity
level, once the study is only attached to the clustering analysis.
CONCLUSION
The recurrence of extreme events has made it critical to study natural disasters such as floods. In União da Vitória, this type of phenomenon, historically, has been observed frequently.
This work presented a differentiated approach to study those
events, since the classical studies, based exclusively on the analysis
of discharge and water levels, do not clearly demonstrate the reality that this type of phenomenon represents for society, such as the duration of the critical situation and the time available for the adoption of an emergency action.
The flood indicators used in this work showed that there is
a variation in the ranking of the most critical events, considering
each indicator specifically. For example, the flood event observed
in the 1983 year is not the most critical event for some indicators, although it is the most critical event when the indicators are peak discharge and water level.
The fact of the ranking of the most critical events is a
function of the flood indicator used for the analysis, and the possibility of defining more than one flood indicator to represent the flood severity, justifies the application of this new approach, characterized by the use of multivariate statistics and flood
clustering analysis.
From using the fuzzy c-means (fcm) clustering method and defining a set of seven flood indicators (analyzed variables), it was possible to classify the maximum annual flood events observed
Figure 4. Variation of the centroids coordinates of Clusters 1 to 4
(normalized values for c = 4 and r = 1.25).
Figure 5. Time distribution of flood events according to the severity level.
Table 9. Absolut and relative frequencies of flood events in each
cluster, observed in 1931 to 1970, and 1971 to 2015 sub periods.
Cluster
Period: 1931 to 1970 Period: 1971 to 2015 Absolut
frequency
Relative frequency
(%)
Absolut frequency
Relative frequency
(%)
1 23 57.5 10 25.0
2 8 20.0 14 35.0
3 7 17.5 17 42.5
4 2 5.0 4 10.0
in União da Vitória in the 1931 to 2015 period. Four clusters
were identified, representing different severity levels: low severity (Cluster 1); medium severity (Cluster 2); high severity (Cluster 3);
and disasters or catastrophes (Cluster 4).
Through the chronological analysis of the occurrence of
flood events and knowing to which cluster each one belongs, it was verified that there was an increase in the frequency of more severe events (Clusters 3 and 4) and a decrease in the frequency
of low severity events (Cluster 1), considering most recent period (from 1971 to 2015).
In addition, it is important to highlight that the researcher,
regardless of fcm method, must define the number of clusters. In the present study, a specific method was used to determine the number of clusters, which fitted well to the fcm. However, it is
suggested, for future studies, the adoption of other methods to determine the number of clusters, so that it is possible to compare
the results and, possibly, to define the best method to estimate
the ideal value for this parameter.
Besides determining the number of groups, the estimation
of the initial fuzzy partition matrix (U0) could be better evaluated
to avoid randomness in its definition and to skip from initial
values that could lead to non-convergence of the fcm algorithm.
Moreover, analyzing only the clustering method, other
methods capable of clustering and identifying similar characteristics
of historical flood events could be studied, allowing, then, the identification of the best clustering method applied to hydrological
events.
On the other hand, there is still the possibility of studying
new flood indicators, besides those described in this work, capable of a better characterization of the hydrological events and allowing
the comparison among the clustering results.
Moreover, it is believed that, based on the use of flood clustering techniques, it is possible to advance in the knowledge
of the mechanisms that rule the rainfall-runoff transformation process in a given river basin, as well as in the calibration of
hydrological models; where one should try to calibrate the model for each flood cluster. Thus, a set of parameters would be defined for each identified cluster. In this way, the flow prediction model
should be able to predict to which cluster the future event will belong to use the most appropriate parameter setting.
Clearly, at the beginning of the flood, it would not be
possible to identify safely to which cluster the future event belongs
to, so the flood forecasting system would establishing an amplitude
of forecasts from the different sets of parameters. However, in
a context of real-time forecasting, as the event develops itself
and it is observed, the number of clusters to which it possibly belongs would decrease, leading to a reduction in the amplitude of the predictions.
Finally, it is worth mentioning that the present work used the
União da Vitória as a study case, but the fuzzy c-means algorithm
does not apply only to this region. Therefore, regardless of the location, since it is not the purpose of the method to evaluate
the mechanism of flood formation, but rather to collaborate with
its better understanding, it is noticed that the algorithm for the
historical floods clustering is applicable for any place, if historical water level and flow data are available for the analysis.
REFERENCES
ÁGUAS PARANÁ – INSTITUTO DAS ÁGUAS DO PARANÁ.
Curitiba: Instituto das Águas do Paraná, 2016. Available from: <http://www.aguasparana.pr.gov.br>. Access on: 19 jul. 2016.
BEZDEK, J. C.; EHRLICH, R.; FULL, W. FCM: the fuzzy
c-means clustering algorithm. Computers & Geosciences, v. 10, n. 2-3, p. 191-203, 1984.
BREDA, A. Uso de modelo hidrológico ajustado com fracionamento
do hidrograma na previsão da cheia de junho de 2014 em União
da Vitória. In: SIMPÓSIO BRASILEIRO DE RECURSOS
HÍDRICOS, 21., 2015, Brasília, DF. Anais... Porto Alegre: ABRH,
2015.
BURN, D. H.; GOEL, N. K. The formation of groups for regional
flood frequency analysis. Hydrological Sciences Journal, v. 45, n. 1, p.
97-112, 2000. http://dx.doi.org/10.1080/02626660009492308.
CASTANHARO, G.; BUBA, H. Revisão do comportamento
hidráulico do rio Iguaçu na região de União da Vitória e seu impacto na operação hidráulica dos reservatórios de Foz do Areia
e Segredo. Espaço Energia, n. 8, p. 28-38, abr. 2008.
CASTILHO, A. S.; PINTO, E. J. A.; OLIVEIRA, G. S. R. Utilização
de modelo hidráulico associado a um SIG para a definição de áreas
inundáveis na cidade de Governador Valadares, Minas Gerais.
In: SIMPÓSIO BRASILEIRO DE RECURSOS HÍDRICOS,
16., 2005, João Pessoa, PB. Anais... Porto Alegre: ABRH, 2005.
CHANG, L. C.; SHEN, H. Y.; WANG, Y. F.; HUANG, J. Y.; LIN,
Y. T. Clustering-based hybrid inundation model for forecasting flood inundation depths. Journal of Hydrology, v. 385, n. 1-4, p. 257-268, 2010. http://dx.doi.org/10.1016/j.jhydrol.2010.02.028.
CHEBANA, F.; OUARDA, T. B. M. J.; DUONG, T. C. Testing
for multivariate trends in hydrologic frequency analysis. Journal of
Hydrology, v. 486, p. 519-530, 2013. http://dx.doi.org/10.1016/j. jhydrol.2013.01.007.
EM-DAT – EMERGENCY DISASTERS DATA BASE. Centre
for research on the epidemiology of disasters. Belgium: CRED, 2015 Available from: http://www.emdat.be. Access on: 22 nov. 2015.
HAIR JUNIOR, J. F.; BLACK, W. C.; BABIN, B. J.; ANDERSON,
R. E.; TATHAM, R. L. Análise multivariada de dados. 6. ed. Porto
Alegre: Bookman, 2009. Tradução: Adonai Schlup Sant’Anna.
HE, Y.; ZHOU, J.; KOU, P.; LU, N.; ZOU, Q. A fuzzy clustering
iterative model using chaotic differential evolution algorithm for evaluating flood disaster. Expert Systems with Applications, v. 38, n. 8, p. 10060-10065, 2011. http://dx.doi.org/10.1016/j. eswa.2011.02.003.
JINGYI, Z.; HALL, M. J. Regional flood frequency analysis for the
KAVISKI, E.; MINE, M.; GIBERTONI, R. Regionalização de
parâmetros hidrológicos utilizando análise difusa. Revista Brasileira
de Recursos Hídricos, v. 9, n. 3, p. 69-79, 2004. http://dx.doi. org/10.21168/rbrh.v9n3.p69-79.
LAMPINEN, J.; OJA, E. Clustering properties of hierarchical
self-organizing maps. Journal of Mathematical Imaging and Vision, v. 2, n.
2/3, p. 261-272, 1992. http://dx.doi.org/10.1007/BF00118594.
LATTIN, J.; CARROLL, J. D.; GREEN, P. E. Análise de dados
multivariados. São Paulo: Cengage Learning, 2011.
LIN, G.-F.; CHEN, L.-H. A non-linear rainfall-runoff model using
radial basis function network. Journal of Hydrology, v. 289, n. 1-4, p. 1-8, 2004. http://dx.doi.org/10.1016/j.jhydrol.2003.10.015.
LOHANI, A. K.; GOEL, N. K.; BHATIA, K. K. S. Improving
real time flood forecasting using fuzzy inference system. Journal
of Hydrology, v. 509, p. 25-41, 2014. http://dx.doi.org/10.1016/j. jhydrol.2013.11.021.
MACHADO, M. L.; NASCIMENTO, N.; BAPTISTA, M.;
GONÇALVES, M.; SILVA, A.; LIMA, J. C.; DIAS, R.; SILVA,
A.; MACHADO, E.; FERNANDES, W. Curvas de danos de
inundação versus profundidade de submersão: desenvolvimento
de metodologia. Revista de Gestão de Água da América Latina, v. 2, n. 1, p. 35-52, 2005.
MESSNER, F.; PENNING-ROWSELL, E.; GREEN, C.; MEYER,
V.; TUNSTALL, S.; VEEN, A. V. D. Evaluating flood damages: guidance
and recommendations on principles and methods. Wallingford:
FLOODsite, 2006. Relatório Técnico T09-06-01.
MINE, M. R. M.; TUCCI, C. E. M. Previsão em tempo real de
vazões afluentes a reservatórios de usinas hidrelétricas. Revista
Brasileira de Recursos Hídricos, v. 4, n. 2, p. 73-95, 1999. http://
dx.doi.org/10.21168/rbrh.v4n2.p73-95.
MINE, M. R. M.; TUCCI, C. E. M. Gerenciamento da produção
de energia e controle de inundação: Foz do Areia no rio Iguaçu.
Revista Brasileira de Recursos Hídricos, v. 7, n. 3, p. 85-107, 2002.
http://dx.doi.org/10.21168/rbrh.v7n3.p85-107.
PAZ, A. R. D.; COLLISCHONN, W.; TUCCI, C. E. M. Simulação
hidrológica de rios com grandes planícies de inundação. In: SIMPÓSIO BRASILEIRO DE RECURSOS HÍDRICOS, 18.,
2009, Campo Grande, MS. Anais... Porto Alegre: ABRH, 2009.
PEREIRA, M. C. B., SCROCCARO, J. L. Bacias hidrográficas do Paraná. Curitiba: Secretaria de Estado do Meio Ambiente e
Recursos Hídricos, 2010.
ROSS, T. J. Fuzzy logic with engineering applications. Inglaterra: John Wiley & Sons Ltda, 1995.
SADRI, S.; BURN, D. H. A fuzzy c-means approach for regionalization using a bivariate homogeneity and discordancy
approach. Journal of Hydrology, v. 401, n. 3/4, p. 231-239, 2011.
http://dx.doi.org/10.1016/j.jhydrol.2011.02.027.
SATO-ILIC, M.; JAIN, L. C. Innovations in fuzzy clustering. Heidelberg: Springer, 2006.
SRINIVAS, V. V.; TRIPATHI, S.; RAO, A. R.; GOVINDARAJU, R.
S. Regional flood frequency analysis by combining self-organizing
feature map and fuzzy clustering. Journal of Hydrology, v. 348, n.
1-2, p. 148-166, 2007.
STEFFEN, P. C. Agrupamento de cheias históricas. 2017. 178 f.
Dissertação (Mestrado em Engenharia de Recursos Hídricos e
Ambiental) - Universidade Federal do Paraná, Curitiba, 2017.
TUCCI, C. E. M. Hidrologia: ciência e aplicação. Porto Alegre: Editora UFRGS / ABRH, 2012.
TUCCI, C. E. M.; BERTONI, J. C. Inundações urbanas na América do Sul. Porto Alegre: Editora UFRGS / ABRH, 2003.
TUCCI, C. E. M.; PORTO, R.; BARROS, M. T. Drenagem urbana. Porto Alegre: Editora UFRGS / ABRH, 1995.
WANG, L. N.; CHEN, X. H.; SHAO, Q. X.; LI, Y. Flood indicators
and their clustering features in Wujiang River, South China. Ecological Engineering, v. 76, p. 66-74, 2014. http://dx.doi.org/10.1016/j. ecoleng.2014.03.018.
ZAHMATKESH, Z.; KARAMOUZ, M.; NAZIF, S. Uncertainty based modeling of rainfall-runoff: combined differential evolution
adaptive Metropolis (DREAM) and K-means clustering. Advances in
Water Resources, v. 83, p. 405-420, 2015. http://dx.doi.org/10.1016/j. advwatres.2015.06.012.
Authors contributions
Patrícia Cristina Steffen: Article writing, data analysis and interpretation, general design, final review.
Júlio Gomes: Guidance, general design, proofreading, final review