Characterizing the determinants of berry acidity in the
grapevine
IRINEOS HADJIFILIPPOU
Dissertation to obtain the degree of
European Master of Science in Enology and Viticulture
Advisor: Laurent Torregrosa
Assistant: Miguel Costa
Jury:
President:
Jorge Manuel Rodrigues Ricardo da Silva (Phd), Full Professor at Instituto Superior de Agronomia, Universidade de Lisboa
Members:
- Laurent Torregrosa (Phd), Full Professor at Montpelier SupAgro.
-Carlos Manuel Antunes Lopes (Phd), Associated Professor with habilitation at Instituto Superior de Agronomia, Universidade de Lisboa.
-Joaquim Miguel Rangel da Cunha Costa (Phd), Assistant Professor at Instituto Superior de Agronomia, Universidade de Lisboa.
-Luísa Cristina dos Mártires Ferreira de Carvalho (Phd), Pos-Doc Researcher from Fundação a para a Ciência e a Tecnologia.
Abstract
Global warming is expected to be a major issue for grapevine productivity and sustainability in the long-term future. Major grapevine characteristics at berry level (physiological development and com-position) but also at the whole plant level (e.g. sugar accumulation, malic acid respiration, photosyn-thesis rate etc) are expected to be changed by elevated temperatures. In order to further decipher major berry physiology and development traits, data from two different experimental conditions and
V.vinifera genotypes were used. The data set from experiment 1 was obtained from three genotypes
(Merlot, G7 and G14 which are interspecific crossings of V. vinifera x V. rotundifolia, (macrovine) and possess the trait VDQA – “Vins de qualité à teneur réduite en alcool”, which produce wines with lower alcohol content. Plants were grown in open field conditions and berry development was mon-itored every week since early stages to over-ripeness providing a full berry development curve. In a second trial,76 genotypes were tested at two key stages, at green stage (just before ripening onset) and at ripe stage (maximum berry volume) to explore the diversity of primary metabolites and cations that exist in a progeny of microvine deriving from a cross. The progeny derived from a crossing of V3 microvine (female dwarf plant) with G14. Data analysis provided important information on berry development at limited number (8 berries maximum) and at large number (hundreds) scale for all parameters (glucose + fructose, tartartic acid,malic acid,potassium). In addition, complex berry pa-rameters such as titratable acidity were calculated on the basis of simple papa-rameters (e.g. anions and cations). Finally, our results showed that the genetic variability of V. vinifera is potentially inter-esting to identify QTLs that can be used in breeding programs to develop new grapevine genotypes more suitable to climate change conditions.
Keywords: microvine, potassium, organic acids, malate metabolism, total acidity Resumo
O aquecimento global é uma questão relevante para a produtividade e a sustentabilidade da videira no futuro a longo prazo. Espera-se que o desenvolvimento fisiológico e a composição do bago sejam caracteristicas alteradas por temperaturas elevadas, enquanto ao nível da planta inteira se esperam alterações por exemplo, em termos da acumulação de açúcar, respiração málica, taxa fotossintética, etc. De forma a melhor caracterizar as principais características fisiológicas e de desenvolvimento do bago, foram utilizados dados de dois ensaios e condições experimentais e genótipos diferentes. O primeiro conjunto de dados foi obtido a partir de três genótipos (Merlot, G7- cruzamento interespecífico de V. vinifera x V. Rotundifolia; e G14 – genótipo (V. vinifera x V.
Rotundifolia) contendo a caracteristica VDQA – “Vins de qualité à teneur réduite en alcool”, que se
caracteriza por um baixo conteúdo em álcool no vinho), todos cultivados e condições de campo e cujo desenvolvimento do bago foi monitorizado semanalmente desde estádios de desenvolvimento iniciais até à maturação fornecendo assim uma curva completa de desenvolvimento do bago. Além disso, uma “progênie” de plantas de Microvinha derivadas do cruzamento V3xG14 forneceu dados para dois estádios-chave de desenvolvimento do bago verde e duro) e estádio maduro (tamanho máximo do bago). A análise de dados forneceu dados relevante sobre o desenvolvimento do bago quer usando amostras de pequena dimensão (8 bagos no max.) quer amostras de grande dimensão
(ex. várias centenas de bagos) para todos os parâmetros (glucose + frutose, ácido tartárico, ácido málico, potássio). Foram também calculados parâmetros complexos como a acidez titulável a partir de parâmetros mais simples (aniões e catiões dos bagos). Finalmente, os resultados mostraram que a variabilidade genética da V.vinifera é potencialmente interessante para se identificarem QTLs que poderão ser usados em programas de melhoramento da videira e na obtenção de novos genótipos melhor adaptados ás mudanças climáticas
Abbreviations
CO2 Carbon dioxide
oC Degree Celsius M Molarity TA Tartaric acid MA Malic acid CA Citric acid K+ Potassium
AA Ascorbic acid or Vitamin C
L-ldnDH L-idonate dehydrogenase
PEP Phosphoenolpyruvate
PK Pyruvate kinase
NADP-ME NADP-malic enzyme
PEPC Phosphoenolpyruvate carboxylase
OAA Oxaloacetic acid (AOA: french term)
NAD- MDH NAD-malate dehydrogenase
MS Malate synthase
PEPCK Phosphoenolpyruvate carboxykinase
RQ
QTL Respiration quotient Quantitative trait locus SDH
SD Succinate dehydrogenase Sampling date
VDQA Vins de qualité à teneur réduite en alcool
List of figures and tables
Figure 1 Impact of climate change on wine growing regions.
Figure 2 Berry development and evolution during different stages.
Figure 3 Metabolic pathways of malate synthesis and degradation
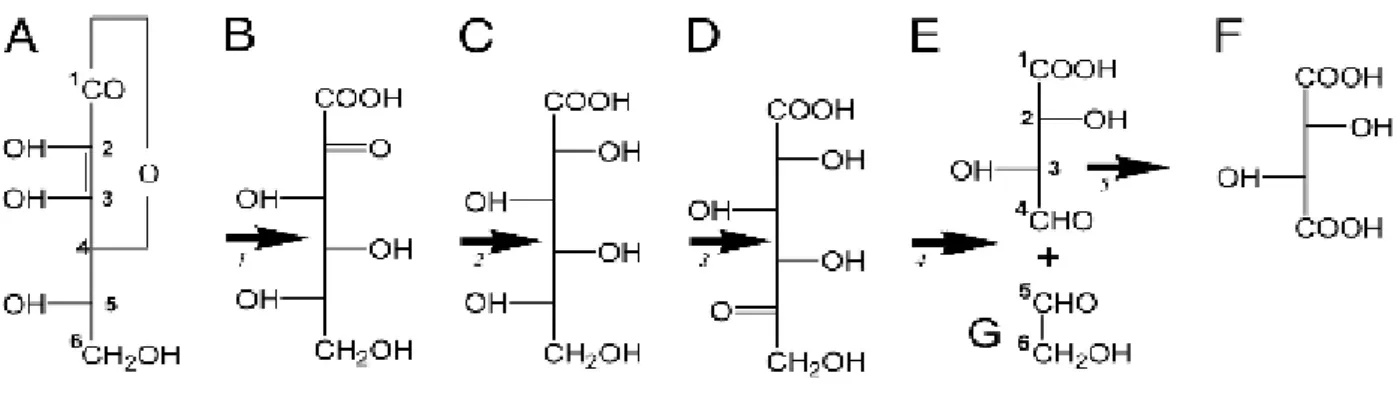
Figure 4 Steps of L-tartaric acid biosynthesis.
Figure 5 Comparison between stage duration of normal grapevine and microvine.
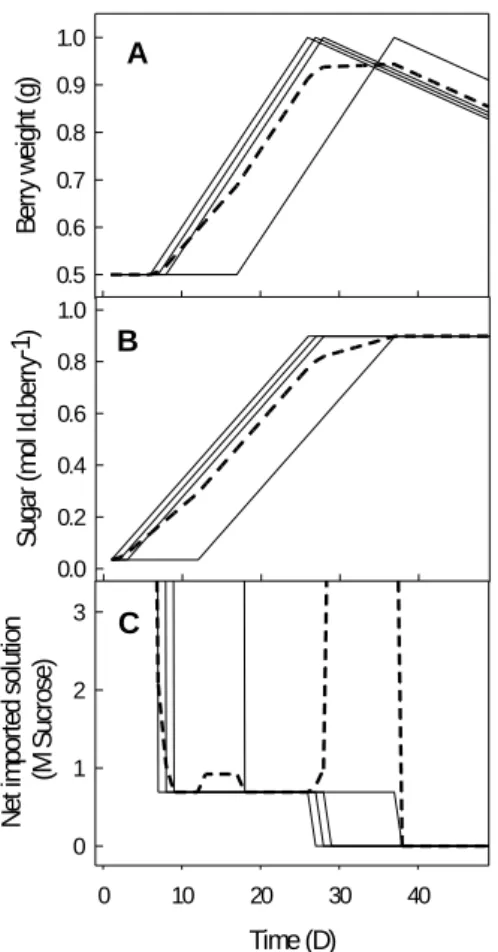
Figure 6 Effect of asynchrony on mean value of berry weight, and sugar for multiple berries
Figure 7 Evolution of berries weight from green to overripe stage
Figure 8 Evolution of glucose + fructose concentration from green to overripe stage
Figure 9 Evolution of tartaric acid concentration from green to overripe stage
Figure 10 Evolution of malic acid concentration from green to overripe stage
Figure 11 Evolution of potassium concentration from green to overripe stage
Figure 12 Regression coefficient between calculated and measured total acidity
Figure 13 Regression coefficient between pH and measured total acidity
Figure 14 Relationship between pH and potassium-malic acid
Figure 15A Histogram for distribution of all values of glucose + fructose content at green stage
Figure 15B Histogram for distribution of all values of glucose + fructose content at ripe stage
Figure 16A Histogram for distribution of all values of tartaric acid content at green stage Figure 16B Histogram for distribution of all values of tartaric acid content at ripe stage
Figure 17A Histogram for distribution of all values for malic acid content at green stage
Figure 17B Histogram for distribution of all values for malic acid content at ripe stage
Figure 18 Increment groups of berry growth from green to full berry volume stage
Figure 19A Histogram for distribution of all values for potassium at green stage
Figure 19B Histogram for distribution of all values for potassium at ripe stage
Figure 20 Figure 21A Figure 21B
Evolution of Calculated total acidity from green (G) to ripe stage (R) for 20 extreme genotypes.
Relationship between total acidity and berry weight at green stage. Relationship between total acidity and berry weight at ripe stage. Table 1
Table 2
Sampling dates for Merlot, G7 and G14
Acknowledgements
My master thesis is a result of a team work and I am grateful that I had the opportunity to work with all the members of this team.
Firstly, a special thanks goes to my family who have been supporting me all the way and made it possible to finish the master, they are the ones that have been supporting me during the stressful periods of life such as finishing my thesis. Additionally, I would like to thank my friends that have been always there for me and gave me their useful opinion in many problems that I needed advice. Furthermore, I would like to express my gratitude to Antoine Bigard which was by far the person that I used to talk and discuss about every aspect of my thesis. His constant patience and talent in explaining all the small details of berry physiology and his great help while struggling with statistical analysis made my work much easier and pleasant. I truly feel lucky and honored being able to work with him in this project.
Another special thanks should be given to Dr. Romieu for all the time he spent in order to simply and effectively explain to me all the complex parameters regarding grape berry physiology and even more; his passion for his work is a true inspiration for me.
Finally, I would like to thank Mr. Laurent Torregrosa for providing me the opportunity to be part of his team and additionally I would like to express my gratitude for his guidance throughout the whole process of writing and correcting my thesis.
Contents
I.
Introduction ... 1
1.1.
Climate change and effects on grapevine’s physiology ... 1
1.2.
Berry development ... 2
1.3.
Sugars ... 4
1.4.
Acidity ... 5
1.4.1.
Malic acid ... 5
1.4.2.
Tartaric acid ... 7
1.4.3.
Potassium ... 7
1.5.
Water and berry relations ... 8
1.6.
Asynchrony on berry ripening onset ... 8
1.7.
Genetic pool of grapevine and use of microvine in experiments ... 9
1.8.
Microvine as an experimental tool ... 10
II.
Working hypothesis ... 11
III.
Material and methods ... 12
3.1.
Plant material and growing conditions ... 12
3.2.
Sampling methods ... 12
3.3.
Titratable acidity and organic acids analysis ... 14
IV.
Results and discussion ... 15
4.1
Description of fruit development for Merlot, G7 and G14 ... 15
4.1.1
Average weight ... 15
4.1.2.
Glucose + Fructose ... 16
4.1.3.
Tartaric acid ... 17
4.1.4
Malic acid ... 18
4.1.5.
Potassium ... 19
4.2. Use of simple data to calculate complex variables ... 19
4.3. Diversity of V3xG14 progeny for all major metabolites ... 22
4.3.1. Glucose + Fructose... 22
4.3.2. Tartaric acid ... 23
4.3.3.
Malic acid ... 24
4.3.4.
Potassium ... 26
4.4. Extreme genotypes of Microvine progeny for acid accumulation ... 27
V.
Conclusions ... 28
Literature cited ... 30
I.
Introduction
1.1.
Climate change and effects on grapevine’s physiology
Grapevine is one of the most important cultivated fruits worldwide. The crop occupies a total surface of 7.6 million hectares part of which produce 265 million hectoliters of wine in 2013 (OIV, 2013). Wine production represents 48% of the total grape production whereas table and dried grapes are representing 36% and 8% of the total (OIV, 2016). Concerning production of wine grapes, it has been increasing since 2000 despite a reduction in the cultivated area due to improved viticultural techniques that are being applied in vineyards and increase productivity (e.g. irrigation, canopy management, fertilization).
As foreseen by several simulation models, modification of global environmental conditions is
expected where most significant changes will be observed by the end of the 21st century leading to
alteration of berry production in both quantity and quality (Santos et al., 2011 ; Stöckle et al., 2010). Environmental factors such as air and soil temperature, precipitation, solar radiation and carbon dioxide concentration (CO2) will be modified (Webb et al., 2008; Costa et al., 2016) (Fig.1). According
to Hannah et al., (2013) most of the regions where vines are grown will experience an increase of average temperature (2-4°C) resulting in major biochemical and physiological alteration to the vines (Chaves et al., 2010; Simmoneau et al., 2017). Climate change will also force growers to implement adaptations of agronomic strategies against heat and drought (Costa et al. 2016).
Because elevated temperatures play a significant role over plants physiology several studies have been conducted to assess those effects. An experiment conducted in cereals by Barnabas et al., (2008) showed that starch accumulation was impaired under warmer conditions. Because grapevine productivity depends on carbohydrates in perennial organs (Holzapfel et al., 2010), we may speculate that carbon partitioning to flowers and berries might also be disrupted or at least largely affected. Moreover higher temperatures (up to +4 °C) are going to expedite grape harvesting by advancing all physiological stages from bud burst to ripening (Jones et al., 2005 ; Duchêne and Schneider, 2005). In more detail, it has been observed in Australia that warm conditions can advance bud-burst up to 18 days exposing flowering and berry ripening to more stressful conditions such as
Figure 1. Impact of climate change on wine growing regions (indicated by dots) and forecast for
higher temperatures (Webb et al., 2007). This can result in unbalanced wines with lower varietal aromas, microbiological instability and limited aging ability (De Orduna, 2010). High temperatures lead to increased malic acid respiration resulting in grapes with lower acidity and higher pH (Hale and Buttrose, 1974 ; Kliewer, 1966 ; Buttrose and Hale, 1971). Secondly, sugar accumulation is accelerated by higher temperature (Keller, 2010) producing high alcohol wines, thirdly anthocyanin levels can be affected by either obstructing their biosynthesis (Mori et al., 2005) and/or accelerated degradation (Mori et al., 2007). Finally, yield reduction can occur due to lower number of berries and smaller berry size at harvest (Rogiers et al., 2011 ; Hale and Buttrose, 1974).
Apart from elevated air temperature, air CO2 concentration may also have an impact on
grapevine physiology. A study in Australia showed that elevated levels increased rate of photosynthesis in combination with high temperatures or even without (with lower significance) (Edwards et al., 2017). Moreover, Wohlfahrt and Stoll, (2016) have shown that contrary to the effect
of higher temperatures, traits such as yield, vigor and biomass increased under elevated air CO2
conditions(480-500ppm) however results did not show the same consistency for yield between the
different years of experimentation.
1.2.
Berry development
Formation of grape berry initiates through pollination, fertilization and development of at least one seed and grapes with more seeds become larger compared to those that have less. Few days after fertilization endosperm nucleus starts dividing and 2-3 weeks later the zygote division initiates as well (Pratt, 1971). As the fertilized ovule is transformed into the seed, the embryo, seed coat and endosperm produce and release auxins in the pericarp stimulating gibberellins synthesis. Auxins are responsible for cell division whereas gibberellins induce cell expansion (Serrani et al, 2007) and both hormones induce pistil development to fruit and differentiation of the exocarp (skin) and mesocarp (flesh or pulp), in general fruit set is highly controlled from those two hormones.
Following fertilization, a second period of cell division initiates and different multiplication rates are observed in the different berry compartments. The polar nucleus of the seed divides during the first three weeks after anthesis whereas zygote cells of embryo begin dividing only 2-4 weeks after anthesis. Regarding cell division, an intense doubling of cells (17x fold) occurs before anthesis compared to post anthesis (1-2x fold) and mesocarp cells stop dividing 3-4 weeks after anthesis whereas skin cells continue up to 5-6 weeks after anthesis (Coombe, 1976) and everything is finished just before entering lag phase. Ojeda et al., (1999) compared the evolution of berry volume and total DNA, which is probably more precise than counting cells on a limited number of berries. Cell division progressively decreases from anthesis to growth phase, and there was an average 8-fold increase on cell volume. Finally, berry size growth after lag phase is due to cell expansion where the cell wall becomes thinner and mesocarp cells can experience a 300-fold increase of cell size from anthesis to maturity or 15 between fruit set and maturity (Coombe, 1976) whereas Ojeda et al, (1999) report another 8-fold increase on average cell volume. Finally, as a general developing
significant physiological changes take place (Fig. 2) and it is categorized as a non-climacteric fruit (Mailhac and Chervin, 2006).
Figure 2: Berry development and evolution (Kennedy, 2002). During the different stages (I, II, III)
berry undergoes several changes. The two rapid growth stages (Stage I, III), are separated by lag phase. At Stage I cells divide and elongate while seeds are formed, at the same time organic acids accumulation initiates. At stage II (lag phase) malic acid reaches a maximum concentration followed by “veraison” stage indicated firstly by softening and followed by berry colouring. Finally Stage III (berry ripening) initiates with a fast increase in berry size while sugars start accumulating in the berry, at the same time malic acid respiration begins whereas tartaric acid concentration remains stable and the observed decrease is caused by dilution of berry size increase, Source: Terrier et al., 2005. Stage I (green growth phase) is characterized by fast size increase of seeds and pericarp. At this stage embryo is formed in seeds, berry is hard and accumulates organic acids and very little sugar. Hormones such as auxins, cytokinin and gibberellins which are being produced by seed embryo in early stages decrease during this period (Böttcher et al., 2013 ; Pérez et al., 2000). The functional role of gibberellins is to promote cell elongation whereas auxins influences production and differentiation of vascular bundles to ensure vascular transport and berry growth (Keller, 2015). The duration of this phase is 6-9 weeks and finishes when cell division ceases (Staudt et al., 1986). At this time berry attains half of its final size.
The Stage II (herbaceous plateau or lag phase) follows growth phase, at this point (10-15 days before veraison) seeds start maturing, reach full size and tannins present a maximum concentration (Adams, 2006). Moreover, concentration of auxins reach a peak at this phase and after that it decreases rapidly, this might be due to the fact that auxins enable seeds to fully mature before fruit ripening as it inhibits maturation. Moreover, abscisic acid (ABA) concentration was shown to peak at the onset of ripening (Owen et al., 2009) playing a significant role on berry softening, yet the exact timing in relation to softening and pressure (P) is not known (Gambetta et al., 2010).
Additionally, abscisic acid (ABA) presents a high concentration which increases by the end of Stage II and blocks gibberellins production to suppress further embryo growth (Davies and Bottcher, 2009) Stage IIΙ (ripening period) onset is characterized by a period of 7-10 days within a cluster and is termed “veraison”. It has been reported that transition to Stage III is characterized by sudden berry softening (in a 24h period), sugar loading, skin color change (green to red - purple for red cultivars or yellow for white) and seed hardening- color change (green to yellow – brown). However, various literature sources report that turgor pressure (P) end elasticity (E) start to decrease 10 days before transition from stage II to stage III indicating that softening occurs before sugar loading and color development (Wada et al., 2009 ; Castellarin et al., 2015). Ripening period usually expands
5-10 weeks andfollowing full berry maturity overripening occurs, at this stage phloem activity ceases
whereas sugar and potassium are no longer accumulating in the berry. Dehydration occurring at this period leads to changes of concentration of primary metabolites (sugars, acids).
1.3.
Sugars
Grape berries are “sink organs” which use carbohydrates for their growth and development coming from photosynthesis in the mesophyll of mature leaves and in some cases green berries photosynthesize also but at a small scale. Concentration in Vitis species presents high variability ranging from 46 to 164 g/l for both glucose and fructose (Dai et al., 2011). The main carbohydrates are sucrose and fructose (95%) with some exceptions of other Vitis species that can contain up to 30% of sucrose. Ratio of glucose/fructose is 1:1 at full berry size for most V. vinifera (Kliewer. 1967) and in terms of sugar unloading in the berry it takes place via phloem during berry softening stage before any observed colour change (Wada et al., 2009). In the vacuole of mesocarp cells, glucose and fructose accumulate massively after veraison and within a period of 20 days content reaches 1M with a ratio of glucose/fructose equal to 1, high levels of sucrose accumulated in berry are hy-drolysed by invertases leading to formation of glucose and fructose. Transportation in the plant
oc-curs though a symplastic (plasmodesmata) or apoplastic mechanism, recently it has been demon-strated that a shift from the first to the second occurs at the onset of ripening (Zhang, 2006). Regard-ing wine quality sugars play one of the most important roles as yeasts convert them into alcohol during fermentation. Additionally, they serve as precursors of organic acids, phenolic and aroma compounds synthesis (Dai et al., 2011). Organoleptically sugars affect perception of sweet taste and in combination with acids they are part of a balanced wine. Finally, general sugar concentration is considered as a relatively stable trait and presents low response to environmental conditions and viticultural practices (Keller et al., 2005). Sugars are considered to be one of the main challenging factors that need to be controlled in the future with ongoing climate change (Luchaire et al., 2017).
1.4.
Acidity
Acidity of grape berries is one of the main characteristics influencing fruit organoleptic quality. Berry acidity is mainly related to tartaric (TA), malic (MA) and citric acid (CA) coupled with cation concentration mainly potassium (K+). Malic and tartaric are the main acids whereas citric has a minor
role (Wu and Chen, 2016). Regarding metabolism, TA is not used in any primary metabolic pathway whereas MA is partially or fully metabolized after veraison initiation (maximum transpiration at 10 days) and throughout ripening (Sweetman, 2009).
1.4.1.
Malic acid
Malate can be found in plant cells in three forms MA, malate 1- or malate 2- and its transportation
into the vacuole is mediated by malate transporters (Wu and Chen, 2016). At all stages of berry growth (initial formation until full fruit ripeness and even at over ripeness) concentration is subjected to changes (Lechaudel et al., 2005 ; Wu et al., 2002). Malate formation takes place at pre-verasion stage where the main mechanism of accumulation is sucrose translocation from the leaves which enables malate formation by enzymes present in the grapes (Hale, 1962). Regarding concentration at different stages, it reaches up to 15 mg/g in green berries and 7 or more days after veraison a decrease to 2-3 mg/g of fresh weight (FW) is observed (Kliewer, 1965 ; Ruffner, 1977) which accounts to a loss of 5-10 μmoles per day. The main driver for formation and degradation is
temperature, at pre-veraison stage. Temperatures of 20-25 oC lead to higher levels of MA, whereas
above 38 oC a strong decrease is observed (Kliewer, 1964). For that reason, it is observed that
regions with colder climate present higher levels in comparison with warm regions.
Despite the fact that several radiolabeling experiments have been conducted regarding malate synthesis it is still not yet fully evident whether it occurs only in the berry or if a part is transported from other tissues (Beriashvili, 1996 ; Kliewer, 1964). In order to investigate that, an experiment by Hunter and Ruffiner, (2001) showed that disruption of phloem by girdling does not affect malate content in grapes at any stage giving birth to the idea that it is mostly synthesized in the berry. This observation contradicts to the results from Hale (1962) which is the commonly accepted theory of today. The experimental design and performance of the experiment should be examined in the case of Hunter and Ruffiner (2001).
Synthesis is based on four main “routes”, namely glycolysis, TCA, glyoxylate cycle and photosynthesis which is not deeply analyzed due to limited contribution. Firstly, regarding Glycolysis (PEPC-MDH, pyruvate kinase bypass) it is considered as the main pathway of malate synthesis. PEPC directly converts PEP formed by glycolysis to oxaloacetate which is then reduced to malate by MDH (ig. 3 – green stage) by using excess NADH produced by glycolysis, the global reaction is
glucose + 2CO2 = 2 malate + 4H+. This reaction produce acidity that must be detoxified from the
cytoplasm, upon H+ pumping in the vacuole through the action of V-ATPase and PPiase (Terrier et
al., 2001) while malate is transported by an inward rectifying anion channel recently identified in plants. Incapacity to transport acid in the vacuole inhibits PEPc and activates malic enzyme, the
global regulation being known as “Davies pH stat”. In other words, malate synthesis and degradation are seen as the major way to regulate cytoplasmic pH very close to neutrality in plants. MDH takes part in both malate synthesis and degradation and at different developmental stages low or high activity is observed (Taureilles-Saurel et al.,1995).
Finally, malate formation can also occur though the Glyoxylate cycle where synthesis occurs in the glyoxysomes and gloyxylate is converted to malate by malate synthase (MS). It has been shown by Terrier et al., (2005) that high expression levels of the enzyme take place in young berries during green stages.
On the contrary, at the stage where veraison initiates and hexose accumulation and synthesis are favored (in contrast to sugar catabolism) malate degradation initiates as malic acid is released from the vacuole and catabolized (Ruffner and Hawker, 1977). As reported, malic acid serves as substrate in the process of respiration during ripening (Terrier and Romieu 2001 ; Chen et al., 2009 ; Moing et al., 2001) and the general degradation mechanisms are the following: gluconeogenesis, respiration and the least significant non-phosphorylating pathway of respiration and NAD-dependent malic enzyme (NAD-ME). In the first case, NAD-MDH action converts malate to OAA phosphoenolpyruvate followed by carboxykinase (PEPCK) which is the key enzyme that converts oxaloacetic acid (OAA, OAO: french term) to phosphoenolpyruvate (PEP) which is needed for gluconeogenesis (Fig. 3 - ripening). Although PEPCK expression increases at post-veraison leading to gluconeogenesis, in all cases sugar translocation from leaves is the major source of sugars in fruit compared to synthesis from malate (Ruffner and Hawker, 1977; Beriashvili, 1996). Another observation that empowers this hypothesis is the respiration quotient (ratio of CO2 evolution against
O2 consumption) which in numerous varieties presents an increase up to 1,5 at post- veraison (Harris
et al., 1971). This could support the hypothesis that malate is used as a fuel for respiration releasing more CO2 than O2 per molecule of sugar or starch during berry ripening, however it must be
underlined that stressful conditions that lead to ethanol, aminobutyrate or proline production can also affect RQ ratio (Romieu et al., 1992). By taking into account all those factors it can be concluded that malate does not increase respiration significantly but it might serve to maintain respiration during ripening at the point of sugar direction in the vacuole.
Figure 3. Metabolic pathways of malate synthesis (green stage) and degradation (ripening stage).
PEPC: phosphoenolpyruvate carboxylase; MDH: malate dehydrogenase; PEPCK: phosphoenolpy-ruvate carboxykinase; ME: malic enzyme; PEPCK: phosphoenolpyphosphoenolpy-ruvate. Source: Charles Romieu – personal file.
1.4.2.
Tartaric acid
L-Tartaric acid (TA) is the major acid in mature grapes and wine contributing in various quality aspects of wine such as taste, mouthfeel, and aging potential. Contrary to other plant species grapevine presents high amounts of L-tartaric acid (TA). Accumulation of TA initiates at post-anthesis stage and progressively decreases until veraison just before the onset of ripening and 60-70 days after flowering a plateau is reached leading to total amount stabilization. Tartaric acid accumulates more rapidly than malic acid following anthesis, but malic acid synthesis rapidly exceeds that of tartaric acid, so the osmotic contribution of tartaric acid is lower than that of malic acid,finally tartaric acid concentration starts to decline quite early during green stage, during the two successive growth periods (Hale, 1977). Regarding tartaric acid concentration a study that was conducted in 98
V.vinifera cultivars by Liu et al., (2006) reported concentrations ranging from 1.57 to 9.09 and 1.54
to 9.05 mg/mL for two different years. Finally, biosynthesis of TA occurs from L-ascorbic acid (AA, Vitamin C) (Saito & Kasai, 1969) and according to the pathway presented in Figure. 4. Despite the progress already made no enzymes have been identified yet for the intermediate reactions beside the identification and characterization of the gene encoding enzyme L idonate dehydrogenase (L -IdnDH) which is responsible for catalysing the conversion of L -idonate to 5-keto D-gluconic acid (step 3 in Fig. 4) (DeBolt et al., 2006).
1.4.3.
Potassium
Potassium (K+) is the most abundant cation in both grapevine and grape berry and it plays a key role
in numerous physiological and biochemical processes (Conde et al., 2007). Potassium plays a key role in the regulation of membrane potential and may therefore influence the uptake of sugars and other anions. Additionally, it maintains balance between cations-anions in cytoplasm, it activates some enzymes and contributes to synthesis of starch (Wang and Wu, 2013; Shabala and Pottosin,
2014). Programmed cell death and senescence are also regulated by K+ (Shabala, 2009) and its
deficiency is linked to ripening disorders at late stages (Tilbrook and Tyerman, 2008). Moreover, potassium affects berry growth, phloem transport and turgor maintenance (Liesche, 2016). Its trans-portation in plants occurs from both xylem and phloem but the phloem is the main route (Rogiers et
al., 2006) where its concentration is 10x more compared to xylem (Marschner, 1995 ; Keller, 2015). According to Rogiers et al., (2006b) K+ represents 80% of berry cations with different percentages in
berry compartments (skin, flesh, seeds) of Shiraz, where 59%, 32% and 6% of total K+ concentration
was present in mesocarp, exocarp and seeds respectively. Despite the fact that seeds contain high amount they represent only a small fraction of total berry weight. Accumulation factors are related to environmental conditions and cultural practices, in more detail canopy management, rootstock se-lection, fertilization addition and irrigation are considered the most important ones. (Mpelasoka et al., 2003; Kodur, 2011). Regarding uptake, it is mediated by membranes that are being assisted from channels and transporters with low and high affinity (Gierth and Mäser, 2007; Alemán et al., 2011; Mitra, 2015). Regarding wine quality potassium plays a crucial role, high K+ promotes the
precipita-tion of potassium bitartrate that is a quite insoluble salt (Boulton, 1980 ; Gawel et al., 2000). On the contrary high levels of K+ in the berry might decrease malic acid degradation by inhibiting its transfer
from the vacuole to the cytoplasm where it is degraded(Hale, 1977). Observations in different
re-gions with warm or colder climate showed high and lower levels of potassium. Somers, (1977)
reported 22 – 32 mmol/L (860 – 1,279 mg/L K+) of K+ in Bordeaux which are considered to be
“nor-mal” whereas in Australia levels of 27 – 71 mmol/L K+ (1,056 – 2,776 mg/L K+) were found and considered as “high” (Somers 1975). Finally, it is widely reported that higher levels of potassium lead to higher pH levels affecting microbial stability and aging ability of the wine.
1.5.
Water and berry relations
Water is absorbed by roots (99%) and is the most abundant constituent of grapes (75-85%) and wine (65-94%) (Conde et al., 2007). Berry size of grapes is mostly dependent on cell enlargement which is affected by water inflow and retention by the mesocarp vacuoles so, water is the major component of the ripening berry (Keller, 2015). Soil water deficit is the primary factor that can lead to smaller berries (due to the inhibition of cell division and cell expansion) which affects the final concentration of sugars, acids, cations, anthocyanins and tannins. Concerning water influx in berry it occurs from both xylem and phloem and it has been shown that volume gain before veraison is through xylem import (accounting for 75% of the total amount) whereas post veraison growth is due to phloem transfer (Ollat et al., 2002) which starts descending towards late ripening when full berry weight is reached, at this point a plateau is reached and any observed volume decrease in berries is due to dehydration. In some cases, excess phloem water can be recycled back to the shoots by xylem and Derlot et al., (2001) stated that a switch from xylem to phloem loading occurs in order to prevent this situation of solute and water backflow from fruit to plant.
1.6.
Asynchrony on berry ripening onset
Grape berries ripening is genetically controlled by a number of genes with distinct functions. The most important factors affecting berry ripening are temperature and hormonal balance (Gouthou
case a cluster can have berries with different levels of maturity such as green hard, green soft and soft coloured berries with variable sugar levels which can be up to 10 days apart from each other. Despite the difference of maturity levels at early stages as maturation proceeds they become less profound and berries sugar concentration tends to equilibrate (Gouthou et al., 2014). The importance of this feature is linked to the experimentation regarding grape development where samples deriving from different stages create a bias as lagging berries follow the same transcriptional program but achieve full ripeness at a shorter time period by enhancing physiological ripening (Gouthou et al., 2014). However, this interpretation is certainly wrong as it is perfectly normal that sugar concentration increases more slowly as the berry volume increases if sugar is loaded at constant rate. In other words, by using changes in concentration we cannot explain the “rate” of berry ripening. Those factors define the type of sampling in order to correctly sample berries with similar levels of maturity.
1.7.
Genetic pool of grapevine and use of microvine in experiments
It is estimated that 10.000 grape cultivars are being cultivated today worldwide but DNA fingerprinting sets the number to about 5000 due to the fact that many of them are the same (This et al., 2006). Existing genetic variability resulted from a long period before and after grapevine domestication and various mechanisms such as mutations, sexual propagation (deliberate breeding or natural crossings), and somatic mutations (This et al., 2006). Although a high level of genetic variability exists for V. vinifera only a small percentage is being used today which can potentially limit adaptation of plants in future climate change. Data obtained from French nurseries indicate that 30 genotypes represent 85% of the total production and 10 genotypes accounted for over 65% of planting material in France (www.franceagrimer.fr). Besides France, new world wine producing countries such as the USA, Australia and New Zealand are also using even fewer varieties (Wolkovich et al., 2018) with limited genetic variation. In spite of that fact, Wolkovich et al., (2018) claimed that V.vinifera already possess enough genetic diversity to mitigate climate change effects whereas other researchers (Ollat et al., 2015) claim that even late ripening grape varieties from Southern regions (e.g. Xinomavro from Greece, Carignan from Spain) are not able to expand ripening the period in the Bordeaux region and in some cases they ripe even earlier as compared to the variety Petit Verdot that is being used. Despite these limitations, germplasm of Vitis genus can be used in order to create novel plant & genotypes better adapted to changing climatic conditions possessing desirable characteristics in terms of sugar accumulation, organic acids content and secondary metabolites.
High heterozygosity in Vitis provides genotypes adapted to various extreme conditions, providing the possibility to create new varieties adapted to future climatic conditions such as elevated temperatures (Myles, 2010). An experiment performed by Luo et al., (2011) demonstrated that V.
amurensis photosynthetic rate was not affected by heat stress up to T°<40 °C which could potentially
provide an important trait for adaption. Moreover Xu et al., (2014) showed that wild species and hybrids between V. labrusca and V. vinifera presented strong heat tolerance as compared to V.
vinifera. Other trials were able to detect regulatory mechanisms for primary and secondary
metabolites of berries (Deluc et al., 2008 ; Boss and Davies, 2009 ; Lecourieux et al., 2014). Additionally, experiments were performed to identify transcriptomic changes in berries (Pillet et al., 2012) or whole plants (Carbonell-Bejerano et al., 2013 ; Rienth et al., 2014 ; Rienth et al., 2016) which were exposed to stress.
Apart from experimentation that is been performed in order to decipher mechanisms of stress several practices are already being applied in order to mitigate effects of climate change in both viticulture and enology field (Costa et al., 2016). Strategies such as irrigation and canopy management (Greer et al., 2010) are widely used in practice and regarding wine processing, acidification and electrodialysis have also been adopted (Hannah et al., 2013 ; Van Leeuwen et al., 2013 ; Ollat et al., 2011). Additional drastic solutions such as changing of growing regions to higher altitude or latitude have been proposed as the use of agronomic and enological practices provides a short-term solution with limited efficiency usually. It is also of great importance that the proposed shifting to cooler climate regions can have considerable socio-economic impact on current vine growing regions. Considering all of those limitations-problems the creation of new cultivars better adapted to climate change appears as the only solution for a long-term sustainable viticulture in order to maintain quality and productivity of vineyards as a response to climate change. In order to achieve that, a deeper understanding of genetics must take place firstly by identifying genes related to specific characteristics (QTL for acids, sugars and cations accumulation, drought tolerance etc.) followed by breeding of new genotypes with specific desirable characteristics.
1.8.
Microvine as an experimental tool
The main constrains of today’s grapevine breeding are the long juvenile stage of the species, big experimental plots and the high cost of management (Luchaire et al., 2017). To cope with those problems Microvine is being proposed as an innovative plant which allows fast and economical experimentation as it is a naturally gibberellic acid insensitive mutant of Pinot Meunier obtained by somatic regeneration of L1 cell layer (Chaïb et al., 2010). The microvine presents a dwarf size phenotype with an early and continuous flowering during the growing period (Fig. 5). Those characteristics allow us to perform experiments in a shorter time period as compared to standard field or greenhouse experiments with normal grapevines. Moreover, it is adaptable to greenhouse development allowing vines growth under controlled environment which minimizes experimental biases (temperature fluctuation, lower disease rates, humidity control). Experiments already performed refer to identification of quantitative trait loci (QTLS) in regards to berry molecular responses to abiotic factors, berry acidity and weight.
II.
Working hypothesis
Initial hypothesis for calculation of complex parameters such as titratable acidity from simple data (main anions and cations) was tested on data obtained from an experiment performed in Pech Rouge, France from early July to end of September 2014 in an open field. Data of interest (berry weight, organic acids, potassium) from three different genotypes (Merlot, G7, G14) were used to calculate titratable acidity which was then compared to measured titratable acidity obtained from the same population. This work was done in order to establish the initial hypothesis whether this could be used in another population of plants deriving from a crossing of V3xG14 where the quantity of fruit per sample is limited for phenotyping the population by creating problems for the calculation of complex variables such as titratable acidity.
The second experiment (performed in March – October 2017) consisted of 76 genotypes with two repetitions each and the purpose was to explore the diversity of primary metabolites and cations that exist in a progeny of microvine deriving from a cross. The progeny was obtained in 2015 by crossing the V3 microvine which is a female plant with a reduced stature and G14 (macrovine) that possess the VDQA (Vins de qualité à teneur réduite en alcool) trait which result in wines with reduced alcohol contents. The validation of the initial hypothesis can be useful in experiments with limited number of berries or even single berry analysis and it can help obtain main berry characteristics such as titratable acidity with minimal data usage (sugars, acids, potassium).
Figure 5. Comparison between stages duration for normal grapevine and microvine:
A-B: from seed to seedling; B-C: from seedling to flowering; C-D: flowering to berry ripening; D-A: dormancy break (Chatbanyong and Torregrosa., 2015).
III.
Material and methods
3.1.
Plant material and growing conditions
Two independent experiments were carried out. The first set of genotypes (Experiment 1) consisted of Merlot, G7 and G14 and was located in Gruissan, France in a semi-arid Mediterranean climate (43.14’ N latitude, 3.14’’ W longitude, elevation 6m above sea level) and grape berries were sampled from outdoor vines that were drip irrigated to keep leaf predawn water potential (ΨPD) higher than 0.5 MPa. In Experiment 2 a set of genotypes (76 genotypes with two repetitions each) from V3xG14 crossing were grown in a glasshouse, Montpellier-SupAgro-INRA campus where temperature was controlled. The progeny of the plants derived from V3 (a female microvine plant with reduced stature) and G14 which is a genotype created by interspecific crossing between V. vinifera and Muscadinia
rotundifolia followed by multiple “pseudo” back-crossing with V.vinifera varieties (Ojeda et al., 2017).
G14 possesses the VDQA trait, which is synonymous to elaboration of wines with reduced alcohol
content. The Microvine plants were planted in 3L pots filled with damp, blend of weakly decomposed white sphagnum peat and high grade frozen black sphagnum peat (Huminsubstrat N3, Neuhaus). Additionally, a fertilizer of controlled release was used (Osmocote Exact). Irrigation was set to 500mL/ plant at daily basis and weed management was performed with soil coverage using a special tissue from recycled material which also helps retain moisture. Air temperature was controlled at
25ºC (06:00 to 21:00h) and 16 ºC (21:00 to 06:00h) photoperiod was controlled with the aid of a
probe from 06:00 to 21:00, in the case of limited illumination lamps were activated. Shading curtains were also installed at the roof of the glasshouse being able to open and close during berry sampling. Pest and disease management was performed using:
• Amblyseius andersoni (predatory mite) included into paper sachets (Biobest ®) with minimum 250 mites / sachet in order to control spider mites (Tetranychus urticae, Eutetranychus
ori-entalis)
• Powdery mildew (Uncinula necator) was controlled by a lamp that diffused sulphur in vapour form during 4-5h every day. Downy mildew (Plasmopara viticola) was not treated as it is not considered a thread according to previous experience.
3.2.
Sampling methods
Sampling for Experiment 1 was performed during the harvest of 2014. Samples were taken on a weekly basis monitoring berry development from 1-2 weeks before berry softening up to berry over-ripening stage where berry shrivelling occurs. For each sampling date 600 berries were randomly sampled from the entire field for each genotype and date. Immediately after sampling, (i.e. less than 1 hour) berry density sorting was performed as previously described in literature (Nelson et al. 1963) ; Singleton et al. (1966) with slight modifications, i.e. using NaCl instead of sucrose (Carbonell-Beje-rano et al., 2013). Different solutions of NaCl diluted in water were prepared from 80 g to 190 g
depending on their berry sugar concentration (density) for each sampling date. For Experiment 2 berry sampling was performed at two stages: Hard stage, just before berry softening (expected max-imum organic acids content) and ripe stage where berry reaches maxmax-imum volume and phloem unloading stops. Due to difficulties for precise identification of those two stages within a cluster (asynchrony in the onset of berry ripening) the sampling method was adjusted in order to avoid early or delayed sampling for both stages. Hard stage was identified once one berry (at least) was turning soft while hard berries still remained on the cluster. Berries that were not soft 2-3 days after initial green berry sampling were removed from the cluster in order to avoid berries with delayed ripening onset so that a homogenized sampling was performed as much as possible. Sampling for ripe stage was performed on the same cluster 28 days after initial hard stage (Shahood et al., 2017). For green stage a maximum of 8 berries was sampled and no more than eight berries were kept on cluster after veraison. Figure 6 shows why excluding delayed berries from sampling is crucial in order to obtain accurate results. Samples taken for each plant were 8 in total, 4 different clusters for green and their corresponding ripe berries. In case of a lost sample due to cluster death a supplementary one was collected.
Figure 6. Effect of asynchrony on mean value of berry weight, and sugar for multiple berries. By calculating average composition (dashed line in A and B) from four unsynchronized berries an erroneous conclusion is obtained concerning berry fresh weight and sugar quantity per berry, same principle applies for organic acids too (Shahood et al., 2017). Berries with delayed onset of ripening, should not be sampled because at the moment of sampling their developmental stage corresponds to an ‘early’ ripe stage.
Time (D) 0 10 20 30 40 B er ry w ei gh t ( g) 0.5 0.6 0.7 0.8 0.9 1.0 Time (D) 0 10 20 30 40 S ug ar ( m ol Id .b er ry -1) 0.0 0.2 0.4 0.6 0.8 1.0 Time (D) 0 10 20 30 40 N et im po rt ed s ol ut io n ( M S uc ro se ) 0 1 2 3 A B C
3.3.
Titratable acidity and organic acids analysis
For experiment 1 each density batch was analysed separately except when number of berries per class was lower than 10 so that they were pooled with the nearest class of density. Just after berry sorting, berries were crushed with a domestic crusher for 15sec at room temperature. Total acidity was obtained by a fresh sample that was centrifuged followed by a titration to pH 7 of 20 mL supernatant with 5 mol/L NaOH using a TitroMatic KF 2S 2B (Crison, www.crisoninstruments.com). Total acidity was expressed as meq (H2SO4/L). Another sample of the same juice (stored in fridge
after crushing) was used to quantify primary metabolites, mainly organic acids. Samples were thawed in a 60 °C water bath for 30min, followed by vigorous shake with an orbital shaker for 15sec followed by a centrifugation. Supernatants were diluted ten fold with 0,2 N HCl and filtered on cellulose acetate 0.2 μm membranes, before injection on HPLC (Biorad aminex-HPX87H column). Analysis of berries from experiment 2 was performed in a 3-step process where samples from hard and ripe stage were prepared for HPLC analysis. Firstly, the total berry weight was measured followed by a dilution (5x of the net berry weight) with a solution of HCl 0.25 N and the final volume was measured again. Afterwards, seeds were removed and the final solution was kept at ambient temperature overnight, in order to extract the acids and other molecules from the berry in the solution. Following, another dilution took place where 100 μL of the solution from the previous step were transferred to an Eppendorf tube and diluted with 1000 μL of 12.5 mN H2SO4 solution, including 600
µM acetic acid as internal standard. HPLC preparation included centrifugation of the sample in Eppendorf ™ tube for 5min at 14000 rpm where 800 μL of the supernatant were transferred into an HPLC vial. Organic acids (tartaric and malic) were analyzed using an HPLC following separation on an Aminex HPX87H column (Bio-Rad, Marnes-la-Coquette, France) with a 0.5 ml/min elution with 12.5 mN H2SO4 at 60 °C. Detection was achieved with a Waters 2487 dual absorbance detector
(Waters Corporation, Milford, MA, USA) and a Kontron 475 RI detector (Kontron Instruments, Rossdorf, Germany). Hexoses and organic acids were then calculated according to Reint et al., (2014)
Statistics and data analysis
Data were statistically analysed using R-software version 3.4.3, ANOVA test was performed after homoscedasticity pre-tests evaluation, additionally it was used to obtain mean genotype values for experiment 2 and to create charts. Excel was used to create table, plots, collect and classify data from the two experiments and after they were analysed separately to investigate our initial hypotheses. Data from experiment 1 were mainly analysed as batches of berries and mean values were obtained with “weighted arithmetic mean”. Dara from experiment 2 were obtained from a mean value of all clusters and plant repetitions for every genotype.
IV.
Results and discussion
4.1
Description of fruit development for Merlot, G7 and G14
In order to investigate our hypotheses, data from the three genotypes (Experiment 1) were analysed for main berry characteristics: 1) Average berry weight 2) Glucose + Fructose 3) Malic acid 4) Tartaric acid 5) Potassium. Data analysis was also applied in order to investigate the normality of berry growth for all genotypes. For each sampling date (SD) calculation of average value was performed by using “weighted arithmetic mean” providing an average value where batches with more berries contributed more on final mean value. Sampling dates for each genotype are shown in Table 1 and detailed data of weighted standard deviation for each sampling date are shown on table 2.
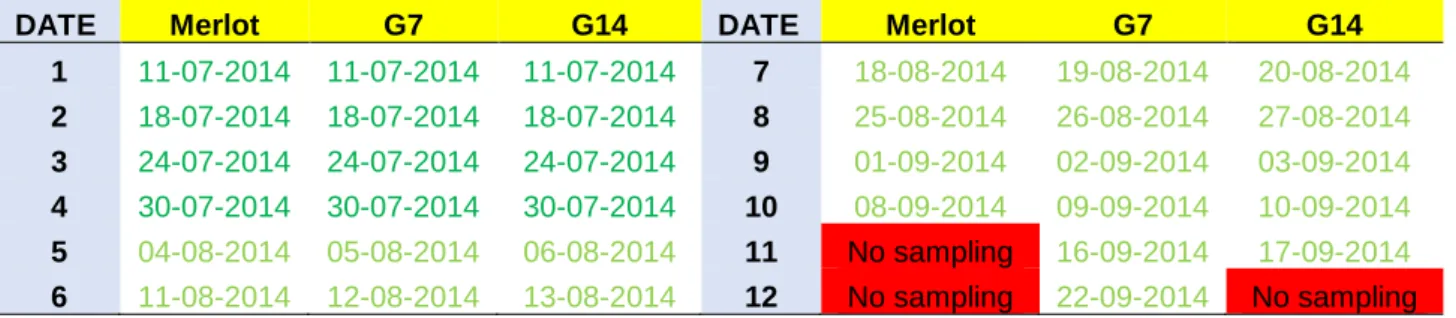
Table 1. Sampling dates for Merlot, G7 and G14. Sampling for G14 Merlot were not performed on
Date 11 and Date 11,12 respectively and that was due to very overripe berries at this point. (n=600 per sampling date/genotype)
DATE Merlot G7 G14 DATE Merlot G7 G14
1 11-07-2014 11-07-2014 11-07-2014 7 18-08-2014 19-08-2014 20-08-2014 2 18-07-2014 18-07-2014 18-07-2014 8 25-08-2014 26-08-2014 27-08-2014 3 24-07-2014 24-07-2014 24-07-2014 9 01-09-2014 02-09-2014 03-09-2014 4 30-07-2014 30-07-2014 30-07-2014 10 08-09-2014 09-09-2014 10-09-2014 5 04-08-2014 05-08-2014 06-08-2014 11 No sampling 16-09-2014 17-09-2014 6 11-08-2014 12-08-2014 13-08-2014 12 No sampling 22-09-2014 No sampling Table 2. Weighted standard deviation for each sampling date of Merlot, G7 and G14. Green cells
indicate hypothesized veraison stage and light blue indicate full berry volume stage. Red cells= data not available. Letters in yellow cells: W=weight (grams); GF=glucose + fructose(mmol/l); TA= tartaric
acid(meq); MA= malic acid (meq); K+= potassium(meq).
4.1.1
Average weight
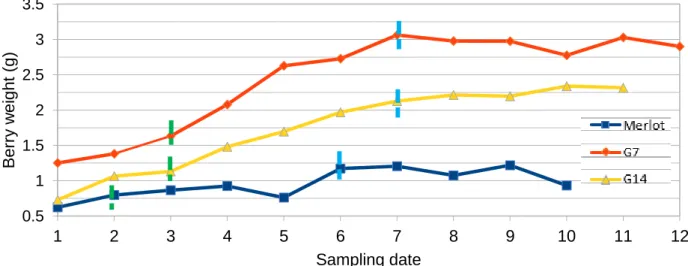
In Figure 7 we can see the evolution of berry weight along sampling dates for the different genotypes Merlot, G7 and G14 from green to over-ripe stage. We used tartaric acid concentration to identify the “theoretical” stages of veraison and maximum berry size (Fig. 9). At the stage just before veraison maximum concentration of tartaric acid reaches a value (part of berries began softening during this stage) and the lowest value is observed at maximum berry weight because tartaric acid quantity is
stable throughout berry ripening and any concentration change occurs from dilution (Hale, 1977). As
DATE Merlot_W G7_W G14_W Merlot_GF G7_GF G14_GF Merlot_TA G7_TA G14_TA Merlot_MA G7_MA G14_MA Merlot_K+ G7_K+ G14_K+
1 N/A N/A N/A N/A N/A N/A N/A N/A N/A N/A N/A N/A N/A N/A N/A
2 0.09 N/A N/A 291.8 N/A N/A 11.3 N/A N/A 87.2 N/A N/A 10.6 N/A N/A
3 0.09 0.32 0.13 279.4 143.4 179.7 12.3 6.2 15.4 99.5 95.3 59.3 16.8 5.2 5.868922 4 0.05 0.17 0.25 N/A N/A 206.7 0 0 19.2 0 0 78.8 0 0 7.741669 5 0.13 0.26 0.15 110.1 131.3 194.0 4 5.5 9.6 22.7 18.1 37.6 7.6 4.5 5.191931 6 0.10 0.23 0.11 153.09 141.7 163.3 12.3 6.7 5 10.7 12.4 12.4 11.2 3.7 4.532578 7 0.11 0.43 0.11 17.0 125.5 252.4 4.9 1.5 11.0 11.2 3.8 26.1 8 3.1 7.451807 8 0.08 0.28 0.18 4.5 129.3 138.6 2.1 8.7 2.0 3.3 19.6 3.6 6.5 6.6 7.516593 9 0.11 0.34 0.12 9.0 166.5 200.5 3.8 9.2 9.8 5.6 7.9 4.5 6.2 5.3 9.371602 10 0.07 0.24 0.18 N/A 218.7 97.0 0 9.7 3.3 0 9 4.4 1.3 13.1 9.532622
11 N/A 0.38 0.17 N/A 13.9 100.6 N/A 6.4 3.5 N/A 7.4 28.2 N/A 14.9 7.94199
shown in figure 7 genotypes had significant differences throughout the whole growing period and at maximum berry weight development Merlot had the smallest weight followed by G14 and G7. Moreover, Merlot showed intense pitching during ripening and a possible explanation for this could be the smaller berry size of Merlot making it more susceptible to dehydration as the ratio of exposed surface/ berry volume is higher compared to the other genotypes. Additionally, when compared to literature Merlot does not follow the pattern of most genotypes where size doubles from veraison to maximum berry weight (Houel et al., 2013).On the contrary G7 and G14 doubled size from veraison (sampling date 3) to full ripeness (sampling dates 7 and 8) respectively. In regards to heterogeneity samples of G7 presented significantly higher standard deviation compared to G14 and Merlot at both green and maximum berry volume stage (Table 2).
Figure 7. Evolution of berry weight from green to overripe stage, average value of berries obtained with “Weighted arithmetic mean”. Green dashed lines indicate theoretical veraison stage for each genotype and light blue lines indicate theoretical maximum berry size.
4.1.2.
Glucose + Fructose
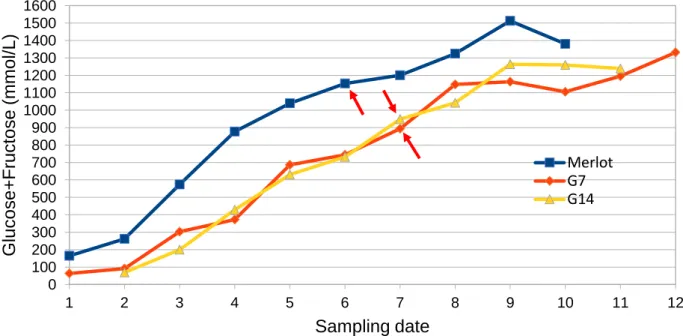
Figure 8 shows the evolution of Glucose + Fructose concentration in the three genotypes. During all stages it was observed that Merlot had higher levels of sugar concentration. Standard deviation levels for Merlot and G7 were higher for the green stage whereas for G14 were higher at ripe stage as shown in Table 2. The high levels of standard deviation for all genotypes at green stage is correlated to mixed berries which are still hard with low sugar levels and berries that soften and accumulate sugar. At ripe stage lower heterogeneity was found for Merlot and G7 as expected whereas G14 presented significantly higher heterogeneity which can be attributed to genetic factors since cultivation for all genotypes was done under the same conditions. Another important observation between genotypes is that at maximum berry volume stage (Merlot SD=6 ; G7=SD7 ; G14= SD7) Merlot presented ~1150 mmol/L whereas G7 and G14 present ~900 and ~950 mmol/L respectively. The difference between the conventional grape variety (Merlot) and G7, G14 that possess VDQA trait confirms previous results for lower levels of sugars (~ 900 - 1000 mmol/L) at full
0.5 1 1.5 2 2.5 3 3.5 1 2 3 4 5 6 7 8 9 10 11 12 B err y w ei g ht (g ) Sampling date
for increased sugar levels due to climate change. This feature can be used to obtain new varieties adapted to climate change.
Figure 8. Evolution of glucose + fructose concentration (mmol/L) from green to overripe berries, red arrows indicate maximum berry volume for Merlot (SD6), G7 (SD7) and G14 (SD7) obtained from “weighted arithmetic mean”.
4.1.3.
Tartaric acid
Evolution of tartaric acid concentration for Merlot, G7 and G14 is shown in Figure 9, berries are distributed from green stage to overripe. Green and red arrows indicate veraison and maximum berry stage respectively, at green stage Merlot presents the highest concentration (SD2 ~ 174 meq) followed by G14 (SD3 ~ 152 meq) and G7 (SD3 ~ 138 meq). Same pattern follows at full berry volume stage, Merlot concentration is 125 meq (SD6) compared to G14 (SD7 ~ 88 meq) and G7 (76 meq). It can be postulated that the observed difference between the genotypes is correlated to berry weight which affects the concentration of tartaric acid as the volume increases and is different for the genotypes that were examined. Moreover, berry size increase from veraison to full berry volume could intensify the difference between genotypes (Merlot=1,2g ; G7=3 g ; G14= 2,1g) because large berries cause higher dilution. Another observation that was made is the curve of concentration where G7 and G14 present quite steady curves whereas for Merlot it increases after SD6, this is due to berry characteristics and the interaction of genotype with environmental conditions which causes more intense dehydration on Merlot berries due to smaller size. Regarding standard deviation it was higher at green stage for G7 and G14 (Table 2), at ripe stage Merlot showed higher deviation which may be due to a sampling error or to the high variability in berry ripening at the specific period.
0 100 200 300 400 500 600 700 800 900 1000 1100 1200 1300 1400 1500 1600 1 2 3 4 5 6 7 8 9 10 11 12
Glu
co
se
+
Fr
u
cto
se
(m
m
o
l/L
)
Sampling date
Merlot G7 G14Figure 9. Evolution of tartaric acid concentration from green to over ripe berries, mean value for
each sampling date was obtained with “weighted arithmetic mean”. Green arrows indicate veraison stage (Merlot= SD2 ; G7=SD3 ; G14=SD3) with maximal tartaric acid levels whereas red arrows indicate maximum berry volume stage (Merlot= SD6 ; G7=SD7 ; G14= SD14) which coincides with the lowest tartaric acid content, any observed increase after this point is caused by berry dehydration.
4.1.4
Malic acid
Figure 10 shows malic acid evolution for Merlot G7 and G14 along sampling dates. During green stage Merlot has lower concentration (SD:2 ~275 meq) as compared to G7 and G14 (SD3 ~ 305 and 314 meq respectively). At ripe stage the same trend was followed and G7 and G14 had similar levels (SD7 ~ 80-85 meq) compared to Merlot (SD6 ~ 62 meq). An important aspect that needs to be considered is that malic acid respiration can be intensified with extreme temperatures (Reinth et al., 2016) which can lead to different concentration values on the same genotype when sampled in vines grown on the open field or in the greenhouse. Additionally, decrease from one stage to another is more intense when compared to tartaric acid caused by both dilution and degradation where the first takes place in the first 10 days after veraison and is less pronounced during the final stages of ripening (Dai et al., 2011) whereas dilution continues up to full berry volume stage.
75 100 125 150 175 200 1 2 3 4 5 6 7 8 9 10 11 12 T ar tar ic acid (m eq ) Sampling date Merlot G7 G14 25 50 75 100 125 150 175 200 225 250 275 300 325 350 375 400 1 2 3 4 5 6 7 8 9 10 11 12
Ma
lic
a
cid
(m
e
q
)
Sampling dates
Merlot G7 G144.1.5.
Potassium
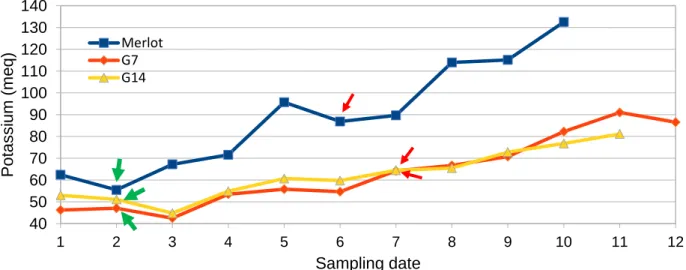
Potassium concentration evolution from early green stage up to over ripeness is shown in Figure 11. At all stages Merlot has the highest concentration along with pitching when compared to G7 and G14 (SD5) that present lower values and a steady increase. Additionally, it was observed that in all cases during veraison initiation (Merlot: SD2, G7 and G14: SD3) potassium levels present a decline before re-start increasing. This can be due to berry volume increase that causes dilution of K+ in pulp
in combination with low rates of K+ accumulation at initial stages of berry ripening. At green stage
Merlot (SD2) present significantly higher value (~55meq) compared to G7 and G14 (SD3) that present similar value (~42-45 meq). At maximum berry volume levels were also similar between G7 and G14 (~65meq at SD7) whereas Merlot presented higher values (~90meq at SD6). This difference can be explained by either genetic differences regarding potassium accumulation and by a difference in the skin/pulp ratio. Merlot had very small berries on average during maximum berry volume (SD6= 1,2 g) as compared to G7 (SD7=3g) and G14 (SD7= 2,2g) which ultimately lead to higher skin/pulp ration that increased final concentration in agreement with the previous results of Iland et al., (1988).
4.2. Use of simple data to calculate complex variables
Different experimental designs require different methods of sampling. In fact, multiple berries can be harvested to perform all the necessary analysis (total acidity, sugars, potassium, pH, anthocyanins etc) yet in other type of experiments few or single berry analysis takes place. Although berry traits such as sugars, acids or potassium can be easily accessed even at single berry level, determination of total acidity can become challenging or even impossible by single berry analysis.
40 50 60 70 80 90 100 110 120 130 140 1 2 3 4 5 6 7 8 9 10 11 12 P otassi um (m eq ) Sampling date Merlot G7 G14
Figure 11.
Evolution of potassium concentration from green to overripe berries. Mean value obtained with “weighted arithmetic mean”. Green arrows indicate hypothesized green stage (Merlot: SD2, G7 and G14: SD3) and red arrows indicate hypothesized maximum berry weight. (Merlot: SD6, G7 and G14: SD7)In the current experiment regression coefficient between measured values versus calculated values was investigated in order to assess whether any correlation can be found. Graphs were used to check correlation between: calculated - measured acidity; pH – measured total acidity; pH – potassium, malic acid correlation. For “Calculated” total acidity the following formula was used:
[Tartaric Acid] + [Malic Acid] – [Potassium] = Calculated total acidity (meq) [1]
i)
Link between calculated – measured total acidity
As shown in Figure12 high positive regression coefficient between measured and calculated total acidity occurs. The three different genotypes are represented and each point is a batch of pooled berries at same density levels from different dates. Range of values was very high (~50 to ~500 meq) as a consequence of sampling from very early to overripe berries. By comparing both parameters high regression coefficient was found in all 3 genotypes (R2 >0.98 in all cases) and any
observed differences between parameters might be influenced from precipitation of tartaric acid with K+ due to higher laboratory temperatures before titration or extensive K+ extraction from seeds which
occurs during berry crashing. Despite errors of samples regression coefficient level is high and this might indicate that in cases where a limited amount of juice is provided (e.g. single berry analysis) a virtual calculation can take place in order to access difference of total acidity between multible genotypes.
Figure 12. Regression coefficient between calculated and measured total acidity, each dot
represents a group of berries at same density level from different dates. Extreme values (>400meq represent early green stages). At all stages from green to overripe high regression coefficient levels are observed.
ii)
pH – Measured total acidity regression coefficient
A non-linear regression curve between pH and measured total acidity was drawn (Fig. 13). It is shown that pH is highly correlated to total acidity in all cases although Merlot presents significantly higher pH values. This can be explained from higher levels of potassium during ripening as shown in Figure 11. By taking into account potassium concentration from Figure14 we can assume that acid
concentration is the main pH contributor at early stages until it reaches values ~ 3,5 for G7 and G14 and 3,7 for Merlot after this point the observed increase of pH is due to potassium accumulation. In general pH increase (mainly during 10 days after veraison) is driven by malic acid respiration (and dilution) along with tartaric acid dilution which continues until full ripening although it is less pronounced. At this point of late ripening pH increase is due to K+ accumulation that combines with
tartaric acid and creates potassium bitartrate crystals (THK).
Figure 13. Regression coefficient between pH and measured total acidity, each dot represents a
group of berries at same density level from different dates.
iii)
pH – potassium, malic acid regression coefficient
In Figure 14 relationship between pH and potassium-malic acid is shown for the three genotypes. As already known and confirmed in this case malic acid and potassium have significant impact on pH. In this case Merlot showed the highest regression coefficient followed by G14 and G7. During early stages until pH reaches a value ~3.5 – 3.6 the major determinant of acidity is malic acid along with tartaric. After this point acidity remains quite steady and observed increase is due to potassium accumulation. In this case it can by hypothesized that higher levels of [K+] are correlated to berry
size as the comparison between genotypes shows a significant difference between Merlot G7 and G14 (Merlot ~ 1,2g ; G7 ~ 3g ; G14 ~ 3g). Those smaller berries experience more intense dehydration leading to berry shriveling and increased concentration that consequently causes a higher pH, this situation occurs mostly at over – ripe stage.
Figure 14. Relationship between pH and potassium-malic acid, each dot represents a group of
berries at same density level from different dates. Merlot: yellow lines; G7: blue lines; G14: green
50 150 250 350 450 40 60 80 100 120 140 2.6 2.8 3.0 3.2 3.4 3.6 3.8 4.0 4.2 4.4 M ali c acid (m eq)
P
otass
iu
m
(meq
)
pHlines. The dashed line represents regression coefficient between weighted malic acid and weighted pH whereas continuous shows weighted potassium and weighted pH regression coefficient.
4.3. Diversity of V3xG14 progeny for all major metabolites
In order to investigate the genetic diversity of the progeny in terms of sugar, acids and potassium accumulation several histograms were built for both green and ripe stage (maximum berry volume) (Figures 15 to 19). Each genotype was represented from 4 clusters and a maximum of 8 berries at each stage. For each genotype minimum, maximum and average values were calculated along with standard deviation for all genotypes.
4.3.1. Glucose + Fructose
The concentration values of Glucose + Fructose from all individual samples are represented on histograms for the green stage (Fig. 15a) and the ripe stages (Fig. 15b) where different bins were created. Extreme high concentration values (>1300 mmol/l) that might occur are mostly due to dehydrated berries that were sampled at full berry volume and in few cases due to genetic reasons. Dehydration that took place is correlated to various reasons such as destruction of the pedicel which can be partially assessed by examining berry weight for each individual sample (one cluster) in respect to average of all values (four clusters). On the contrary, extreme low concentration values can be related to genetic reasons that lead to lower sugar accumulation or it might be related to errors such as very early sampling for green stage. At green stage levels were between 65 to 249 mmol/l with a mean value 108 mmol/l and standard deviation of 23 mmol/l. During full berry volume stage values ranged between 321 to 1442 mmol/l with a mean value of 914 mmol/l and standard deviation of 114 mmol/l. The mean value of population at ripe stage is of great importance and it emphasizes the lower concentration of sugars at full berry growth which creates the potential for further exploitation of the VDQA trait by identifying QTLS for sugar accumulation and for the development of new varieties. Additionally, on Figure 15a,15b an arrow indicates the weighted average values of G14 genotype from Experiment 1 for green and ripe stage showing that it is ranked among the high end compared to the progeny. This observation emphasizes that on average the trait of low sugar accumulation from G14 is less profound due to crossing between genotypes that leads to segregation of the trait after the crossing in this specific case. This characteristic can be also affected by environmental conditions as it is known that genotypes may respond differently when growing in the open field or in the greenhouse. Despite the fact that sugar accumulation is considered a relatively stable trait this observation needs to be taken into consideration in future experiments with microvine progeny.