UNIVERSIDADE TÉCNICA DE LISBOA
Faculdade de Medicina Veterinária
COMPARISON OF LIPID PROFILE AND SOME PHYSICO-CHEMICAL PROPERTIES OF BEEF FROM SPAIN AND NETHERLANDS WITH BEEF FROM
NATIONAL PRODUCTION WITH DIFFERENT GENETIC BACKGROUND (DAIRY AND CROSSBRED BEEF)
FABIO TREVISAN
PRESIDENTE:
Doutor Fernando Manuel d’Almeida Bernardo Doutor Rui José Branquinho de Bessa
Doutor Mário Alexandre Gonçalves Quaresma
ORIENTADOR
Doutor Mário Alexandre Gonçalves Quaresma
2013 LISBOA
UNIVERSIDADE TÉCNICA DE LISBOA
Faculdade de Medicina Veterinária
COMPARISON OF LIPID PROFILE AND SOME PHYSIC-CHEMICAL PROPERTIES OF BEEF FROM SPAIN AND NETHERLANDS WITH BEEF FROM
NATIONAL PRODUCTION WITH DIFFERENT GENETIC BACKGROUND (DAIRY AND CROSSBRED BEEF)
FABIO TREVISAN
MESTRADO EM SEGURANÇA ALIMENTAR
PRESIDENTE:
Doutor Fernando Manuel d’Almeida Bernardo Doutor Rui José Branquinho de Bessa
Doutor Mário Alexandre Gonçalves Quaresma
ORIENTADOR
Doutor Mário Alexandre Gonçalves Quaresma
2013 LISBOA
ii
Agradecimentos
Ao meu orientador Professor Mário Quaresma, pela oportunidade de estudar um tema muito caro a mim, pela dedicação, paciência e imprescindível orientação nesta dissertação de mestrado.
Ao Professor José Pedro Lemos e Doutora Ana Cristina Monteiro pela ajuda na realização das análises referentes à força de corte e coloração.
Ao laboratório de Tecnologia dos Produtos Animais da Faculdade de Medicina Veterinária agradecemos a disponibilização do espaço e do equipamento para a realização das análises de cor, pH e tenrura.
Ao Laboratório de Bioquímica da Faculdade de Medicina Veterinária agradecemos a disponibilização do espaço para a realização das análises bioquímicas, a disponibilização do HPLC e o apoio prestado durante a realização das análises.
Ao Prof. Rui Bessa e à Doutora Susana Alves agradeço a realização das análises dos ácidos gordos, a disponibilização do aparelho de cromatografia gasosa e o apoio prestado na leitura dos cromatogramas.
Ao Coordenador do CIISA, Professor Luís Tavares pelo apoio financeiro que permitiu a realização de todas as análises que possibilitaram a realização deste trabalho.
Ao Departamento de carne de bovino do Grupo Jerónimo Martins, agradeço a oportunidade que me foi dada para realizar o estudo, aos técnicos do Grupo Jerónimo Martins José Fraga, Luís Correia e João Saramago agradeço o apoio prestado na recolha das amostras destinadas ao estudo.
A Irani pelo seu constante apoio, pela sua ajuda imprescindível e confiança incondicional em mim. A minha mãe para ter acreditado mais uma vez em mim.
Aos colegas do mestrado em Segurança Alimentar, pelos momentos de alegria, troca de conhecimentos e pelo bom convívio.
iii
Abstract
Comparison of Lipid Profile and Some Physic-Chemical Properties of Beef from Spain and Netherlands with Beef from National Production with Different Genetic Background (Dairy And Crossbred Beef)
Some physic-chemical properties and lipid profile of beef from two origins (Holland and Spain) were compared with beef from national production of both dairy and crossbred beef backgrounds. In comparison, we can find four different groups: two groups of animals from Spain and Holland; n=10 animals per group) and two groups from national production (dairy and beef production systems; n=10 for animals per origin). Animals used in the study were all males of 8-12 months old. In study we can find two different genetics, the Holstein breed (Holland, Spain and Portugal) and crossbred beef genetics (Portugal).
Beef samples were obtained from sirloin (longissimus lumborum) in all groups. The fatty acid profile was determinated by GC. Total cholesterol, -carotene and tocochromanols were quantified by HPLC.
The results of comparison showed that beef from crossbred beef bulls was leaner and displayed a distinct fatty acid profile with lower SFA, MUFA contents and higher PUFA and n-3 PUFA contents than beef from Holstein bulls. Beef from the crossbred beef bulls was the only group in total agreement with P/S and n6/n3 ratios. Relatively to beef color parameters, Portuguese beef presented the highest L* and lowest a* values and intermediary b* values. Beef from Holstein bulls raised in Portugal was on the limit of DFD while beef from the Spanish Holstein bulls was a well-established DFD.
It is however important to highlight that the study was done with a restrict number of samples, and for this reason it is not possible to conclude that beef from national production has a superior quality than beef from abroad.
iv
Resumo
Comparação do perfil lipídico e algumas características físico-químicas de carne de bovino proveniente da Espanha e Holanda com carne de bovino nacional proveniente de animais com genética diferente (leite e cruzados de carne)
Este estudo procurou comparar o perfil lipídico e algumas propriedades físico-químicas da carne de bovino holandesa e espanhola com carne de bovino da produção nacional proveniente de animais com genética diferente (leite e cruzados de carne).
Em comparação podemos encontrar quatro grupos diferentes. Se tivermos em consideração a genética dos animais, podemos encontrar 2 grupos: 1) animais de genética Holstein (acabados em Portugal, Espanha e Holanda) e 2) cruzados de carne de produção nacional. Se tivermos em consideração a origem, podemos também encontrar 2 grupos: 1) do exterior (Espanha e Holanda) e produção nacional (Holstein e cruzados de carne). O estudo contemplou apenas a utilização de touros do sexo masculino e com uma idade ao abate entre os 8 e os 12 meses de idade (vitelão), tendo-se usado 10 animais por grupo.
As amostras de carne usadas no estudo foram obtidas da vazia (longissimus lumborum). O perfil de ácidos gordos foi analisado por GC, enquanto a quantificação dos teores de colesterol total, -caroteno e tococromanóis foi realizado por HPLC.
Os resultados do estudo revelaram que a carne proveniente de bovinos cruzados de carne era mais magra e apresentava um perfil lipídico com menor teor de SFA e MUFA e um teor superior de PUFA e n-3 PUFA comparativamente com os bovinos de raça Holstein. A carne proveniente de bovinos cruzados de carne foi a única a apresentar os rácios P/S e n6/n3 em total concordância com as recomendações internacionais. Relativamente aos parâmetros de cor estudados, podemos afirmar que a carne produzida em Portugal apresentou valores de L* mais elevados, e os valores de a* mais baixos do que a carne espanhola e holandesa, tendo apresentado valores de b*intermédios aos obtidos na carne do exterior. O pH da carne de touros criados em Portugal estava no limite da carne DFD, enquanto o pH da carne proveniente de Espanha se podia considerar uma carne DFD.
Apesar dos resultados aqui apresentados, é importante realçar que o estudo foi realizado com um número restrito de amostras e que por essa razão não é possível concluir que a carne de bovino produzida em Portugal seja superior à carne de bovino produzida no exterior.
v
Index
DECLARAÇÃO ... i AGRADECIMENTOS... ii ABSTRACT ... iii INDEX ... vINDEX OF FIGURES ... vii
INDEX OF TABLES ... viii
LIST OF ABBREVIATIONS ... ix
1. INTRODUCTION ... 1
2. BIBLIOGRAPHIC REVIEW ... 2
2.1 The role of meat during human evolution ... 2
2.2 World and Europe bovine meat production ... 5
2.3 The role of meat as the main source of protein in human diet ... 9
2.4 The role of meat as animal fat source and health ... 11
2.5 Fatty acids in human nutrition ... 11
2.5.1 Saturated fat and health ... 13
2.5.2 Mono- and polyunsaturated fat and health ... 14
2.5.2.1 Cardiovascular health and disease ... 14
2.5.2.2 Inflammatory diseases... 15
2.5.2.3 Neuronal function and diseases... 16
2.5.2.4 Cancer risk and protection ... 17
2.5.3 Cholesterol and health ... 18
2.6 Importance of pH in meat quality evaluation ... 19
2.7 Meat characteristics in consumer choice ... 20
2.7.1 Color at display ... 21
2.7.2 Vitamin E ... 21
2.7.3 Tenderness, flavor and juiciness at consume ... 22
3. MATERIALS AND METHODS ... 24
3.1 Animals and samples ... 24
3.2 Beef color measurements, pH determination and Warner Bratzler shear force quantification ... 24
3.3 Analytical methods ... 25
vi
3.3.2 Fatty acid analysis ... 25
3.3.3 Cholesterol β-carotene and tocopherols determination ... 26
3.3.4 Statistical analysis ... 26
4. RESULTS AND DISCUSSION ... 27
4.1 Total fatty acid content and fatty acid profile ... 27
4.2 Fatty acid partial sums and nutritional ratios ... 30
4.3 Total cholesterol ... 33
4.4 Lipid soluble antioxidants ... 34
4.5 Beef color, pH and Warner Bratzler shear force ... 35
5. CONCLUSION... 37
vii
Index of figures
Figure 1 - Evolution of cranial capacity in human (copied from Muséum d'Aix-en-Provence 2001). 3 Figure 2 - Fatty acids trend in human diet throughout history (copied from Kazemian et al., 2012). 4 Figure 3 - Global and European 40-years trend for bovine meat production (FAOSTAT)... 5 Figure 4 - 40-years trend for bovine meat production by region (FAOSTAT).. ... 5 Figure 5 - Global bovine meat supply (kg/capita/yr) 1961-2009 period (FAOSTAT) . ... 6 Figure 6 - Europe bovine, pork, poultry meat supply (kg/capita/yr) 1961-2009 period (FAOSTAT).6 Figure 7 - World's regions 40-years trend for bovine meat production (FAOSTAT). ... 7 Figure 8 – Beef producing animals/slaughtered in 2010 in most productive countries (FAOSTAT). 7 Figure 9 - Cattle livestock by country (FAOSTAT). ... 8 Figure 10 - Cattle meat production variation among European country period 1961-2009
(FAOSTAT). ... 9 Figure 11 Protein supply quantity from meat and seafood in Europe (g/capita/day) (FAOSTAT)... 10 Figure 12 - Elongation and desaturation of n-6 and n-3 polyunsaturated fatty acids (Simopolous, 2008). ... 12 Figure 13 - Postmortem pH decline and the resulting meat color, (Miller, 2007). ... 20
viii
Index of tables
Table 1 - Recommended daily intake for protein depending on age and physiologic state (DGAC, 2010). ... 9 Table 2 - Total fatty acid content (mg/g muscle), fatty acid profile (g/100 g of beef) from young bulls from Spain and Netherlands and national production (dairy and beef). ... 28 Table 3 - Total cholesterol content (mg/100 g of muscle), partial sums of fatty acids (% w/w) and nutritional ratios of intramuscular fat in the longissimus lumborum muscle of young bull meat from Spain and Netherlands and national production from dairy and beef farms. ... 33 Table 4 - Major lipid soluble (a-tocopherol,g-tocopherol andb-carotene) in beef from in the longissimus lumborum muscle of young bull meat from Spain and Netherlands and national production from dairy and beef farms... 35 Table 5 - Beef color parameters (L*, a*, b*, h* and C*), Warner Bratzler shear force (WBSF) and pH in beef from in thelongissimus lumborum muscle of young bull meat from Spain and Netherlands and national production from dairy and beef farms... 35
ix
List of abbreviations
AA: arachidonic acid AD: Alzheimer’s disease
ADHD: attention-deficit hyperactivity disorder AHA: American Heart Association
ALA: alpha-linolenic acid
BSE: bovine spongiform encephalopathy CH3: methyl
CO2: carbon dioxide
CVD: cardiovascular diseases DFD: dark, firm and dry
DGAC: Dietary Guidelines Advisory Committee DHA: docosahexaenoic acid
EFA: essential fatty acids EPA: eicosapentaenoic acid
FAO: Food and Agriculture Organization HDL: high-density lipoproteins
LA: linoleic acid
LCPUFA: long chain polyunsaturated fatty acids LDL: low-density lipoproteins
MUFA: monounsaturated fatty acids O2: oxygen
PUFA: polyunsaturated fatty acids RA: rheumatoid arthritis
SFA: saturated fatty acids TFA: trans-fatty acids
VLDL: very low-density lipoprotein WHC: water-holding capacity
1
1. Introduction
Beef is a major ingredient in western diets, being the major source of protein to these populations. Meat is the major source of protein and an important source for some micronutrients such as vitamins A, B6, B12, D and E, iron, zinc and selenium, which are not present or have poor bioavailability in vegetal foods. Humans should eat between 0.8 to 1.3 g of protein per kg body weight per day, according with their development or physiological stage. In 85 g of lean beef, which is the recommended serving size, there are about 25 g of protein according with the Dietary Guidelines Advisory Committee (DGAC), which is nearly half of the required daily protein intake (56 g of protein intake daily). Still, humans tend to consume above the needs, contributing to a diet misbalance which is associated with health risks.
Meat also provides fat, particularly saturated fats and cholesterol, which can be harmful to human health. Therefore excessive consumption of meat is associated with increased intake of saturated fat and cholesterol, which are associated with health deleterious effects, particularly with cardiovascular health. In view of its implications in meat quality and human health, the intramuscular lipid composition of beef aroused considerable interest.
Beef production in Portugal is not enough to ensure domestic consumption, representing only 52% of total consumption. For this reason Portugal is forced to import beef. The importation of beef in Portugal features 3 levels: 1) import top quality cuts (chuck round, rump, sirloin and tenderloin) mainly from South America; 2) vacuum packed refrigerated cuts of whole carcasses and 3) refrigerated carcasses exclusively from Europe (Spain 53%, Netherlands 16%).
Such beef importation from different countries, is associated with quality variability, due to different genetics, production systems, feeding management, age at slaughter, slaughter procedures, among other differences, which makes beef quality quite variable. The aim of the study was to evaluate the beef quality obtained from dairy herds of Portugal, Spain and Netherlands, and also compare Portuguese beef quality from dairy and beef breeds.
2
2. Bibliographic review
2.1
The role of meat during human evolution
Meat is an important source of high quality protein (in some countries the main source), and some essential micronutrients such as vitamins A, B6, B12, D and E, iron, zinc and selenium, contributing to consumers’ health throughout life (Williamson et al., 2005; Scollan et al., 2006). These micronutrients are either not present in plant derived food or have a poor bioavailability in vegetable foods (Biesalski, 2005; Luciano, 2009).
It has been estimated that meat consumption by primitive humans began to rise about 2.5 million years ago, since there is no earlier available archaeological data, but it could have a longer history extending up to 6 to 8 million years ago, as suggests the meat-eating behavior of chimpanzees, which share with us a common ancestor (Larsen, 2003). From an anatomical perspective, modern human beings have not changed compared with their Paleolithic ancestors (Zucoloto, 2011). Before the Agricultural Revolution or Neolithical Revolution (10000 BC), our ancestors lived by hunting and gathering on the African continent and afterwards in other parts of the world, eating animals and plants (Eaton, Eaton, & Cordain, 2002; Larsen, 2003; Richards, 2002; Simopoulos, 2008; Ungar & Teaford, 2002; Zucoloto, 2011).
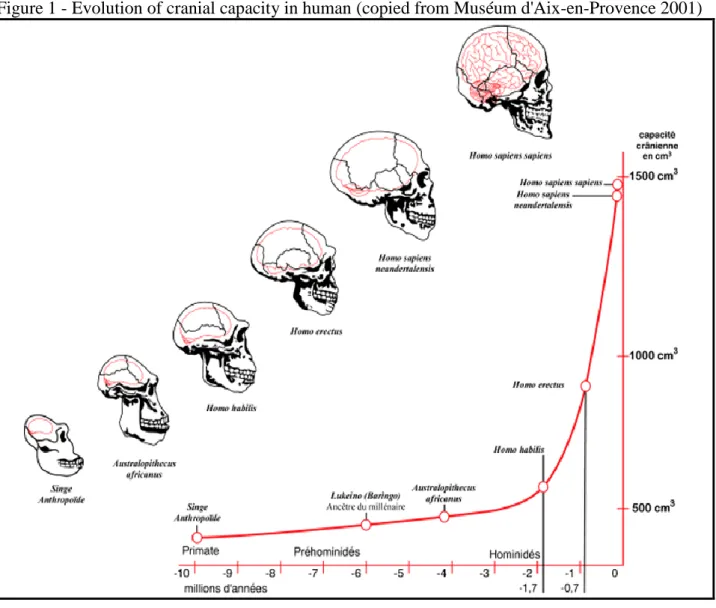
During the pre-Neolithic period, the consumption of meat, was dependent of hunting or scavenging wild game meat. The consumption of meat seems to have accompanied the increase of stature and brain matter and, in general, the whole transition from Australopithecus to Homo Erectus via Homo Abilis (Richards, 2002; Ungar & Teaford, 2002). Just to figure, the brain size of Homo Sapiens is thrice that of Australopithecus (Ungar & Teaford, 2002).
There is evidence of human control, or domestication, of wild plants and animals in all continents at the start of the Holocene, about 12000 years ago (Richards, 2002). With the advent of agriculture, novel foods were introduced, varying in accordance with world region and climate, such as rice, or corn for which the human genome had little evolutionary experience (Cordain et al., 2005). Adopting this new food in human nutrition has conducted to a general decline in teeth health and stature, as testified by skeletal evidence, together with the rise of new health disorders (Richards, 2002). In the Western World, the human diet has undergone another major shift the last 100-150 years, due to the so-called Industrial Revolution (Cordain, et al., 2005; Simopoulos, 2006). The industrialization of agriculture practices and the consequent industrialization and mechanization of the oil-seed industry and the large-scale addition of refined vegetable oils to the world’s food supply after the Industrial Revolution, significantly altered both quantitative and qualitative aspects of fat intake (Cordain, et al., 2005).
3
Figure 1 - Evolution of cranial capacity in human (copied from Muséum d'Aix-en-Provence 2001)
An example of such change was the hydrogenation process in food industry which has produced, and introduced in human diet, novel trans fatty acid isomers (Cordain, et al., 2005). For many centuries, human diet was high in fruits, vegetables, nuts, and berries, industrialization brought in refined grains and sugars (Cordain, et al., 2005; Larsen, 2003; O'Keefe & Cordain, 2004; Simopoulos, 2006). This new diet rich in highly processed and high-glycemic-load foods is at odds with whole, natural, fresh foods early humans used to consumed (Cordain, et al., 2005; O'Keefe & Cordain, 2004). During this period of major social and economic changes, n-3 fatty acids intake saw a reduction, whereas trans-fats boomed along with fried foods, hard margarine, commercial baked goods, and most packaged and processed snack foods (Cordain, et al., 2005; Larsen, 2003; O'Keefe & Cordain, 2004; Simopoulos, 2006).
Early humans consumed diets containing approximately equal amounts of n-3 and n-6, as well as much lower levels of saturated and trans fatty acids compared with current dietary patterns (Kazemian, Kazemi-Bajestani, Alherbish, Steed, & Oudit, 2012; O'Keefe & Cordain, 2004;
4
Simopoulos, 2006). In the Paleolithic world, n-3 fats were abundant coming from a broad base of the food chain composed of ubiquitous algae in the sea and of grasses and leaves on land (Broadhurst et al., 2002; O'Keefe & Cordain, 2004). The small amount of fat in algae, grasses, and leaves is rich in n-3 fatty acids, which become more concentrated in larger animals through both the terrestrial and marine food chains, especially in fish and larger grazing animals (O'Keefe & Cordain, 2004). Hence, early humans diets contained approximately equal amounts of n-3 and n-6, as well as much lower levels of saturated and trans fatty acids compared with current dietary patterns (Kazemian, et al., 2012; A. P. Simopoulos, 2002). Meat from domesticated animals is low in n-3 fatty acids because these animals are generally grain-fed rather than grass-fed, and grains are rich in n-6 fatty acids (Cordain, et al., 2005; O'Keefe & Cordain, 2004; A. P. Simopoulos, 2002; Simopoulos, 2008). Cereal grains are high in carbohydrates and n-6 fatty acids, but low in n-3 fatty acids and antioxidants (A. P. Simopoulos, 2002). As a result, nowadays, the intake of n-3 fats is much lower compared with our remote ancestors. (O'Keefe & Cordain, 2004; A. P. Simopoulos, 2002).
5
2.2
World and Europe bovine meat production
According to FAO database, on the last 48 years, world bovine meat production has more than doubled, passing from 280 million tons to 640 million tons (Figure 3). In 1961, Europe produced approximately 100 million tons of bovine meat, which was about one third of the whole world production. In Europe, bovine meat production kept growing until the 90's of last century and then declined until the turn of millennium, cutting the production to about one half, passing from almost 200 million tons to 110 million tons (Figure 3). Nowadays, Europe produces about one sixth of the world bovine meat.
Figure 3 - Global and European 50-years trend for bovine meat production (FAOSTAT).
6
During the last forty years, bovine production change extremely. Asia (400%) and Africa (204%) had the steepest production growth during this period, followed by South America (176%) (Figure 4). When considering the consumption, in the last forty years Asia consumption has increased 162,5%, South America increased by 15%, Europe increased by 3,8%, whereas consumption in Oceania decreased by 13,9%, North America decreased by 4,6% and in Africa decreased by 5,9% (Figure 5).
Figure 5 - Global bovine meat supply (kg/capita/yr) 1961-2009 period (FAOSTAT).
In Europe in the last 20 years, bovine meat has been partly substituted by poultry and pork meat. Poultry consumption has increased more than four times while pork meat has increased about 75% (Figure 6).
7
Figure 7 - World's regions 50-years trend for bovine meat production (FAOSTAT).
Western countries of all regions, Europe, North America and Oceania, have seen a major fall in bovine meat consumption, but Europe is the only continent to have an accentuated 25 years negative trend in both production (-49%) and consumption (-36%), since production in North America in the last 25 years saw a stable fluctuation.
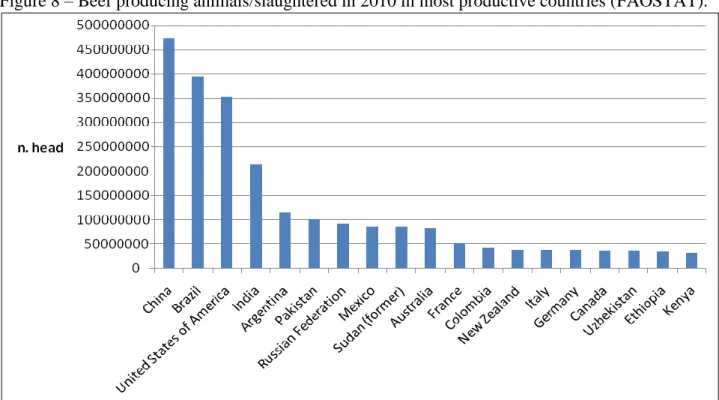
In 2010, the five most productive countries were China, Brazil, United States of America, India and Argentina. The most productive European countries were France (11°), Italy (14°) and Germany (15°) (Figure 8).
Figure 8 – Beef producing animals/slaughtered in 2010 in most productive countries (FAOSTAT).
8
In 2010, India, Brazil, United States of America, China and Ethiopia possessed the five biggest world bovine livestock (Figure 9). Together India and Brazil hold more than 400 million heads (Figure 8). The first European country by livestock is France, fourteenth world biggest livestock (Figure 8).
Portugal produces 52% of the national beef consumption, therefore needs to buy from other countries, with Spain representing the first importing market covering 53% of the deficit and Netherlands, which represents the 16% of the imports (Observatório dos Mercados Agrícolas e das Importações Agro-Alimentares, 2010). Beef production in Portugal more than doubled since 1961, passing from 46.000 tons to 96.000, while consumption tripled 6,20 kg/capita/year to 18,20 kg/capita/year (FAOSTAT).
Figure 9 - Cattle livestock by country (FAOSTAT).
Globally Europe has suffered an accentuated decline in bovine meat production, but there were some exceptions among European countries, which were associated with some increase in bovine production as Spain (89% increase), Ireland (168% increase), Netherlands (54% increase) and Albania (> 300% increase), (Figure 10).
9
Figure 10 - Cattle meat production variation (%) among European country in the 1961-2009 period (FAOSTAT).
2.3
The role of meat as the main source of protein in human diet
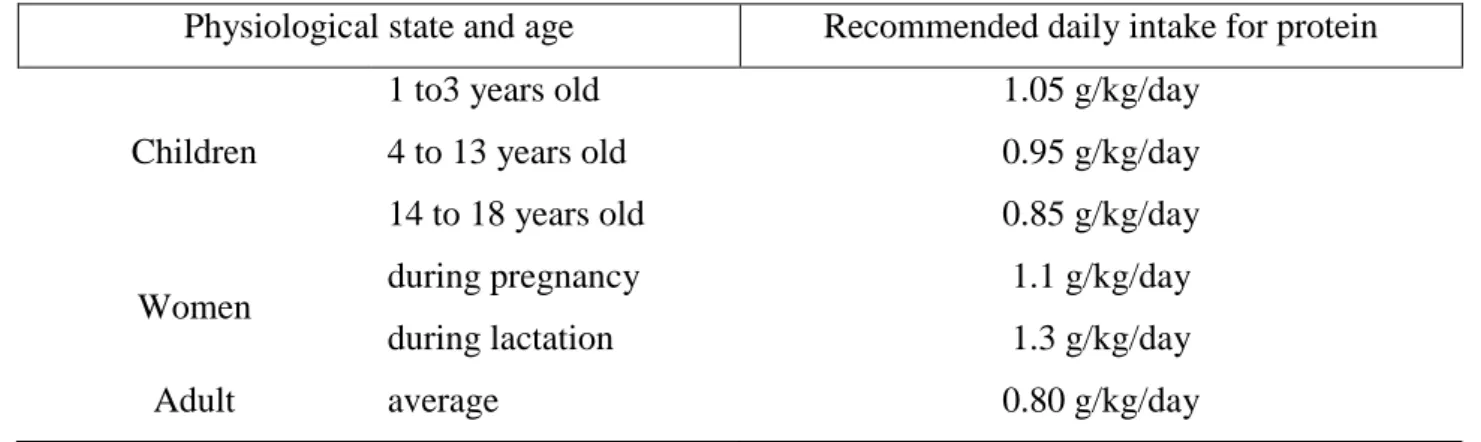
Red meat is an important dietary source of protein and its contribution to global health has been long established (McAfee et al., 2010). When compared to other sources of protein, such as beans or whole wheat, red meat protein has a higher digestibility (94%), and provides all essential amino acids (Williams, 2007). Meat, as a protein rich product, helps to reduce glycemic index thanks to its low carbohydrate content, which is considered beneficial with respect to overweight, the development of diabetes and cancer (Biesalski, 2005). The recommended protein daily intake is quite variable depending on age and physiologic state, as it is observable in Table 1 (DGAC, 2010b).
Table 1 - Recommended daily intake for protein depending on age and physiologic state (DGAC, 2010b)
Physiological state and age Recommended daily intake for protein
Children
1 to3 years old 1.05 g/kg/day
4 to 13 years old 0.95 g/kg/day
14 to 18 years old 0.85 g/kg/day
Women during pregnancy 1.1 g/kg/day
during lactation 1.3 g/kg/day
10
In developing countries, stunting is assumed to be related to improper animal protein intake in the diet (McNeill & Van Elswyk, 2012).
According to dietary recommendation, 0.8 g of protein per kg body weight per day , an 70 kg adult would require 56 grams of high quality protein daily. The recommended serving size (85 g) of lean meat or poultry contains about 25 grams of protein, while 1 cup of milk or yogurt contains 8 grams of protein. Cereals, grains, nuts, and vegetables contain about 2 grams of protein per serving (DGAC, 2010b). It has been argued that the decrease in stature during the agricultural transition in the Neolithic, was due to the reduced protein intake from animal food, which is considerably inferior to the Paleolithic levels (Ungar & Teaford, 2002). Similarly, a change in stature was observed in different stages of the Industrial Revolution, when prices of goods rose, booming urbanization cut off rural areas and a general impoverishment took place in vast number of people (Komlos, 1998). It is also curious to observe how slaves’ stature did not decreased, as middle- and upper-class’, while low-class’ did (Komlos, 1998). The author supports the hypothesis that masters took care of their slaves because they were aware of how a well-nourished worker would contribute to production, whereas low-income families quite exclude the expensive meat from their meal except from special occurrences (Komlos, 1998).
Among animal protein sources, bovine meat has been in the past the major source of protein in human diet, but nowadays, pork, poultry meat and sea food are greater sources of protein to human diet, as it is demonstrated by FAOSTAT (Figure 11).
During growth and development protein needs are high, and consumption of animal products will provide both greater quantity and quality of protein than plant products (DGAC, 2010b), for this reason studying dietary patterns that includes red meat is important in global health (McAfee, et al., 2010).
11
2.4
The role of meat as animal fat source and health
Fats are a key factor in the maintenance of caloric balance and body weight. Specific fatty acids also serve as precursors for numerous biological pathways that influence inflammation, coagulation, and gene expression among other functions (DGAC, 2010a). Lean meat, after trimming external fat, as revealed by most recent analysis, is relatively low in fat (<7%) and have moderate cholesterol content (Williams, 2007).
2.5
Fatty acids in human nutrition
For many years, the intramuscular lipid composition of beef aroused considerable interest because of its implications in meat quality and human health. Dietary fats, or lipids, are a macronutrient class that includes many chemical compounds. Fatty acids, from both phospholipids and triacylglycerides, are of major nutritional importance. Cholesterol is also an important lipid, being present in animal foods only. Lipids are the most energetic nutrient, supplying more energy (9 kcal/g, approximately 37.66 kJ/g) than carbohydrates and protein. Lipids supply the essential fatty acids, as linoleic (LA) and alpha-linolenic (ALA) acids, lipid-soluble vitamins (vitamins A, D, E, K) and carotenoids (DGAC, 2010a). However, red meat was recognized as one of the main sources of saturated fat in the human diet (with a low PUFA/SFA ratio), which are associated to a number of health disorders (Luciano, 2009).
Fatty acids are heterogeneous lipids mostly found in cell membranes and fat depots. Their classification is based on their chain length, the number of double bonds, the position of the first double bond from the methyl end, and a cis versus trans configuration across a double bond. These structural heterogeneities among fatty acids are important determinants of the significant variation in biological effects of the different fatty acids. Fatty acid quantity and quality also vary by their source, with important differences between meat, fish, and plant sources, as well as natural versus synthetic sources (DGAC, 2010a).
Fatty acids typically have an even number of carbon atoms, in the range of 8–26, and can be separated in two classes, according with the presence of double bonds in the carbon chain. Those with only single bonds are referred to as saturated, whereas those with at least one C=C double bond are called unsaturated (Abayasekara & Wathes, 1999; Baghurst, 2001; Ruxton, Reed, Simpson, & Millington, 2004). The monounsaturated fatty acids (MUFA) have just a single double bound, while polyunsaturated fatty acids (PUFA) have two or more double bonds and are named according to the position of these bonds and the total chain length. For example, eicosapentaenoic acid (EPA or 20:5n-3) and docosahexaenoic acid (DHA or 22:6n-3) are both omega-3 or n-3PUFAs with five six double bonds, respectively.
12
There are two classes of essential fatty acids (EFA), n-6 and n-3 (Figure 12). The distinction between n-6 and n-3 PUFA relies on the location of the first double bond, counting from the methyl end of the fatty acid molecule (Ruxton, et al., 2004; Simopoulos, 2008). The n-6 and n-3 fatty acids areessential because humans like all mammals, cannot synthesize them and must obtain it from the diet (Simopoulos, 2008). A balanced intake of both n-6 and n-3 fatty acids is essential for health (Simopoulos, 1999).
Figure 12 - Elongation and desaturation of n-6 and n-3 polyunsaturated fatty acids (copied from Simopoulos, 2008)
There is competition between n-6 and n-3 fatty acids for the desaturation enzymes (Simopoulos, 2008). Desaturase and elongase are vital enzymes for the conversion of ALA to DHA and EPA. The Desaturase enzymes have a preference for ALA but the presence of high levels of plasma LA (caused by high n-6 PUFA intakes) can shift its actions towards the n-6 pathway (Ruxton, et al.,
13
2004). There is increased evidence of beneficial effects from EFA supplementation during pregnancy, lactation, infancy and throughout life (Brenner, 2003). However, increased amounts of n-6 fatty acids are common in the Western diet (Givens, Kliem, & Gibbs, 2006; Simopoulos, 2008), consequently the eicosanoid metabolic products from arachidonic acid (AA), specifically prostaglandins, thromboxanes, leukotrienes, hydroxy fatty acids, and lipoxins, are formed in larger quantities than those formed from n-3 PUFA, specifically EPA (Simopoulos, 1999). A diet rich in n-6 fatty acids shifts the physiologic state to one that is prothrombotic and proaggregatory, with increases in blood viscosity, vasospasm, and vasoconstriction and decreases in bleeding time (Simopoulos, 1999).
The n-3 PUFAs, especially long-chain EPA and DHA fatty acids, exert a strong positive influence on human health. At present, fish oil is the major source of n-3 PUFA (Arab-Tehrany et al., 2012). The n-3 PUFAs are considered a key element for an adequate development and functioning of the nervous system. Numerous studies have pointed out the relationship between n-3 PUFA and mental illnesses. (Fenton, Hibbeln, & Knable, 2000; Lin & Su, 2007; Mamalakis, Kiriakakis, Tsibinos, & Kafatos, 2004; Stoll, Locke, Marangell, & Severus, 1999; Su, Huang, Chiu, & Shen, 2003). In animal studies, n-3 PUFA have been shown to influence body composition and to reduce the accumulation of body fat, thereby affecting body weight homeostasis (Martinez-Victoria & Yago, 2012). In reproduction, alteration of the concentration and ratio of n-6 and n-3 PUFAs has been shown to affect number and size of ovarian follicles, the ovulation rate, progesterone production by the corpus luteum, the timing of luteolysis and gestational length (Abayasekara & Wathes, 1999). 2.5.1 Saturated fat and health
Saturated fatty acids (SFA) are associated with a poor lipid/lipoprotein profile and increased risk of cardiovascular disease (CVD) (Hu et al., 1999; Hunter, Zhang, & Kris-Etherton, 2010; Khosla & Hayes, 1994; Willett, 2012). However, different saturated fatty acids can have different effects on plasma lipid and lipoprotein concentrations. The myristic acid is considered as the saturated fatty acid which increases CVD risk (Loison, Mendy, Sérougne, & Lutton, 2007), while has been shown the neutrality of stearic acid, which has been found the most suitable candidate to replace trans-fatty acids (TFA) in food (Hunter, Zhang, & Kris-Etherton, 2010). Lin et al. (2004) in their prospective cohort study provide little support for an association between dietary fat and colorectal cancer risk, but intake of fried foods, which means high levels of SFAs, and/or other factors related to their intake may be associated with colorectal cancer development.
14 2.5.2 Mono- and polyunsaturated fat and health
Monounsaturated fats (MUFA) have one double-bonded in the carbon chain. Eating monounsaturated are believed to lower cholesterol levels and reduce the risk of heart disease and stroke (Masala et al., 2007). Polyunsaturated fats are not synthesized by human body and for that are also referred to as essential fatty acids. They can be divided into two categories: n-6 fatty acids and n-3 fatty acids (Ruxton, et al., 2004). N-3 fatty acids play a role in normal growth and development and proper brain function. They also reduce widespread inflammation and decrease the risk of chronic diseases, such as heart disease, arthritis and cancer (Kazemian, et al., 2012). Like n-3 fatty acids, n-6 fatty acids play a role in growth, development and brain function, but they also regulate metabolism, stimulate hair growth and keep the reproductive system healthy. Unlike n-3, some n-6 fatty acids can promote inflammation. In order to follow healthy is to consume a balance diet of both types of fatty acids (Calder, 2012).
2.5.2.1 Cardiovascular health and disease
n-3 PUFAs competitively displace n-6 PUFAs for incorporation into cell membranes (Ander, Dupasquier, Prociuk, & Pierce, 2003; Shaikh & Edidin, 2006). AA is potentially one of the most important of the n-6 PUFAs and upon cell activation, is released from the cell membrane and is transformed into powerful cellular inflammatory/prothrombotic mediators such as thromboxanes, prostaglandins, and leukotrienes leading to a plethora of cellular effects. n-3 PUFAs have specific regulatory pathways such as insulin sensitization, anti-inflammatory, electrical remodeling of cardiomyocytes, hemodynamic effects and reverse myocardial remodeling (anti-fibrotic effect) (Kazemian, et al., 2012).
Over the past few decades, there was collected a considerable amount of data supporting the benefits of n-3 PUFAs on overall cardiovascular health. Reasons for the potential cardiovascular benefits of n-3 PUFAs are multifactorial and not completely understood (Jarreau, Lee, Lavie, & Ventura, 2012).
Epidemiological and clinical studies suggest that consumption of n-3 PUFA contributes to the reduction of cardiovascular mortality through different mechanisms including modulation of cellular metabolic functions, gene expression and beneficial effects on lipid profile or blood pressure (Cabo, Alonso, & Mata, 2012).
Clinical studies suggest that EPA and DHA from fish oil not only prevent the incidence of detrimental cardiovascular events, but also lower the cardiovascular mortality rate (Abayasekara & Wathes, 1999; Balakumar & Taneja, 2012). It has also been shown that the use of very long chain n-3 polyunsaturated fatty acids (n-3LCPUFA) could potentially benefit the Metabolic Syndrome
15
(MS), a disease characterized by accumulation of CVD risk factors, by exerting an hypotriglyceridemic effect in metabolic syndrome (MS) patients (Lopez-Huertas, 2012). The triglyceride lowering may produce further benefits by reducing pro-atherogenic LDL levels and also perhaps by ameliorating the inflammatory process associated with MS (Lopez-Huertas, 2012).(Ann Chao, 2005)
2.5.2.2 Inflammatory diseases
Inflammation plays a key role in many common conditions and diseases. Fatty acids can influence inflammation through a variety of mechanisms acting from the membrane to the nucleus. They act through cell surface and intracellular receptors that control inflammatory cell signalling and gene expression patterns (Calder, 2012). Modifications of membrane fatty acid composition can modify membrane fluidity, lipid raft formation and cell signaling leading to altered gene expression and can alter the pattern of lipid and peptide mediator production (Calder, 2012). Cells involved in the inflammatory response usually contain a relatively high proportion of AA in their membrane phospholipids (Calder, 2012). Eicosanoids produced from AA have well-recognised roles in inflammation. Oral administration of the marine n-3 fatty acids EPA and DHA increases the contents of EPA and DHA in the membranes of cells involved in inflammation by decreasing the amount of AA present (Calder, 2012). This is accompanied by a decrease in the amount of AA present. EPA is a substrate for eicosanoid synthesis and these are often less potent than those produced from AA (Calder, 2012). EPA gives rise to E-series resolvins and DHA gives rise to D-series resolvins and protectins. Resolvins and protectins are anti-inflammatory and show remarkable potency in resolving inflammation-related diseases (Xu et al., 2010). Thus, the exposure of inflammatory cells to different types of fatty acids can influence their function and so has the potential to modify inflammatory processes (Calder, 2012).
N-3 LCPUFA, such as EPA and DHA can also reduce the development of allergic disease by affecting both the innate and adaptive immune system involved in the initiation and persistence of allergic disease (Van den Elsen, Garssen, & Willemsen, 2012).
Although the inflammation may afflict different body compartments, one common characteristic of these conditions and diseases is excessive or inappropriate production of inflammatory mediators, including eicosanoids and cytokines (Calder, 2012). The roles of n−6 and n−3 PUFAs in shaping and regulating inflammatory processes and responses suggest that the balance of these fatty acids might be important in determining the development and severity of inflammatory diseases (Simopoulos, 2008). For example, a high intake of n−6 PUFAs, especially AA, could contribute to inflammatory processes and so could predispose to or exacerbate inflammatory diseases.
16
Conversely, the recognition that the long-chain n−3 PUFAs have anti-inflammatory actions suggests that increasing their intake by patients with inflammatory diseases, for example, through dietary supplementation, may be a clinical benefit (Calder, 2006).
Rheumatoid arthritis (RA) is a chronic inflammatory autoimmune disease of the joints and bones. The n-6 PUFA and AA are the precursor of inflammatory eicosanoids which are involved in RA (Miles & Calder, 2012). Some therapies used in RA target AA metabolism. Marine n-3 PUFAs (EPA and DHA) found in oily fish and fish oils decrease the AA content of cells involved in immune responses and decrease the production of inflammatory eicosanoids from AA (Miles & Calder, 2012). EPA and DHA give rise to eicosanoid mediators that are less inflammatory than those produced from AA and both give rise to resolvins that are anti-inflammatory and inflammation resolving, although little is known about these latter mediators in RA (Miles & Calder, 2012). Despite their well-known anti-inflammatory actions, the clinical usefulness of n-3 PUFA in inflammatory bowel disease is still controversial (Cabre, Manosa, & Gassull, 2012).
2.5.2.3 Neuronal function and diseases
n-3 PUFA may be key for an adequate development and functioning of the nervous system. This notion is further supported by the high concentrations of n-3 LCPUFA such as docosahexaenoic acid (DHA) in the cerebral cortex and the retina, a brain-derived neuronal network specialized for photo-signal transduction and processing (Mohajeri & Winwood, 2012; Uauy & Dangour, 2006). Docosahexaenoic acid (DHA) is the major polyunsaturated fatty acid (PUFA) in the brain and a structural component of neuronal membranes (Innis, 2007; Mohajeri & Winwood, 2012; Sparks, Martin, Gross, & Hunsaker, 2000; Tanaka, Farooqui, Siddiqi, Alhomida, & Ong, 2012; Uauy & Dangour, 2006).
n-3 PUFA deprivation may affect brain development at multiple levels, from membrane biogenesis, through gene expression, protection against oxidative stress, and altered neurotransmission (Innis, 2007).
Evidence suggests that dietary DHA supplementation may have beneficial effects on neurotransmission (Tanaka, et al., 2012). Several studies, but not all, reported improvements of the offspring in some neurodevelopmental tests as a result of DHA supplementation during gestation, or, at least, positive relationships between maternal or cord serum DHA percentages and cognitive skills in young children (Larque, Gil-Sanchez, Prieto-Sanchez, & Koletzko, 2012), while severe DHA deprivation leads to mental retardation (Hibbeln et al., 2007). Maternal seafood consumption in pregnancy provide an healthy fetal neurodevelopment rather than harm (Hibbeln, et al., 2007).
17
Numerous studies have pointed out the relationship between n-3 PUFA and mental illnesses. (Fenton, et al., 2000; P. Y. Lin & Su, 2007; Mamalakis, et al., 2004; Stoll, et al., 1999; Su, et al., 2003). Neurocognitive disorders such as attention-deficit hyperactivity disorder (ADHD), dyslexia, dyspraxia and autism spectrum disorders are often associated with a relative lack of n-3 fatty acids (Schuchardt, Huss, Stauss-Grabo, & Hahn, 2010). n-3 PUFA indeed are considered therapeutically against schizophrenia (Fenton, et al., 2000), bipolar disorder (P. Y. Lin & Su, 2007; Stoll, et al., 1999) and depression (Mamalakis, et al., 2004), given that patients suffering those conditions were lacking these fatty acids within the body.
Children and adolescents with ADHD have been shown to have significantly lower plasma and blood concentrations of PUFA and, in particular, lower levels of n-3PUFA (Gillies, Sinn, Lad, Leach, & Ross, 2012; Schuchardt, et al., 2010).
2.5.2.4 Cancer risk and protection
Consumption of meat, rather than fatty acids intake, is considered to increased cancer risk, particularly those affecting large intestine, prostate and breast (Chao, 2005; Biesalski, 2005; Broitman, 1986; Gerber, 2012; Giovannucci et al., 1993; Kuriki & Tajima, 2006; Kushi & Giovannucci, 2002; Larsson, Kumlin, Ingelman-Sundberg, & Wolk, 2004; Lin, et al., 2004; McAfee, et al., 2010; Simopoulos, 2002; Stacewicz-Sapuntzakis, Borthakur, Burns, & Bowen, 2008; Sun-Il et al., 2008; Wang & Jiang, 2012). Recommendations to decrease red meat intake, particularly processed meat or beef intake, may decrease the risk of colorectal cancer and prostate cancer (Kushi & Giovannucci, 2002). Evidence showed that prolonged high consumption of red and processed meat may increase the risk of cancer in the distal portion of the large intestine (Chao, 2005).
Several studies reveal that low-fat diets high in n-3 fatty acids reduce cancer risk, while high-fat diets rich in n-6 fatty acids may promote cancer cells growth (Larsson, et al., 2004; Stacewicz-Sapuntzakis, et al., 2008). In the past, the strong correlation between consumption of fat and mortality rate from prostate cancer has raised the hypothesis that dietary fat increases the risk of this malignancy (Giovannucci, et al., 1993), but epidemiologic studies have been inconsistent (Gann et al., 1994). Studies on long-term consumption of large amounts of linoleic acid associated with increased cancer risk revealed to be inconsistent (Zock & Katan, 1998).
Lin et al. (2004) in their prospective cohort study provide little support for an association between dietary fat and colorectal cancer risk, but intake of fried foods, which means high levels of SFAs, and/or other factors related to their intake may be associated with colorectal cancer development.
18
Experimental models showed consistently a modulation of carcinogenesis by n-3 PUFA and that fish intake is often described as part of a beneficial dietary pattern (Gerber, 2012).
2.5.3 Cholesterol and health
Cholesterol is a steroid-based alcohol with a hydrocarbon side-chain. Cholesterol has both hydrophilic and hydrophobic properties; hydrophilic property is due to its hydroxyl end, while its hydrophobic properties are due to its hydrocarbon side-chain (DGAC, 2010a). It is an essential structural component of mammalian cell membranes and is required to establish the proper membrane permeability, fluidity and a precursor of bioactive lipids such as bile acids and steroid hormones (Ohlsson, 2010).
Cholesterol is carried throughout the body by specific lipoproteins, the very low-density lipoprotein (VLDL), low-density lipoproteins (LDL) and high-density lipoproteins (HDL). VLDL and LDL are responsible for carrying dietary and biosynthesized cholesterol to the tissues, while HDL is responsible for carrying it back to the liver. (Amarenco, Labreuche, & Touboul, 2008; Burillo et al., 2009; Chirovsky, Fedirko, Cui, Sazonov, & Barter, 2009; Elsøe et al., 2012; Loison, et al., 2007; Ohlsson, 2010; Olson, 1998; Savel et al., 2012; Willett, 2012; Zoratti, 1998).
Cholesterol is an essential molecule to humans, due to structural and functional reasons. However, abnormally high levels of cholesterol (from the diet or atypical liver production) and abnormal proportions of low-density lipoproteins (LDL, also known as the bad cholesterol) and high-density lipoproteins (HDL, also known as the good cholesterol) are associated with cardiovascular diseases (Muchenje, et al., 2009).
Plasma cholesterol levels are influenced by the cholesterol content of diet and by the fatty acid composition of the diet. Some fatty acids of the SFA group, namely lauric (C12:0), myristic (C14:0) and palmitic acids (C16:0) have been shown to promote endogenous (liver) cholesterol production and thereby increase serum cholesterol level (Muchenje, et al., 2009). Among them, myristic acid was considered as the SFA responsible for the highest increase in plasma total cholesterol and in LDL levels, in both human subjects and animals (Loison, et al., 2007). Trans fatty acids (TFA) present in the diet can also affect cholesterolemia. LDL and cholesterol synthesis appears to increase as a result of high dietary TFA intake, while high-density lipoprotein-cholesterol has been shown to decrease (French, Sundram, & Clandinin, 2002; Hunter, 2006).
LDL and LDL oxidation is thought to play a key role in the development of atherosclerosis (Elsøe, et al., 2012; Hajjar & Haberland, 1997; Leonarduzzi, Sottero, & Poli, 2002; Pietras, Pieszka, Bederska-Łojewska, & Orczewska-Dudek, 2012). Cholesterol pathological levels have also been associated with neuropathies such as Parkinson’s and Alzheimer’s disease (Hu, 2010; Sparks, et al.,
19
2000). Heart disease may be the forerunner to the Alzheimer’s disease (AD), and cholesterol may be involved in the production and accumulation of b-amyloid protein in the brains of AD patients (Sparks, et al., 2000). Hu (2010) reviewed associations of serum cholesterol with Parkinson’s disease, but to date the risk associations between the two remain inconsistent.
Clear cholesterol intake recommendations are not easy to establish, as there is no precise basis for selecting a target level, however, the American Heart Association (AHA) suggest 300 mg/d as maximum daily intake (Krauss et al., 2000).
Chizzolini et al. (1999) measured the average content of cholesterol in beef that is 60 mg in100 g, while from Dinh et al. (2011) estimates it ranges between 36 and 58 mg in100 g, averaging 48,2 mg in 100 g. Is to be pointed out that cholesterol content differs according to muscle with oxidative and glycolytic fiber (Dinh et al., 2011). Oxidative muscles are richer in phospholipids this means high cholesterol content (Chizzolini et al. 1999).
2.6
Importance of pH in meat quality evaluation
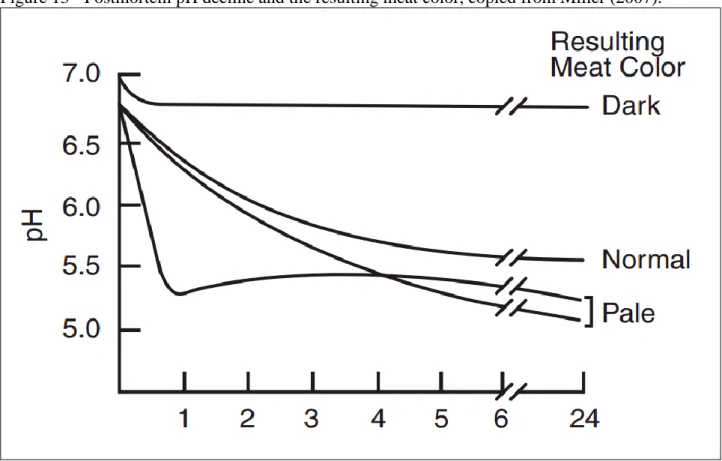
The pH level of meat can affect the shelf-life of the meat, its color, its tenderness, and the eating quality. The pH is useful to predict meat tenderness. The normal or ultimate pH level of meat should be between 5.3 and 5.7. For example, an ultimate pH within this values promotes a bright red attractive color in beef, whereas, lower pH (below 5.3) causes pale, soft, weepy meat, which is rare in beef but very common in pork meat. After death, glycogen consumption leads to lactic acid accumulation in meat, which is responsible for the pH decline from 7.0 to about 5.7 (Figure 13) during normal rigor mortis development (Miller, 2007). The normal pH decline of meat during rigor mortis can be altered by low levels of glycogen at slaughter, causing meat to retain a high pH (Miller, 2007). At high pH (above 5.9) the meat will become darker and quality begins to decline. During the handling, transport and pre-slaughter period, muscle glycogen is consumed rapidly, after slaughter there is little lactic acid production, the main responsible of pH decline, which results in DFD (dark, firm and dry) meat (Muchenje et al., 2009). ‘Dark cutting” meat spoils quickly, is sticky, unacceptable to consumers and unsuitable for ageing. This DFD meat is of inferior quality as the less pronounced taste and the dark color is less acceptable to the consumer and it has a shorter shelf-life, due to the abnormally high pH value, which promote bacterial growth (Muchenje, et al., 2009). Stress, prior to slaughter, is said to be one of the most important influences to ultimate meat tenderness by affecting water-holding capacity of meat. Water-holding capacity (WHC) is defined as the ability of meat to retain its water during application of external forces, such as cutting, heating, grinding or pressing (Muchenje, et al., 2009). Low pH and high temperature during the onset of rigor promote exudative meat as myofilaments at this condition are more loose (Muchenje,
20
et al., 2009). To understand better the importance of the pH and temperature profile at this stage, it affects also myoglobin and enzymes stability, which are meat color crucial factors in early postmortem (Hwang & Thompson, 2003).
Production system and feeding can influence the ultimate pH as well. Grass-fed animals have darker meat than have grain-fed ones. This is caused by the higher pHu values found in beef from grass-fed compared to grain-fed cattle. It has been argued that grass-fed steers may be more susceptible to pre-slaughter stress and associated pre-slaughter glycogen depletion than are grain-fed steers, as the latter would be better accustomed to penning and handling (Muchenje, et al., 2009).
Figure 13 - Postmortem pH decline and the resulting meat color, copied from Miller (2007).
2.7
Meat characteristics in consumer choice
In the last decades, meat production has been transformed, going through a process of increasing productivity and efficiency of production that raise several issues, such as animal welfare, food safety and environment safety. All these transformations have gained strength, especially, due to the outbreaks of some important diseases, like the foot and mouth disease and bovine spongiform encephalopathy (BSE) (Angulo & Gil, 2007; Euclides Filho, 2004). Along with meat health and environmental concerns, several factors influence the changes in consumer demand including: demographic characteristics of population (sex, age, ethnicity, etc.), convenience, type of
21
distribution from little butcher’s shop to big supermarket and price. Consumer preferences for meat, from a sensory stand point, are influenced by appearance, tenderness, flavor, and juiciness (Resurreccion, 2004).
2.7.1 Color at display
Meat color is a very important quality parameter for both industry and consumer (Delmore, 2009; Gray, et al., 1996; Smith, et al., 1996). Meat cuts that have lost their fresh appearance are discriminated by consumers (Gray, et al., 1996). Color is a very important shelf-life spoiler, as consumer notices easily the dark appearance of meat and would not purchase it (Smith, Morgan, Sofos, & Tatum, 1996). Shelf-life is the time meat takes to become unpalatable or unfit for human consumption because of surface oxidation or the growth of spoilage organisms (Delmore, 2009; Gray, et al., 1996; Smith, et al., 1996). Meat shelf-life is evaluated by color, odor and flavor (Delmore, 2009). Although a change in color doesn’t mean that meat is unpalatable or unfit to be consume or, worse, unsafe, yet color and odor have the tendency to spoil together over time (Wood et al., 2004). Grass-fed animals have darker meat than have grain-fed ones.
It is often referred to as case life rather than shelf-life, as color play major role, that is the length of time meat can be displayed under refrigeration before a color change occurs (Delmore, 2009; Smith et al., 1996). Therefore, meat color stability is a great concern in meat industry as affects strongly consumer’s purchasing will (Renerre, 2000). Vitamin E supplement in bovine feeding has been shown to increase shelf-life in retail display (Arnold et al., 1992; Yang, Lanari, Brewster, & Tume, 2002). To meet consumer expectations, meat should have an attractive bright-red color compatible with long shelf-life and good eating quality (Kerry, Buckley, & Galvin, 2000).
2.7.2 Vitamin E
Vitamin E represents the major lipid-soluble antioxidant found in animal cells (Gray, Gomaa, & Buckley, 1996; Lucarini & Pedulli, 2007). Vitamin E is the generic name for various tocopherols and tocotrienols homologous with α-tocopherol being the most active (Lucarini & Pedulli, 2007). The main function of vitamin E is to prevent the peroxidation of membrane phospholipids, and to avoid cell membrane damage through its antioxidant action (Cameron Faustman & Wang, 2000; Gray, et al., 1996; Lucarini & Pedulli, 2007; Schaefer, 2007; Smith, et al., 1996; Yang, Lanari, Brewster, & Tume, 2002). Due to its lipophilic nature, vitamin E is found mostly in cell membranes (Cameron Faustman & Wang, 2000; Kerry, Buckley, & Galvin, 2000; Lucarini & Pedulli, 2007; Michelle Renerre, 2000; Smith, et al., 1996) Oxidation of red oxymyoglobin to brown metmyoglobin is responsible for the color change, while the propensity of unsaturated fatty acids to
22
oxidize leads to the development of rancidity over time (Lucarini & Pedulli, 2007; Schaefer, 2007; Smith et al., 1996; Wood et al., 2004). These biochemical reactions generally proceed in parallel, indeed, it has been shown that lipid oxidation products can promote pigment oxidation and vice versa (Wood et al., 2004). The ability of unsaturated fatty acids, especially those with more than two double bonds, to rapidly oxidize, is important in regulating the shelf-life of meat (rancidity and color deterioration) (Wood et al., 2004). Radical species, such as peroxides produced during lipid oxidation, act directly to promote pigment oxidation (Gray, et al., 1996). Others factors such as stress, postmortem pH, carcass temperature and slaughter techniques (i.e. electrical stimulation) can induce oxidation (Gray, et al., 1996). Vitamin E prevents both lipid and myoglobin from being oxidized (Lucarini & Pedulli, 2007; Smith et al., 1996; Wood et al., 2004), being for that reason of prime importance to the preservation of meat red cherry color and meat nutritional quality.
Two classes of antioxidants can be found in animals: enzymatic and non-enzymatic. Enzymatic antioxidants continue to exert their function post-mortem though their effectiveness diminishes with increasing time post-mortem (Monahan, 2000). Non-enzymatic antioxidants, such as Vitamin C, Vitamin E, β-Carotene and other reducing peptides exert their functions at their own site individually, remaining effective longer in postmortem conditions (Niki, Noguchi, Tsuchihashi, & Gotoh, 1995). A single molecule of Vitamin E is enough to protect thousands of phospholips (Pryor, 1982). Vitamin C protects against both lipid oxidation and oxyhemoglobin oxidation (Cameron Faustman & Wang, 2000).
2.7.3 Tenderness, flavor and juiciness at consume
The importance of flavor, tenderness, and juiciness traits to the consumer in the purchasing-decision process is widely recognized ( Huff Lonergan, Zhang, & Lonergan, 2010, Koohmaraie, Wheeler, & Shackelford, 1995, Resurreccion, 2004). Immediately after slaughter meat is tender (low shear force) (Koohmaraie et al., 1995). However, because of the muscle shortening which accompanies rigor mortis development, meat toughens during the first 12 to 24 hours after death (Koohmaraie et al., 1995). Simultaneously, an opposite phenomenon (i.e., tenderization) also begins either at slaughter or shortly after slaughter (Koohmaraie et al., 1995). Postmortem proteolysis degradation of a few key structural proteins by endogenous enzymes is responsible for postmortem tenderization (Koohmaraie et al., 1995).
Among the proteolytic systems endogenous to skeletal muscle, the only enzyme system involved in meat tenderization is the calpain (calcium-dependent) proteolytic system (Koohmaraie et al., 1995). To improve tenderness beef should be aged at least 14 days, lamb should be aged for 10 days and pork for 5 days (Koohmaraie et al., 1995). Stress, prior to slaughter, is said to be one of the most
23
important influences on pHu and ultimate meat tenderness. As it was explain above, it may result from transportation, rough handling, extreme temperatures, or anything that causes the animal to draw on its glycogen reserves before slaughter (Muchenje, et al., 2009). Protein degradation and protein oxidation have been identified as processes that modify proteins as well as the tenderness of meat (Huff Lonergan, Zhang, & Lonergan, 2010).
Flavor is a cooking-derived meat quality (Calkins and Hodgen, 2007, Williamson, 2012). Sulfurous and carbonyl compounds liberated from the Maillard reaction, or non-enzymatic browning, are responsible for meat flavor (Calkins and Hodgen, 2007). In general, amino compounds condense with the carbonyl group of a reducing sugar in the presence of heat (Calkins and Hodgen, 2007, Williamson, 2012). This produces gylcosylamine which is rearranged and dehydrated to form furfural, furanone derivatives, hydroxyketones, and dicarbonyl compounds. All of these compounds contribute to flavor (Calkins and Hodgen, 2007, Williamson, 2012). As the reaction progresses, the intermediates can react with other amines, amino acids, aldehydes, hydrogen sulfide, and ammonia through the Amadori rearrangement, Strecker degradation, and Schiff bases pathways, and all these molecules contribute to meat flavor (Calkins and Hodgen, 2007).
Juiciness refers to the liquid or moisture liberated during eating. As flavor, depends also on consumer preference and on cooking (Aaslyng, Bejerholm, Ertbjerg, Bertram, & Andersen, 2003). It has however been shown that the correlation between cooking loss and the initial juiciness depends on the raw meat quality, especially on the pH, as the class with the low pH acts differently from the other classes (Aaslyng, et al., 2003; Toscas, Shaw, & Beilken, 1999). It is also known from previous studies that the pH, due to its effect on electrostatic repulsion, affects the distance between the myofilaments and, moreover, it has recently been shown that the distance between the myofilaments influences the distribution of water and how tightly the water is bound in the meat (Toscas, et al., 1999). If the liquid lost from the meat during cooking came from different populations of water, and the water assessed as juiciness early in the chewing circle only came from the loosely bound water, this could explain why the pH influences the correlation between cooking loss and juiciness (Toscas, et al., 1999).
24
3. Materials and methods
3.1
Animals and samples
Meat samples were obtained from carcasses of pure bred Holstein young bulls (aged between 8 and 12 months old)) from Dutch (n=10), Spanish (n=10) and Portuguese (n=10) production. Young bulls from crossbred beef background with similar age and raised in Portugal were also included in the study (n=10).
Beef used in this study represented the regular bovine meat commercialized in Portugal by Pingo Doce and was collected in June of 2012. Carcasses arrived at the butchery with different periods between slaughter and sampling, 4 days for Dutch carcasses, 3 days for Spanish carcasses and 2 days for Portuguese carcasses. Meat samples were collected from carcasses in the butchery at the first day of their arrival, two meat samples from each carcass were collected from the longissimus lumborum muscle at the L1-L3 location. The two meat samples were collected with different thickness (1 sample with 3 cm, and the other with 1 cm). The 3 cm thickness sample was used for physic-chemical analysis (color assessment, pH and Warner Bratzler shear force (WBSF), while the 1 cm thickness sample was used to the biochemical evaluation.
Samples were treated in a differentiated manner according to the analysis to be performed. The 3 cm thickness sample was just trimmed of major connective and adipose tissues in the muscle margins. On the other hand, the 1 cm thickness sample was trimmed of major connective and adipose tissues present in the muscle tissue, and then blended in a food processor (Moulinex, France).
The blended meat was then divided in two portions: one of the portions was weighted and stored frozen -20°C in a 50 ml Container (Greiner, Germany). The second portion was vacuum packaged, frozen and stored at -18 ºC until the laboratory analysis.
3.2
Beef color measurements, pH determination and Warner Bratzler shear
force quantification
Beef samples with 3 cm thickness were used for and in the following sequence:
1) Beef color measurements were carried out with a Minolta CR 300 colorimeter (Konica Minolta Holdings Inc., Tokio, Japan) with a C iluminant and a 2º standard observer in the CIELAB space, after 1 hour of blooming to allow oxygenation. The color coordinates derived directly from the colorimeter were lightness (L*), redness (a*), yellowness (b*).
25
Chroma (C*) and hue (h*) were calculated from a*and b* values according to the following the equations (Hue = tan-1 (b*/a*); Chroma= (a*2 + b*2)1/2);
2) The beef pH was measured with a HI 99163 portable pH-meter (Hanna Instruments, USA). The pH was measured three times in each sample, and the value expressed was the mean of the three determinations;
3) The samples were grilled until it reached 70 ºC of internal temperature. Grill cooking was conducted with a Modular 65/70 FTES electric griddle (Modular System Ltd., Italy) preheated at a temperature of 250 ºC. The temperature was controlled with a needle thermocouple probe, which was inserted horizontally at the midpoint of the steak’s width. The steaks for WBSF were chilled until reached room temperature. Each sample provided a minimum of eight strips with a 1 cm2 cross section. The cores were removed parallel to the muscle fibre orientation and were sheared perpendicular to the longitudinal orientation of the muscle fibres, using a TA-TX Plus Texture Analyser (Stable Micro Systems Ltd., Surrey, UK) equipped with a Warner-Bratzler shear blade. The beef sample resistance to shearing was recorded in a force-deformation plot. The maximum shear force in kg corresponded to the highest peak of the curve.
3.3
Analytical methods
3.3.1
Lyophilization
Meat stored frozen in the 50 ml container was submitted to lyophilization (−60 °C and 2.0 h Pa) until constant weight using a lyophilisator Edwards Modulyo (Edwards High Vacuum International, West Sussex, UK). Lyophilized muscle samples were then ground and homogenized using a home-style coffee grinder and maintained desiccated at room temperature, and analyzed within two months.
3.3.2
Fatty acid analysis
Fatty acid methyl esters were prepared from directly from lyophilized muscle samples using a solution of 14% boron-trifluoride in methanol (Sigma, USA), as preiously described by (Rule, 1997). Briefly, 100 mg of lyophilized muscle were weighted and mixed with 2 ml of boron-trifluoride in methanol, 2 ml of methanol and 1 ml of the internal standard solution (2 mg of nonadecanoate per ml of n-Hexane). The instrumental tubes were then closed, vortex-mixed and placed in water bath at 80 °C for two hours with maximum agitation. Afterwards, tubes were allowed to cool, and 3 ml of water and 3 ml of hexane were added, tubes were capped and
vortex-26
mixed for 15 s, and submitted to centrifugation at 2500 rpm for 5 min to accelerate phase separation, 2.0 ml of the upper phase were transferred to GLC auto-sampler vials and sealed.
The identification of fatty acid methyl esters was detected by gas-liquid chromatography using an Shimadzu GC2010-plus (Shimadzu, Kyoto, Japan) equipped with a flame ionization detector (FID) and a fused-silica capillary column (BPX70, 60 m × 0.25 mm × 0.25 μm, SGE Europe Ltd, UK), helium was used as the carrier gas, in a flow of 1 ml/min. One ml of the sample was injected in split mode 1:30. The oven temperature was programed to begin a 50ºC (kept within a 1 min), raise from the 50° to 150° C at 50° C/min (kept within a 1 min), and then raise 1° C/min until the 200ºC (maintained for 2 min) and finally raise 3°C/min to the 220°C. The injector and detector were maintained at 250° C.
3.3.3
Cholesterol β-carotene and tocopherols determination
The simultaneous determination of total cholesterol, β-carotene and tocopherols was performed as previously described (Prates, Quaresma, Bessa, Fontes, & Alfaia, 2006). Briefly, the compounds in analysis were extracted from fresh meat samples with a saponification solution. Afterwards, samples were submitted to chromatography analysis for compound separation, using HPLC methodology and a normal-phase silica column. A couple of detectors in tandem (UV-visible photodiode array detector, and fluorescence detector) were used for compound detection.
Tocopherol detection was performed using fluorescence detection (excitation wavelength of 295 nm and emission wavelength of 325 nm), while the UV-visible photodiode array detector was used for simultaneously detection of both cholesterol (202 nm) and β-carotene (450 nm).
The injection volumes used varied between 10 and 100 μl in order to get values inside the linearity range of the standard curves. The contents of total cholesterol, tocopherols and β-carotene in meat were calculated, in duplicate for each muscle sample (values accepted for CV <6%), based on the external standard technique, from a standard curve of peak area vs. concentration.
3.3.4
Statistical analysis
All the parameters in study were subjected to analysis of variance (ANOVA), considering their origin as a single effect, using the GLM procedure of SAS. Least squares means were presented and compared, using the LSD test, when the effect of feeding system was significant (p< 0.05).