Assessing Ecophysiological Traits and
Distribution Patterns of Two Podarcis
Species in NE Iberia
Diana Carneiro
Faculty of Biology
Research Center in Biodiversity and Genetic Resources
Porto
Master Thesis
Porto 2012
Supervisor:
Prof. Doctor Miguel Angel Carretero
Co-supervisors:
Doctor Enrique García-Muñoz,
Table of Contents
List of manuscripts . . . 2
Abstract . . .
3
Abbreviations . . .
6
1 General introduction . . .
7
1.1 Thermal ecophysiology. . . .
8
1.2 Hydric ecophysiology. . . .
12
1.3 Ecological Niche Models
. . . .
16
1.4 Model species
. . . .
21
2 Objectives . . . 25
Manuscript I . . . 27
Manuscript II . . . 53
Manuscript III . . . 70
3 General discussion . . . 96
4 General conclusions . . .
100
5 General references . . . 102
Acknowledgments . . . 110
Glossary . . . 112
Supplementary material . . . 114
Appendix 1. . . 116
2
List of manuscripts
This thesis is based on the following manuscripts:
I Carneiro, D.,
García-Muñoz, E., Kaliontzopoulou, A., Llorente, G. A.,
Carretero, M. A. (2011). Comparing ecophysiological traits in two
Podarcis Wall lizards with overlapping ranges. Manuscript
II
Carneiro, D.,García-Muñoz, E., Carretero, M. A. (2012). Field body
temperatures of two Podarcis species (Reptilia: Lacertidae) in sympatry.
Manuscript
III
Carneiro, D. &Carretero, M. A. (2012). Predicting current and future
distribution patterns and putative sympatry areas of two Podarcis Wall
lizards in north-eastern Iberian Peninsula. Manuscript
3
Abstract
Ecological factors are known to limit species geographical distribution. Lacertids, being ectotherms, are likely to be most influenced by thermal conditions but factors such as environmental humidity or species interactions may also be preponderant.
Podarcis liolepis and P. muralis are lacertid species overlapping at a small scale in north-eastern Iberian Peninsula (IP). While P. liolepis ranges from the north-east of IP to southern France, P. muralis has a wide range across Europe but in IP is restricted to the north.
Knowing and understanding the factors most likely to shape this pattern is the aim of this study. This has been assessed through three methodological approaches. Ecophysiological experiments in the laboratory were conducted to assess the thermal and hydric requirements of P. liolepis and P. muralis (manuscript I). In a sympatry area, field records of body temperature were taken and the influence of environmental factors on body temperatures were assessed (manuscript II). Correlative predictive models were performed in order to assess the putative current and future geographic distribution of both species (manuscript III). The ecophysiological data previously obtained was integrated in the interpretation of the modelling data.
The three approaches revealed that environmental humidity and not temperature is the main abiotic factor constraining these species. However, evidence of possible interaction between both species was detected in terms of thermal physiology since the preferred body temperature of P. liolepis shifted upwards in the presence of P. muralis. Combining this information with the prediction for future scenarios of climate changes, it is expected that P. liolepis may be the most affected if climate gets to hot and dry since it would shift northwards and would disappear from some areas due to aridification. On the other hand, P. muralis’ range is likely to decrease but little fragmentation would occur.
Keywords
Podarcis, sympatry area, preferred temperature, water loss, Ecological Niche-based models, environmental humidity
5
“Much of the work that is done under the name of ecology is not ecology at all,
but either pure physiology (…) or pure geology, meteorology, or some other
science concerned primarily with the outer world.”
Charles Elton (1927, pp.33)
“As an ecological problem, the question of why a species has a restricted
distribution, given its present physiological and other features, can be
answered, even if with difficulty. But range limits pose an evolutionary problem
that has not been solved.”
6
Abbreviations
AUC Area under the receiver operating characteristics curve
CCCma Canadian Centre for Climate Modelling and Analysis
CSIRO Commonwealth Scientific and Industrial Research Organisation
CV Climatic variable
EGM Ecological Niche-based models
GIS Geographical Information Systems
HadCM3 Hadley Centre Coupled Model, version 3
IP Iberian peninsula
RH Relative humidity of the air
ROC Receiver operating characteristic
SVL Snout-to-vent length
Tair Temperature of the air
Tb (Field) Body temperature
Tp Preferred temperature
Ts Temperature of the substrate
W0 Initial weight
7
1
Introduction
Distribution patterns of species are driven by an assemblage of factors (Gaston, 2009) including abiotic (climate, geography, geology) and biotic factors (dispersal limitations, interactions among species; Hardin, 1960; Araújo and Luoto, 2007), phylogeography (Oliverio et al., 2000; Carranza et al., 2004), and ultimately, physiological limitations. In order to understand the most preponderant driving force(s) of distribution patterns insights from a variety of fields of study should be integrated. Genetic (Pinho et al., 2009; Camargo et al., 2010), morphological (Kaliontzopoulou et al., 2012) and modelling (Santos et al., 2006; Martínez-Freiría et al., 2008) techniques, among others, are widely used and should be combined with ecophysiological studies. Ecophysiology relates physiological mechanisms of organisms to their physical and biological environment (Macnab 2002).
Lizards provide good models to conduct ecophysiological studies since many species are conspicuous, sedentary and abundant, short-living and small, hence being easy to handle and to keep during laboratory studies (Pianka and Vitt, 2003).
Lizards constitute a paraphyletic assemblage within the Squamata order which also includes snakes (suborder Serpentes) and amphisbaenians (suborder Amphisbaenia) (Townsend et al., 2004; Camargo et al., 2010). Their representatives encompass a wide range of sizes, morphologies and ecological patterns and trends (Pianka and Vitt, 2003). They occupy a wide range of habitats from the tropical forests to the most arid and warm deserts both in water and in land (Vitt and Caldwell, 2009). Their distribution ranges as far north as latitude 70º, after the Arctic Circle (Andersen, 1971). However, only a restricted number of species cross that barrier revealing that most terrestrial ectotherms are not able to thrive at high latitudes and high altitudes because they impose marked constraints such as low environmental temperatures, shortage of shelters and short reproductive periods (Sears & Angilletta Jr., 2003). Therefore, temperate lizards living in such areas are more constrained in terms of growth and activity levels than conspecifics in more mild climates (Sears and Angilletta Jr., 2003)
8
because low air temperature and high relative humidity may restrict the time available to forage leading to lower growth rates and decreased reproductive output (Adolph and Porter, 1993). Such restrictions lead to changes in life histories strategies. For example, it has been reported that Sceloporus lizards hatchlings in high altitudes in southern Utah grow faster than the hatchlings at low elevations but attain the same body size by the following spring after hatching (Sears and Angilletta Jr., 2003).
Since evaporation increases with increasing temperature, it has been suggested a strong interaction between thermoregulation and water balance in ectotherms, particularly when water supplies are restricted (Mautz, 1982). Also, body size influences thermal and hydric requirements. Small-bodied organisms have low thermal inertia and lose water faster than bigger and heavier organisms (Sears and Angilletta Jr., 2003) because of the low surface/volume relation (Gans et al., 1968; Turk et al., 2010). When size increases mass increases faster than the surface area because the volume increases in proportion to the cube of the linear dimension while the surface area is proportional to the square of the linear dimension (mass is directly proportional to volume). Since heating and cooling rates are related to surface area it is common to find that heating rates of similarly-sized and phylogenetically related individuals do not differ (Stevenson, 1985; Tosini and Avery, 1993; Fei et al., 2012).
1.1 Thermal ecophysiology
The influence of temperature on physiology has been the main focus in reptile studies probably because empirical observations reveal that reptiles directly depend on the sun for their daily activities (Huey, 1976).
Physiological processes, behaviour and the performance of functions such as locomotion, reproduction, development, digestion and growth (Huey and Stevenson, 1979; Huey, 1982; Angilletta et al., 2002) depend on body temperature (Tb) because it constrains the rates of biochemical reactions (Hochochka and Somero, 2002). Some ectotherms have a wide range of optimal temperature and so, are named eurytherms. Conversely, stenotherms have a narrow range of optimal Tb (Huey, 1982).
Organisms show several responses on how they maintain Tb. Homoeothermic organisms such as birds and mammals are able to precisely maintain a constant and adequate Tb by regulating the rates of heat production and loss through high rates of metabolism. On the other hand, ectotherms (poikilotherms in old textbooks) cannot
9
metabolically maintain a stable body temperature (Huey and Slatkin, 1976; Castilla et al., 1999) so Tb mainly depends on changes of environmental temperature. Some ectotherms are, however, able to maintain a fairly constant body temperature different from environmental temperature by thermorregulating (Huey, 1982) since it allows keeping the rate of heating similar to the rate of heat loss (Schmidt-Nielsen, 1997b). Thermoregulation consists of a set of behavioural and physiological interconnected strategies used to reduce heat loss by conduction and evaporation and maximizing heat gain by radiation (for heliothermic species) or conduction (for thigmothermic species) in order to maximize heat storage (Fig. 1; Macnab, 2002). Conduction, evaporation and radiation are the three physical processes by which temperature is transferred between an organism and the surrounding environment. Conduction of heat occurs when there is direct contact between two surfaces; convection is the movement of a fluid, so it may complicate the conductive heat transfer. When there is no direct contact between two objects/surfaces, heat is transferred by radiation. Solar radiation is the only commonly available external source of radiation.
Fig. 1. Thermal transfer between a lizard and the surrounding environment. The animal heats by direct (sun) or indirect (soil, rocks) infrared radiation and conduction with the warm substrate and loses heat by evaporation, convection and conduction. Shifts between sun and shade also allow the animal to maintain a rather stable body temperature. Adapted from Ough et al., 2004.
10
Thermoregulatory behavioural strategies include i) habitat selection (changing heat flux by shuttling between hot and cold microenvironments), ii) exposing different surface areas by modifying posture (basking; see Glossary), and iii) regulating activity times (selective exploitation of environmental thermal flux) (Huey and Slatkin, 1976; Huey, 1982; Stevenson, 1985).
These behavioural strategies are controlled at neuronal level. Two sorts of hypothalamic receptors sensitive to temperature determine the upper and lower set point temperatures (Tosini and Avery, 1996). The upper and lower thermal set points are temperatures at which animals change behaviour in order to termorregulate more precisely, keeping Tb within the optimal range. Whenever Tb reaches the lower set point the animal makes the Tb rise by starting to bask. They can also place themselves in direct contact with warm substrate and increase heat gain by conduction with the temperature of the substratum. When an animal reaches the upper set point after basking, it starts a cooling behaviour, such as lighten the skin colour, positioning more parallel to the sun or shifting to the shade (Tosini and Avery, 1993). Skin colour is empirically expected to influence heating rates: darker colour would heat faster because it increases the amount of solar radiation absorbed rather than reflected (Schmidt-Nielsen, 1997b). However, in lacertid lizards no relevant differences in heating rates have been observed between melanic and non-melanic individuals (Tosini and Avery, 1993). Conversely, it appears to be a physiological by-product of other evolutionary pressures on behaviour (Raia et al., 2010).
Dorsal skin receptors trigger behavioural thermoregulatory mechanisms that are mediated by the described neural control. If no information reaches the skin receptors animals cannot properly control thermoregulatory behaviour hence spending more time in the heated area of a testing terraria and show a lower upper set point (Tosini et al., 1995). If Tb rises above the upper set point, performance rapidly decreases until the critical thermal maximum while below the lower thermal set point performance decreases slower until the critical thermal minimum (Huey and Stevenson, 1979). The critical temperatures are determined when an animal cannot respond to external stimuli, that is, it cannot turn on its feet when placed on its back (Yang et al., 2008). When animals are exposed to exceptionally high or low temperatures and are unable to prevent reaching a Tb near the critical thermal set points several factors may lead to death: (i) denaturation of proteins, thermal coagulation; (ii) inactivation of temperature-sensitive enzymes at rates that exceed formation rates; (iii) inadequate oxygen supply (because increased temperature accelerates the demand of oxygen; Niewiakowski and Waldschmidt, 1992); (iv) temperature effects on membrane structure (particularly in
11
molecular structures that depend on weak interactions that are easily changed by temperature); (v) different Q10 (see Glossary) on interdependent metabolic reactions (leading to depletion or accumulation of intermediary metabolic products) (Schmidt-Nielsen, 1997b). Usually reptiles cease activity much before reaching such critical values except in emergency situations (Huey, 1976).
By thermorregulating, reptiles use environmental conditions to reach a Tb close to the preferred body temperature (Tp) which is reached when there are no thermoregulatory constraints (Van Damme et al., 1990). This only happens in laboratorial controlled conditions since in the natural habitat biotic and abiotic constraints are present.
According to Tosini et al., (1994), the Tb of species within the lacertids genera Zootoca and Podarcis can be affected by the feeding status. After feeding, most lizards select higher mean Tb and higher upper and lower set point temperatures than before feeding or after defecating (Macnab, 2002; Tosini et al., 1994). The overall time spent basking and shuttling frequency also increased after feeding. This response is probably due to an increase of the rate and/or efficiency of digestion since higher Tb seems to facilitate the mechanical processing of food and the catabolic action of enzymes speeding the digestive process (Macnab, 2002; Tosini et al., 1994). However, the opposite pattern was observed in nocturnal geckos in which starved lizards selected higher Tp than fed lizards (Autumn and De Nardo, 1995). This may be related with the different diel cycles of diurnal and nocturnal species.
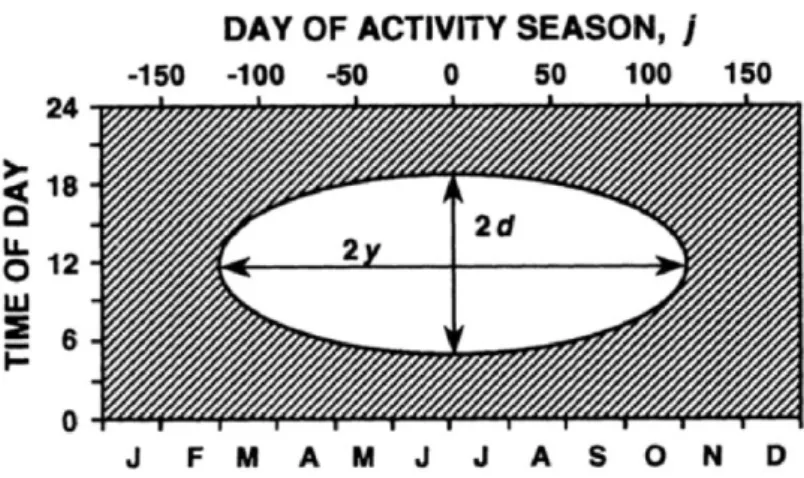
Daily activity patterns may change along the year for temperate lizards (Fig. 2). With increasing number of light hours activity periods are longer and Tb rises (Lorenzon et al., 1999). In contrast, with less light hours the lower and upper set points decrease (Rismiller and Heldmaier, 1982; Tosini and Avery, 1996) and lizards become inactive.
Fig. 2. Seasonal variation in diel activity of temperate diurnal lizards. White region indicates times when thermal conditions allow activity; shaded region indicates period of inactivity. Adapted from Adolph and Porter (1993).
12
During periods of inactivity Tb may fall outside the set-point range with no harm for the inactive individuals (Christian and Weavers, 1996). Tb changes caused by photoperiod are probably the result of its influence on different factors, namely on environmental temperature. For instance, photoperiod seems to affect thermal set points through the parietal eye (see Glossary) of lizards (Tosini and Avery, 1996). Infra-red irradiance also changes along the year or in a day-period hence influencing the levels of activity of lizards and selected Tb. When irradiation increases the upper and lower set point temperatures also increase (Tosini et al., 1995). In areas where fast changes of irradiance occur, as when cloud cover increases, responding rapidly to such changes is adaptive for lizards.
Several techniques have been widely used for measuring Tb of medium to small-sized lizards. The thermographic technique (infra-red thermography) is a non-invasive method adequate for measuring the temperatures of small and medium-sized lizards (Jones and Avery, 1989; Tosini and Avery, 1993). On the other hand, the contact thermometer allows measuring the core Tb by inserting a probe inside the cloaca (Rismiller and Heldmaier, 1982). Temperature records given by these two techniques are not equivalent: the infrared thermography provides with higher values of Tb and increasing bias with temperature which may occur because the infrared thermometer is not small enough and measures the background temperature (Carretero, 2012). With an infrared camera this bias would be prevented. Additionally, radiotelemetry is used to measure Tb in free-ranging reptiles of bigger size, as monitor lizards for example (Christian and Weavers, 1996) although it is an invasive technique, is not adequate for small species and it is expensive (Carretero, 2012).
1.2 Hydric ecophysiology
Ecophysiological studies regarding hydric requirements in adult reptiles are scarce. They are mainly focused on water loss (Wl) rates based on physiological studies on skin resistance to Wl and scales (Roberts and Lillywhite, 1980; Tu et al., 2002; Calsbeek et al., 2006).
Wl rates are correlated with the habitat occupied by many species. As a general trend, reptiles inhabiting dry habitats have higher skin resistance to Wl (Munsey, 1972; Bentley and Schmidt-Nielsen, 1966; Tu et al., 2002). This has been demonstrated for snakes (Gans et al., 1968; Dmi’el, 1998; Tu et al., 2002; Moen et al., 2005), agamid
13
lizards (Eynan and Dmi’el, 1993), anoles (Sexton and Heatwole, 1968; Dmi’el et al.,1997), skinks (Shoemaker et al., 1967), Sphaerodactylus geckos (Steinberg et al., 2007) tegu lizards (Christian et al., 1999), among others. Terrestrial reptiles usually have Wl rates much smaller than aquatic reptiles (Lillywhite and SanMartino, 1993; Moen et al., 2005).
Munsey (1972) showed similar Wl rates for different lizard species belonging to distinct genera that occupy the same habitat and have similar activity patterns (Turk et al., 2010). Nevertheless, closely related species living in similar habitats may have different Wl rates which may be explained by differences in skin resistance to dessication (Munsey, 1972).
Lizards mostly use free-water available in the environment through drinking (Benabib and Congdon, 1992). However, in dry and arid habitats where free-water is scarce, some species persist only using the water available in food, such as ingested insects (Benabib and Congdon, 1992), although some may also drink water from condensation in their own skin (Withers, 1993).
Lizards lose water mainly through skin (Bentley and Schmidt-Nielsen, 1966; Dmi’el, 1972a; Dmi’el et al., 1997; Blamires and Christian, 1999) but also through the respiratory and the excretory tracts, and the eyes (Mautz, 1982; Blamires and Christian, 1999). Cutaneous Wl rates depend on the surface area exposed, on its resistance to Wl and on the water differential between the organism and the surrounding environment. The amount of water lost through respiration is determined by the ventilation rate and Tb (Thompson and Withers, 1998). Respiratory water loss is directly proportional to metabolic rate, assuming that the volume of expired air is saturated with water vapour (Gans et al., 1968; Munsey, 1972) and that the efficiency of oxygen extraction is constant but this may not be true in all reptiles (Dmi’el, 1972). The amount of water lost by excretion is usually not significant for most lizards because, in contrast with mammals, they excrete uric acid (solid) and not urea (soluble in water). Ocular water loss may be an important mean of water loss in the absence of barriers such as spectacled eye lids (Mautz, 1982). However, the cutaneous water loss exceeds the respiratory and ocular water loss by a factor of two or more (Schmidt-Nielsen, 1997a). This is true even for desert lizards which lose two thirds of body water through skin and only one third through the respiration.
Wl increases with increasing temperature and wind speed and decreasing barometric pressure because they cause an increase in water vapour density difference between the epidermis and the surroundings (Blamires and Christian, 1999; Gans et al., 1968). Also, humidity conditions of the environment have an important role in determining
14
rates of Wl (Blamires and Christian, 1999). In humid conditions, the difference of water vapour pressure between the epidermis and the surrounding air is smaller, and the water vapour diffusing force from the water surface into the air is correspondingly reduced (Schmidt-Nielsen, 1997a). On the contrary, if the atmosphere is dry, the water vapour density decreases in the environment so evaporation increases (Mautz, 1982).Wl rates influence Tb (Warburg, 1965) since lizards provided with more water select higher Tb (Lorenzon et al., 1999). On the contrary, water scarcity may lead to a decrease of Tb because lizards tend to spend more time in refuges. This reveals that hydric conditions of individuals may prevent reaching Tp (Grant and Dunham, 1988). Shoemaker, Licht and Dawson (1967) reported that skinks placed at an air temperature above Tp lost 25 times more water than at lower Tb. The same was observed for resting and active snakes: a difference in 13ºC caused by activity doubled total Wl (Dmi’el, 1972) revealing that activity levels also influence the rates of Wl (Gans et al., 1968). Even so, higher rates of Wl are detected in resting desert iguanas shedding skin possibly due to a temporary decrease of skin resistance to Wl (Minnich, 1971). Therefore, higher activity levels are prone to indirectly influence other organismal processes. For instance, growth rate is positively related to higher activity levels so it can be limited by water availability even if lizards are provided with food and heat (Sears & Angilletta Jr., 2003). During laboratory experiments it has been observed that individuals submitted to desiccation conditions had lower activity levels and lower growth rate. Conversely, lizard hatchlings supplemented with additional water grow faster than those with restricted access to water (Lorenzon et al., 1999). This is also verified in natural conditions: tropical lizards grow faster in the wet season rather than in the dry season (Stamps and Tanaka, 1981).
Preventing desiccation is vital for whole-organism processes and lizards have several adaptations to preserve water and prevent dehydration. They include behavioural and physiological changes such as skin resistance, uric acid excretion, production of dry faeces, salt gland excretion (Munsey, 1972) and vasomotor changes (Eynan and Dmi’el, 1993).
Behavioural strategies adopted by reptiles include: i) increasing the inactivity period which reduces the respiratory Wl during the driest months (Christian et al., 1999); ii) selecting highly humid microenvironments when they are inactive; iii) changing thermoregulatory behaviour by spending less time at high temperatures thereby reducing the cutaneous water loss (Mautz, 1982; Lorenzon et al., 1999). These strategies can be adopted simultaneously (Christian et al., 1999).
15
is related to the outer layers of epidermis, including beta (β, hard and inflexible corneous layers), mesos, alpha (α, soft-pliable corneous layers) and germinative layers (from the outside inwards) (Tu et al., 2002; Alibardi, 2003). Skin resistance is conferred by dead, keratin-filled cells inserted in a matrix of lamellar lipids and increases with increasing beta-keratin thickness and deposition of lamellar lipids in the mesos layer (Bennet and Licht, 1975; Tu et al., 2002). In fact, lipids are the main barrier to water in terrestrial life (plants, arthropods and vertebrates) (Lillywhite, 2006).
The higher resistance to Wl of reptile’s skin in comparison to other vertebrates (Bennet and Licht, 1975) has been commonly addressed to the presence of scales. Among anoles species it has been reported a correlation between scalation and habitat type: scale numbers increased with increasing precipitation and decreasing temperature (Calsbeek et al., 2006). Such trend may have its explanation on the fact that the number and size of scales influence the surface of skin exposed to the atmosphere. Although higher area of exposed skin may not be directly responsible to higher Wl rates due to keratinization of the skin, it may influence local water flux. The general pattern of scalation in desert reptiles consists on large overlapping scales while in mesic or tropical species it is usually consistent with small and granular scales with more exposed skin area (Calsbeek et al., 2006). These patterns may be correlated with ecological variables: when humidity and elevation increase while temperature decreases, scale number increase (Horton, 1972). Even so, they may instead be under maternal effect, they may be pleiotropically linked to other trait(s) under selection or due to phenotypic plasticity (Calsbeek et al., 2006). Such patterns are verified both inter- and intra-specifically although exceptions are known to exist (Sphaerodactylus; MacLean, 1985; anoles; Malhotra and Thorpe, 1991). Yet, it has been observed that scaleless snake individuals registered the same, or even lower, cutaneous water loss than normal individuals with scales (Bennet and Licht, 1975). This may reflect that reptilian scales may not be closely associated with preventing Wl. Scalation may not be a good predictor of the skin resistance to Wl also because species with similar rates of Wl have opposite scalation patterns (Dmi’el et al., 1997).
Among reptiles, phylogenetic differences concerning the efficiency of retaining water are detected. For instance, agamids are more effective than geckos which in turn are more effective than skinks (Sexton and Heatwole, 1968), colubrids also evaporate more than viperids for the same experimental temperatures (Dmi’el, 1972).
Studies on hydric physiology of reptiles are needed (simultaneously with thermal requirements) because evidence show their physiology, distribution and life-histories to be influenced by water availability (García-Muñoz et al, 2011; Carretero et al., 2012).
16
1.3 Ecological Niche Models
Modelling species’ ecological niche under a geographic context allows not only predicting the effects of climate changes on their distribution but also the expansion of potentially invasive species, the biogeographic relationships between them, the presence of hotspot areas and high diversity areas or areas adequate for reintroductions (Guisan and Zimmermann, 2000; Peterson, 2006; Sillero et al., 2009). Ecological niches of species (and not their geographic distribution; cf. Sillero; 2011, Soberón & Peterson, 2005) are inferred by Ecological Niche Models (ENMs). ENMs are based on the relation species-environment since it is known that i) abiotic conditions, ii) biotic factors like competition or prey availability (Santos et al., 2006), iii) historical processes like vicariant speciation (Busack, 1986) and isolation of species by glaciations events (Avise et al., 1998), iv) dispersal factors and v) evolutionary history, may play a preponderant role in determining the distributions of some species (Costa et al., 2008) by influencing their distribution patterns (Soberón and Peterson, 2005; Peterson, 2006). ENMs relate ecogeographical variables with the observed distribution of species.
Correlative distribution models have been the most commonly used to predict species distributions and the impacts of climate change (Kearney et al., 2010). These models predict the realized niche of a species (Guisan and Zimmermann, 2000; Pearson and Dawson, 2003) by associating spatial environmental data (slope, aspect, elevation, topographic position, habitat type, geology) with species’ abundance or presence records (presence-true absence records; presence-pseudoabsence; presence-only) to provide values of suitability for each point in space (Sillero, 2011). The realized niche model thus generated, being a subset of the fundamental niche, reflects that the species’ absence may be influenced not only by competition processes as suggested by Hutchinson (1957), but also by other biotic interactions (mutualism, predation, parasitism, symbiosis) or by dispersal limitations or historical reasons (Holt, 2009) (Fig. 3). Biotic interactions have the potential to be directly accounted for in the model by including the distribution of other species (Soberón and Peterson, 2005).
Correlative models assume distributional equilibrium (or pseudo-equilibrium) of species with the variables in the model (Monahan, 2009). Since climate changes are expected to create non-equilibrium distributions, extrapolations for changing scenarios are limited between species’ patterns and the environment (Lischke et al., 1998), although for organisms reacting slowly to environmental variability this limitation is less restrictive.
17
Fig. 3. Representation of a geographic area with the main factors limiting species distributions: abiotic (A), biotic (B) and historical or dispersal (M). Outside the area of intersection of the three factors habitat is unsuitable for species. The realized niche (RN) is the area common to A and B while the fundamental niche (PN) is located in A. Circles are species absences and pluses are species presences. Adapted from Sillero (2009).
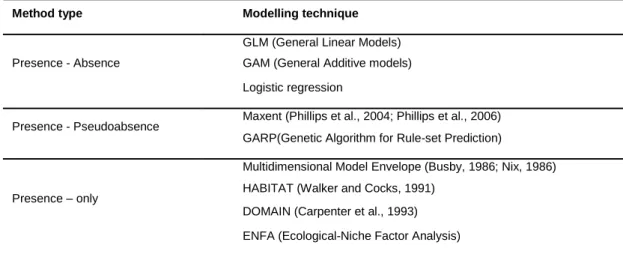
Correlative models also assume that physiological limits and indirect influences from climate remain constant over time and space and that their distributional patterns depend mostly on major climatic variables. In addition, historical factors (such as past geological or climatic events), or physical barriers, may influence the present distribution of biological entities therefore limiting this type of modelling (Araújo and Guisan, 2006). Correlative models do not clarify if a species (apparent) absence in a certain area is determined by its physiology or by extrinsic limitations (Monahan, 2009). There are three categories of correlative models depending on the type of data used: Presence-Absence, Presence-Pseudoabsence and Presence-only models (Table 1). Presence-Absence models relate the presence or the absence of a species with a set of ecogeographical variables hence inducing the suitable conditions for the presence of a species and unsuitable for its absence. Presence-Pseudoabsence models use only presence records and attribute suitable conditions to areas where a species record exists and pseudoabsence areas where no records exist (Phillips et al., 2006). Presence-only models also use only presence records and overlap them with maps of the ecogeographical variables deducing the range of conditions suitable for survival.Presence-only models may be advantageous over Presence-Absence models because the latter are prompted to introduce errors since absences may have traces of
18
biotic interactions, dispersal constraints and disturbances which may impede the accurate modelling of distributions although presence-only may also bring some inaccuracy as species may be absent from an area with suitable conditions due to past events that caused local extinctions (Elith et al., 2011).
Table 1. The three types of correlative methods according to the type of data used and most common techniques used to produce Ecological Niche-based models.
Method type Modelling technique
GLM (General Linear Models)
Presence - Absence GAM (General Additive models)
Logistic regression
Presence - Pseudoabsence Maxent (Phillips et al., 2004; Phillips et al., 2006)
GARP(Genetic Algorithm for Rule-set Prediction)
Multidimensional Model Envelope (Busby, 1986; Nix, 1986)
Presence – only HABITAT (Walker and Cocks, 1991)
DOMAIN (Carpenter et al., 1993) ENFA (Ecological-Niche Factor Analysis)
Models produced according to the type of data and software selected should be calibrated and then their performance evaluated. This is done by selecting a percentage of the data set for training (used to calibrate the model) and other for testing (to evaluate the quality of the predictions (Guisan and Zimmermann, 2000; Phillips, Anderson and Shappire, 2006). The model should be calibrated and then evaluated by crossvalidation (Van Houwelingen and Le Cessie, 1990), subsampling or bootstrap (Efron, 1979; Fielding and Bell, 1997). The crossvalidation technique randomly splits the occurrence data in equal-sized subsets which are compared in order to validate the test results. The goal is to assess if the result is replicable or just a product of arbitrary fluctuations. This technique uses all the data for validation so small data sets are better used. However, in the case of a small data set only bootstrap methods should be applied (Phillips et al., 2006). They determine the variability (accuracy) of a statistics between subsamples (Shao and Tu, 1995). Bootstrap is a Monte Carlo statistical method that takes sampling with replacement from the original sample, hence being more accurate than sampling without replacement in terms of simulating chance as it samples the impacts of the real sample size (Wintle et al., 2005). Each sample is created independently from the other samples and the number of samples is equal to the total number of presence points.
19
The importance of the variables for the prediction of the model can be assessed by Jackknife (Miller, 1974) which is a resampling method that uses subsets of the original sample to estimate the bias and standard error of a statistic. This is determined by leaving one observation out from the sample set each time it recalculates so each model is built using n-1 observations (Miller, 1974; Pearson et al., 2006).
Models thereby produced and validated can be projected to past and future climate scenarios considering also the relevance of the variables for the current distribution of species. Assessing past distribution renders further understanding on species origin and dispersal while assessing the impacts of future climate changes allows predicting how species distributions are likely to be affected, namely in terms of range decrease or expansion, or even extinctions and how such climate changes may affect their life-histories and physiology (Hijmans and Graham, 2006; Bernstein et al., 2007).
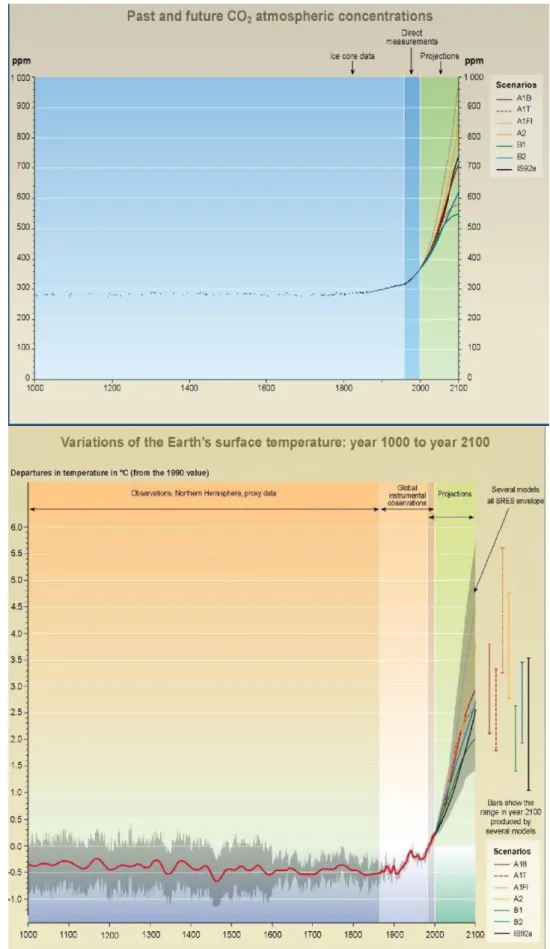
Some enterprises provide coupled atmosphere-ocean general circulation models commonly used to predict the impacts of future climate changes (CCCma, HadCM3 and CSIRO). Environmental scenarios are used to simulate global or regional climate changes although they are not real predictions (Nakicenovic et al., 2001). They are based on a series of assumptions on water-air circulation (including production of greenhouse gases and aerosol precursor emissions) but also on demographic, social, economic, technological, and environmental developments (Bernstein et al., 2007). There are four main groups of scenarios (A1, B1, A2 and B2) and each is a logical and consistent portrayal of a possible future state of the world (Fig. 4) (Bernstein et al., 2007). Within A1 group there are three groups that describe alternative directions of technological change (fossil intensive (A1FI), non-fossil energy resources (A1T) and a balance across all sources (A1B) (Bernstein et al., 2007). The A1 group describes a world with rapid human population growth until mid-century, very rapid economic growth and rapid introduction of new and more efficient technologies. The A2 scenarios reflect a very heterogeneous world with the largest population size and the slowest economic development of all scenarios along with the highest emissions of CO2 (Fig. 4A). The B1 predicts rapid changes in economic structures and the introduction of clean and resource-efficient technologies namely a smooth transition to alternative energy systems and the decline of conventional oil and gas resources being the one with lower CO2 emissions and lower temperature increase (Fig. 4A and B). B2 scenarios describe a continuously increasing population (lower than A2) and intermediate economic development but it is oriented toward environmental protection but globally the energy system remains predominantly hydrocarbon-based to 2100.
20
A
B
Fig. 4. (A) Past and future CO2 atmospheric concentrations; (B) Variations of the Earth's surface temperature: years 1000 to 2100. Adapted from IPCC, 2003.
21
1.4 Model species
Podarcis species are lacertid lizards usually found in parapatry, but sympatry or syntopy are not uncommon (Carretero, 2008).
In the north-east of Iberian Peninsula P. liolepis and P. muralis have overlapping ranges in restricted areas (Fig. 5).
Fig. 5. General distribution of P. liolepis (blue) and P. muralis (red). The two species overlap in north-eastern Iberian Peninsula. After IUCN and Renoult et al., 2010.
The two species are not sister taxa and diverged more than 10.09 Mya (Carretero, 2008; Kaliontzopoulou et al., 2011). They are morphologically and ecologically similar (Fig. 6; Diego-Rasilla, 2009; Renoult et al., 2010).
P. liolepis occurs in north-eastern Spain and some areas of southern France (Geniez and Deso, 2009; Renoult et al., 2010) in a wide variety of habitats, except those of Eurosiberian characteristics, from the sea level to 1700 m but it is most abundant in plains and open habitats. P. muralis has the widest distribution among Podarcis, ranging from eastern Iberian Peninsula to north-western Turkey (Gasc et al., 1997). P. muralis occupies a great variety of non-Mediterranean habitats in Iberia including pine, beech and fir forests, riparian woodland, meadows and crops although it can be found
22
in Mediterranean environments in the Italian Peninsula and in the Balkans (Llorente et al., 1995; Gasc et al., 1997; IUCN, 2012).
1 2 3 4
5 6 7 8
Fig. 6. Podarcis liolepis captured in Barcelona city on April 2011: males (1- dorsal surface; 2- ventral surface) and females (3 and 4). P. muralis captured in the Montseny Natural Park, North-East Iberia: males (5 and 6) and females (7 and 8). Fotos: Antigoni Kaliontzopoulou. The images are not at scale.
They are found in sympatry in the northern part of P. liolepis’ distribution in Iberia, in a restricted area in the Montseny Natural Park (Fig. 7) and in mountain areas of Navarra and coastal areas of País Vasco (Gosá, 1985, 2003; Gosá et al., 1986; Llorente et al., 1995; Diego-Rasilla, 2009).
In addition, they are in contact with other lacertid species. P. liolepis may be in contact with P. hispanica type 1a to the west and with P. hispanica type 1b to the south. In the southernmost part of the distribution, in the area around the town of Valencia, it is found in sympatry with P. hispanica sensu stricto (Renoult 2010). To the west of Valencia there are contact zones with P. hispanica type 2.
In the Pyrenees, P. muralis is in syntopy with Iberolacerta bonnali in the highest altitudinal limit and in the western Pyrennes it is in parapatry with I. aranica and I. aurelioi (Rica, 1983; Palanca et al., 1997). It is also in parapatry with P. bocagei (Galán, 1986) in the Northwest of Iberia, and with I. galani in the north of León (Delibes and Salvador, 1986).
23
Fig. 7. Map of the Montseny Natural Park with the main regions. Yellow circle - the collection site of P. muralis in April 2011 (Santa Fé); Blue circle – collection site of P. liolepis and P. muralis (sympatry area; Turó del Home).
25
Objectives
The main goal of this thesis is to understand what shapes the distribution patterns of P. liolepis (Llorente et al., 1995; Renoult et al., 2010) and P. muralis (Schulte, 2008; Diego-Rasilla, 2009) (Fig. 5). Specifically, the ecological requirements of each species are assessed by:
determining the thermal preferrence and optimal thresholds in adult individuals of the two Podarcis species;
estimating the water loss rates in adults;
testing for species interactions in terms of thermal requirements;
assessing field body temperatures in a sympatry area;
elaborating correlative models of distribution in NE Iberia;
extrapolating the models to the future;
developing a new methodology that allows determining, simultaneously, Tp and Wl.
27
Manuscript I
29
Comparing ecophysiological traits in two Podarcis Wall lizards
with overlapping ranges
Diana Carneiro1,2; Enrique García-Muñoz1,3,4; Antigoni Kaliontzopoulou1; Gustavo A. Llorente2; Miguel A. Carretero1
1
CIBIO, Centro de Investigação em Biodiversidade e Recursos Genéticos, Universidade do Porto. Campus Agrário de Vairão, 4485-661 Vairão, Portugal.
2
Dpt. Biologia Animal (Vertebrats), Facultat de Biologia, Universitat de Barcelona, Av. Diagonal 645, 08028 Barcelona, Spain
3
CESAM, Centro de Estudos de Ambiente o do Mar, Universidade de Aveiro, Campus Universitário de Santiago, 3810-193 Aveiro, Portugal
4
Departamento de Biología Animal, Biología Vegetal y Ecología, Universidad de Jaén. Campus de Las Lagunillas s/n, 23071 Jaén, Spain
Abstract
Environmental factors directly constrain the distribution of ectotherms. Most ecophysiological studies on reptiles focus on temperature but environmental humidity may also be a relevant factor. Here, we assess the ecophysiological traits of two lizard species with different but partially overlapping distributions in the Iberian Peninsula: Podarcis liolepis (Southern, Mediterranean) and P. muralis (Northern, Atlantic). Preferred body temperatures (Tp) and water loss rates (Wl) under realistic environmental conditions were measured in the lab. Tp was determined in a photothermal gradient during ten consecutive hourly intervals and Wl was measured during twelve hourly intervals inside dry sealed chambers. Also, putative thermal interactions with conspecifics and heterospecifics were tested for both species by placing two lizards in a termogradient.
Surprisingly, results revealed no differences of Tp between species or sexes. Conversely, interspecific differences in the time profiles of Wl were found. More significantly, an asymmetrical interaction was detected regarding body temperature: P. liolepis shifted Tb upwards in the presence of an inter-specific individual while Tp of P. muralis remained unchanged. Implications on species distribution patterns are discussed and the importance of hydric ecophysiology for reptilian taxa is highlighted.
31
Introduction
A species' geographic range is conditioned by both biotic and abiotic factors, once the effects of geographic barriers are excluded (Díaz et al. 1996; Gvoždík 2002; Kearney and Porter 2004). Lizards, being ectotherms, are highly constrained by abiotic conditions because they follow more closely the temporal and spatial variations of the environment, especially regarding temperature and humidity.
Body temperature (Tb) certainly has a major influence on lizard physicochemical processes (Huey 1991; Castilla et al. 1999). The highest performance of those processes is attained when the preferred body temperature (Tp) is reached. By definition, Tp is attained in the absence of thermoregulatory constraints (Van Damme, Bauwens, & Verheyen, 1990; Bauwens et al., 1995; Castilla, Van Damme, & Bauwens, 1999; Carretero, Roig, & Llorente, 2005; Carretero, 2008). In fact, when Tb comes close to Tp, performance of many physiological, biochemical and other organismal processes is enhanced (Bauwens et al., 1995; Huey and Slatkin, 1976; Van Damme, Bauwens, Castilla, and Verheyen, 1989). Nevertheless, Tp may change within the lifespan of individuals (Van Damme et al. 1986) while it is conserved within species (Van Damme et al. 1990) for individuals in the same sex, reproductive state and body condition (Carretero et al. 2005). Although studies on thermal ecology of reptiles dominate the ecophysiological literature other environmental variables may be acting. Namely, several studies suggest water constraints as important in limiting reptiles’ geographic range (Flatt et al, 2001; Packard, 1999; Packard, 1991). Particularly for the genus Podarcis ecological niche models suggest that humidity to be more relevant than temperature (Sá-Sousa, 2000; Herkt, 2007; Kaliontzopoulou et al., 2008; Carretero et al., 2010).
In addition to abiotic factors, inter-specific interaction with ecologically similar species may shape a species' distribution (Arntzen and Espregueira Themudo 2008; Costa et al. 2008). In such cases, thermal and hydric physiology may be particularly relevant, as they constitute environmental features for an ectotherm. When in sympatry, individuals may have to spend time in activities that otherwise would not be part of their daily time budget such as behavioral interactions with either conspecifics or heterospecifics. This poses extra constraints on the mechanisms of thermoregulation. In fact, the presence of another species may shift body temperatures below (or above) the optimum (García-Muñoz and Carretero submitted; Osojnik et al. 2010). For instance, the presence of another species may result in more time spent moving instead of basking preventing it from reaching a suitable Tb hence decreasing lizard’s performance. This is
32
exacerbated in high populations densities because social interactions are expected to be more frequent (Avery 1982; Diego-Rasilla and Pérez-Mellado 2000). Although studies on hydric constraints in sympatry are scarce, similar patterns may be predicted, where the presence of a heterospecific competitor may entangle the acquisition of an optimal hydric balance (see García-Muñoz et al., submitted). From a different perspective, lizards selecting high temperatures may increase their water loss rates (Wl) risking desiccation (Mautz, 1982; Bowker, 1993). Hence, if water availability is restricted, a trade-off between Tp and Wl may be predicted. Because of that, restrictions in water availability may lead to changes in activity patterns which may cause changes in body temperature, binding together both physiological traits (Andrews, 1982; Adolph and Porter, 1993; Lorenzon et al., 1999).
The congeneric lacertids Podarcis muralis and P. liolepis provide a good model system to study how species coexistence influences thermal and hydric requirements, because a) their geographical ranges overlap; b) they are phylogenetically related although not sister taxa (Harris and Arnold 1999) and roughly similar morphologically and ecologically. P. muralis is widespread across Europe but restricted in Iberia, while P. liolepis is abundant but restricted to NE Iberia and Southern France). Both can be sympatric and syntopic. P. liolepis is a member of the Iberian and North-African clade of the genus Podarcis, while P. muralis is thought to belong to the Italian clade (Harris and Arnold 1999).
There are indications that the two species occupy different habitats in terms of temperature and water availability (Gosá 1985; Llorente et al. 1995). This suggests that both species may diverge in their physiological traits, which has not been assessed yet. In this study we aim at 1) assessing intraspecific (sex and time) and interspecific variation in Tp; 2) determining water loss rates (Wl) and their temporal variation for both species and sexes; 3) testing for the existence of a trade-off between Tp and Wl; and 4) experimentally evaluating whether intra- and interspecific thermal interaction may affect Tps.
Material and Methods
Study area and sample size
Only adult individuals were used in all the experiments (minimum adult snout-vent lengths, SVL, 46mm for P. muralis, Diego-Rasilla, 2009; 38mm for P. liolepis,
33
Carretero, Llorente, 1993; Kaliontzopoulou, et al., 2006). Twenty one P. liolepis (9 males and 12 females) were collected in a site (Palau Reial, 41°23’15’’N 2°07’04’’E; 76 m altitude) within Barcelona (NE Spain) dominated by Pinus pinea, Pinus halepensis, Cedrus deodara and Cupressus sempervirens. Fifteen P. muralis (7 males and 8 females) were collected from Santa Fé del Montseny (Montseny Natural Park, NE Iberia, 41°46′26″N 2°27′43″E; 1136 m) dominated by Quercus ilex and Fagus sylvatica forests.
All specimens were captured by noose (García-Muñoz and Sillero 2010) in April 2011 and transported to the facilities of the University of Barcelona, where they were kept in 20 x 10 x 15cm individual terraria under natural light conditions. Food (Achaeta domestica and larval Tenebrio molitor) and water were provided ad libitum while lizards were not involved in experiments. In accordance with the phenology of both species in the region (Rivera et al., 2011), all females appeared to be pregnant after observing the belly size, copulation marks and conducting an egg palpation (Arnold 2004).
For each lizard, we measured SVL to the nearest 0.01 mm using digital calipers. Lizards were first subjected to an experiment to characterize preferred temperature, followed by an experiment to quantify water loss in the following day. No food or water were provided during and in-between both experiments. Male lizards were still allowed to recover from previous experiments for nine days, providing them food and water ad libitum, and then underwent interaction experiments. Only lizards with unbroken or fully regenerated tails were used. When accidental autotomy occurred during the experiments, subsequent Tp and Wl measurements were excluded from the analyses since tail loss may interfere with thermoregulation and rate of water loss since it causes changes in the shape and the surface area exposed (Chapple and Swain 2004).
Thermal gradient experiment
Lizards of both species were individually exposed to a thermal gradient (ranging between 25 and 450C) produced by a 150-W infra-red reflector bulb fixed 25 cm above the substrate in the extreme of a 100 x 40 x 30 cm terrarium. Experimental procedures followed Carretero et al. (2006). The natural photoperiod was maintained by exposing the terraria to external light. The preferred body temperature (Tp) within the gradient (Bauwens et al., 1995) was recorded during a single day at ten consecutive hourly intervals distributed throughout the period of daily activity observed in the field (7-16 h, solar time). The bulb was switched on one hour in advance (6h, solar time) in order to
34
avoid outliers created by the early-morning warm-up (Bauwens et al., 1995). Body temperature was recorded using a digital k-termocouple thermometer HIBOK® 18 (precision 0.1 ºC) by inserting a probe of 1.5 mm in the cloaca. No more than 10 seconds elapsed between the capture of the animal from the terrarium and the measurement of body temperature, to minimize lizard stress and manipulation time in recorded Tps. Even if some disturbance is produced during this procedure, effects are much smaller than the measurement bias of alternative methods like infrared thermometers (Carretero 2012).
Water loss experiment
This experiment was conducted in sealed chambers (40x30x20cm) at ~240C and ~35% relative humidity created by 100g of silica gel on the bottom side of the lid. Temperature and humidity inside this chamber were monitored using a Fluke®-971 hygrothermometer to the nearest 0.1ºC and 0.1%, respectively. Each individual was introduced in a sealed chamber with a false bottom with five grams of silica gel. Water loss (Wl) was quantified by weighing the individuals (inside the individual plastic box in order to avoid stress during handling) using a digital balance (precision 0.0001g) each hour for 12 consecutive hours, overlapping with the activity time of the lizards (see above). The weight difference observed between measurement intervals and water loss rates directly reflect the amount of cutaneous, pulmonary and ocular water loss. Although defecation and urination have a relatively low contribution to total water loss (Munsey 1972), these products were not removed from the individual plastic box during the experimental process.
Interaction experiments
This consisted of a variant of the thermal gradient experiment conducted by monitoring, simultaneously, two adult males thermorregulating in the same thermal gradient terrarium, to determine the Tb they selected. To minimize the possible effects of body size or mass, pairs of males with similar SVL and mass were placed together.
Two different tests were performed: intra- and interspecific interaction plus the control tests provided by the standard thermal gradient experiment conducted before. The following combinations of male couples were set: five P. muralis/P. muralis and five P.
35
liolepis/P. liolepis intra-specific experiments as well as ten combinations for the inter-specific experiments (P. muralis/P. liolepis).
Statistical analyses
All data were log-transformed to meet the assumptions of normality, homoscedasticity and sphericity as confirmed through Shapiro-Wilk’s test (P>0.05 in all cases), multivariate Box M and univariate Levene’s tests (P>0.05 in most cases), and Mauchley's tests (P>0.05 in all cases), respectively.
To test whether significant variation in selected temperatures existed between the studied species and sexes, while also examining temporal variation throughout the day, we performed Repeated Measures ANOVAs (ANOVAR) with sex and species as between-subject factors and time interval as within-subject factor. To investigate if there were statistical differences along time and between species and sexes concerning the amount of Wl, ANOVAR were performed for instantaneous Wl (relative to initial weight, W0; (Wl=(Wn-Wn+1)/W0)) using sex and species as between-subject factors and time interval as a within-subject factor. ANOVAs for each time interval of cumulative Wl, (Wl= (W0-Wn)/W0) were performed to determine putative differences between species and sexes (between-subject factors). We examined both descriptors because instantaneous Wl captures the amount of Wl in each time interval, while cumulative Wl provides a quantitative measure of the rate at which individuals lose water.
The possible trade-off between Tp and Wl was investigated through correlations between Mean Tp and total Wl (calculated as Wl=(W0-W12)/W0) for each sex by species group separately.
In order to investigate whether interaction between intra- or inter-specific individuals may lead to a selection of Tb different from Tp, ANOVARs were performed using species and test (with classes “alone”, “intraspecific” and “interspecific”) as the between-subject factors and time as the within-subject factor. ANCOVAs using SVL, initial weight (W0) and SVL and W0 as covariates were also employed for the three experiments to test whether size and shape had an influence on the two ecophysiological characteristics. Duncan post-hoc tests were used for multiple comparisons between species and sexes for each experiment.
Statistica 7.1 (StatSoft 2005) was used to perform all analyses. Significance was evaluated at a-value of 0.05.
36
Results
ANOVA revealed significant sexual dimorphism in SVL in both species, with opposite patterns between species; P. liolepis males were longer than females while the opposite was observed for P. muralis. Males and females of P. muralis also differed in initial weight, females being heavier (Appendix 1). Males of both species only differed in SVL while females also differed in W0 (Duncan post-hoc test p<0.05 for all significant differences). ANCOVA performed on W0 with sex and species as within-subject factor and SVL as covariate revealed that P. muralis is relatively heavier than P. liolepis (F1,29= 32.54; p=4*10-6).
Preferred temperature
Overall Tp of P. liolepis females was 31.22±0.32ºC while P. liolepis males selected 31.97±0.51ºC. Mean Tp of P. muralis females was 31.28±0.26ºC and mean Tp of P. muralis males was 31.76±0.17ºC (Fig. 1).
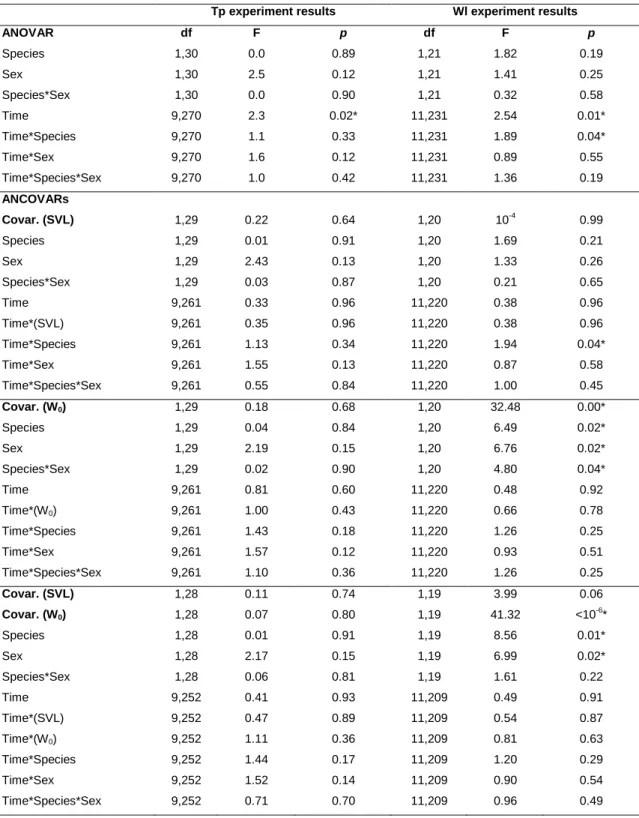
ANOVAR revealed statistical differences along time intervals but not between sexes or species (Table 1). Subsequent ANCOVAR using W0 and SVL as covariates did not reveal any statistical difference either between species or sexes (Table 1). No significant interactions were detected.
Water loss
ANOVAR showed statistical significance for time and time*species, indicating that species have different Wl patterns along time, even when variation due to SVL is taken into account (Table 1). By contrast, using W0 as the covariate rendered the time*species effect non-significant, but species, sex and species*sex presented a statistically significant effect on Wl, indicating that sexes of each species lose water differently. When using both SVL and W0 as covariates, sex and species were the only significant effects indicating differences in the patterns of Wl only between species and sexes.
Duncan post-hoc tests between species and sexes using W0 as the covariate only revealed significant differences between P. muralis females and P. liolepis males (p=0.02). When no covariates were considered, no statistical differences were found.
37 Females Males 8 9 10 11 12 13 14 15 16 17 Solar time 27 28 29 30 31 32 33 34 35 T p ( ºC ) 8 9 10 11 12 13 14 15 16 17 Solar time 27 28 29 30 31 32 33 34 35 T p ( ºC ) 8 9 10 11 12 13 14 15 16 17 Solar time 27 28 29 30 31 32 33 34 35 T p (º C) 8 9 10 11 12 13 14 15 16 17 Solar time 27 28 29 30 31 32 33 34 35 T p ( ºC )
Fig. 1. Daily Tp variation pattern of females and males of P. liolepis (top, continuous line) and P. muralis (bottom, dashed line). Whiskers represent ± 0.95 confidence intervals.
Examination of the daily patterns of Wl (Fig. 2) revealed that P. liolepis males lost more water after the 3-4 time interval while P. muralis only started losing more after the second half of the experiment (6-7 time interval). Differences in cumulated Wl between species were detected in the last three hours of the experiment once corrected for SVL and W0 (Appendix 2).
Tp vs. water loss
No significant correlation between mean Tp and total Wl was detected for any sex and species revealing no trade-off between both variables (P. liolepis males: r2 = 0.0376; p = 0.6171; P. liolepis females: r2 = 0.0194; p = 0.7009; P. muralis males: r2 = 0.0614; p = 0.5922; P. muralis females: r2 = 0.0009; p = 0.9423).
38
Table 1. ANOVA and ANCOVAs results of Tp and instantaneous Wl data using SVL, W0 or both W0 and SVL as
covariates. Significant effects are marked with an asterisk (*). Data are -transformed.
Tp experiment results Wl experiment results
ANOVAR df F p df F p Species 1,30 0.0 0.89 1,21 1.82 0.19 Sex 1,30 2.5 0.12 1,21 1.41 0.25 Species*Sex 1,30 0.0 0.90 1,21 0.32 0.58 Time 9,270 2.3 0.02* 11,231 2.54 0.01* Time*Species 9,270 1.1 0.33 11,231 1.89 0.04* Time*Sex 9,270 1.6 0.12 11,231 0.89 0.55 Time*Species*Sex 9,270 1.0 0.42 11,231 1.36 0.19 ANCOVARs Covar. (SVL) 1,29 0.22 0.64 1,20 10-4 0.99 Species 1,29 0.01 0.91 1,20 1.69 0.21 Sex 1,29 2.43 0.13 1,20 1.33 0.26 Species*Sex 1,29 0.03 0.87 1,20 0.21 0.65 Time 9,261 0.33 0.96 11,220 0.38 0.96 Time*(SVL) 9,261 0.35 0.96 11,220 0.38 0.96 Time*Species 9,261 1.13 0.34 11,220 1.94 0.04* Time*Sex 9,261 1.55 0.13 11,220 0.87 0.58 Time*Species*Sex 9,261 0.55 0.84 11,220 1.00 0.45 Covar. (W0) 1,29 0.18 0.68 1,20 32.48 0.00* Species 1,29 0.04 0.84 1,20 6.49 0.02* Sex 1,29 2.19 0.15 1,20 6.76 0.02* Species*Sex 1,29 0.02 0.90 1,20 4.80 0.04* Time 9,261 0.81 0.60 11,220 0.48 0.92 Time*(W0) 9,261 1.00 0.43 11,220 0.66 0.78 Time*Species 9,261 1.43 0.18 11,220 1.26 0.25 Time*Sex 9,261 1.57 0.12 11,220 0.93 0.51 Time*Species*Sex 9,261 1.10 0.36 11,220 1.26 0.25 Covar. (SVL) 1,28 0.11 0.74 1,19 3.99 0.06 Covar. (W0) 1,28 0.07 0.80 1,19 41.32 <10-6* Species 1,28 0.01 0.91 1,19 8.56 0.01* Sex 1,28 2.17 0.15 1,19 6.99 0.02* Species*Sex 1,28 0.06 0.81 1,19 1.61 0.22 Time 9,252 0.41 0.93 11,209 0.49 0.91 Time*(SVL) 9,252 0.47 0.89 11,209 0.54 0.87 Time*(W0) 9,252 1.11 0.36 11,209 0.81 0.63 Time*Species 9,252 1.44 0.17 11,209 1.20 0.29 Time*Sex 9,252 1.52 0.14 11,209 0.90 0.54 Time*Species*Sex 9,252 0.71 0.70 11,209 0.96 0.49
39 Females 0-1 1-2 2-3 3-4 4-5 5-6 6-7 7-8 8-9 9-10 10-11 11-12 Time (hours) -0.001 0.000 0.001 0.002 0.003 0.004 0.005 0.006 W l=(W n -W n+ 1 )/ W 0 Males 0-1 1-2 2-3 3-4 4-5 5-6 6-7 7-8 8-9 9-10 10-11 11-12 Time (hours)
Fig. 2. Variation patterns of instantaneous water loss of females and males of P. liolepis (full line) and P.
muralis (dashed line) during 12h in sealed chambers.
Interaction experiments
When alone in the thermogradient males of both species selected similar Tb (Table 2) which differed by 0.21±0.34 ºC. The same was true for the intra-specific test in which species’ Tb differed 0.98±0.23ºC (Appendix 3).
Test type, species and time had a significant effect on Tp of lizards sharing the same terrarium (Appendix 3). When introducing SVL as a covariate, the species*test interaction remained significant. When using W0 as covariate, only species and test remained significant (Appendix 3). Finally, when the ten Tb measurements taken along the day were averaged by individual, not only species and test, but also the interaction between them, were significant (Fig. 3).
Duncan post-hoc tests after the ANCOVA using W0 as covariate, showed significant differences for P. liolepis between alone and interspecific (p=0.002) tests. Also, the results obtained for P. liolepis when alone in the thermogradient were statistically different from those of P. muralis in the alone experiment (p=0.003), in the interspecific (p=0.008) and intraspecific (p=0.003) experiments. No differences were found among tests of P. muralis (p>0.05). Essentially, the Tbs of P. muralis remained similar in the three experiments while P. liolepis selected higher Tp in intra- and interspecific experiments (32.87±0.25ºC and 33.69±0.23, respectively).
40
Fig. 3. Preferred body temperatures of Podarcis liolepis (full line) and P. muralis (dashed line) in three experiments: Alone- one individual per termogradient; Interspecific- one individual of each species per termogradient; Intraspecific- two individuals of the same species per termogradient (Post-hoc Duncan test; ns, p> 0.05; * p< 0.01).
Discussion
The results obtained here confirm previous findings on the variation of Tp in lacertid lizards. Most importantly, they provide new insights concerning water ecology and highlight the interactive nature of physiological traits. Namely, this work provides experimental evidence that asymmetric interactions between and within both species have an influence on their thermal ecology. Both aspects have important implications, not only for determining the life history mechanisms and demonstrating competitive interactions, but also for elucidating the biogeographical patterns of these lacertid species.
Concerning thermal physiology, both species select similar Tps. Since P. muralis and P. liolepis are quite divergent phylogenetically, belonging to different clades within the genus Podarcis (Harris and Arnold, 1999; Harris et al., 2005) and since phylogenetically intermediate Podarcis forms display different Tp (Veríssimo and
Alone Interpecific Intraspecific