http://iraj.in
PLANNING PROCESS FOR AN OPERATIONAL MANAGEMENT
PLATFORM FOR A PUBLIC TRANSPORT
1
JOAO C. FERREIRA, 2ANTONIO MARCELO, 3VITOR BASTO-FERNANDES,
4
ANA LUCIA MARTINS
1
Instituto Universitário de Lisboa (ISCTE-IUL), 2Tecmic,3BRU-IUL,4ISTAR-IUL E-mail: [email protected],[email protected],[email protected],[email protected]
Abstract - This work addresses the planning process of a public passenger transport operator, including the generation of
schedules and services for vehicles and drivers, in the framework of a previously agreed service. This problem will be studied in the context of all stages of the planning process: parameterization, preparation, production of performance indicators and the generation of results for different operational scenarios.
Index Terms - Planning, Public Transportation, Schedules, Vehicles, Drivers. I. INTRODUCTION
The high complexity and sophistication of today’s public transportation networks enables the daily commuting of millions of people living in the metropolises of the world. In this work we analyze the process and requisites towards a better planning assisted by a specific software. This planning supports public transportation creation of bus route and schedules. The proposal cangenerate in an optimized way:
The schedules of public transportation lines: in the way they are presented to the public (and that support all the operational activity), according to the specifications, objectives and criteria defined for the exploration scenario, guaranteeing the quality of service rendered to the public and / or agreed with the supervisory bodies;
The Services to be allocated to buses (or other vehicles), ensuring that the trips to be carried out comply with the respective schedules in the most efficient way possible, paying attention to the means available, their characteristics and the criteria to define their operability;
The Services to be allocated to drivers, similar situation to Services to be allocated to buses, but from the point of view of the service to be fulfilled by the human resources, i.e. the daily work shifts of the drivers, considering criteria of cost optimization, but also a set of labor rules, not only imposed by the applicable legislation, but also those agreed with the workers.
Rather than focusing on the algorithm associated with optimization models, this work aims to analyze all stages of the process: pre-planning (parameterization), planning, generating results (planning proposals) for different scenarios, generation of metrics / metrics evaluation of results and operationalization of a new planning.
Public transportation depends on the behavior of the passengers who want to travel in the public transportation network (PTN), available bus and bus drivers. Thus, integrating passenger data in public
transportation models in a realistic way is crucial. Classical approaches [1, 2, 3, 4] in line planning assume a basic two-step procedure: in a first step, the passengers are routed in the PTN using traffic assignment procedures. In a second step, this distribution is used for the planning of lines, timetables, and so forth. We propose a new process with six phases assisted by a dedicated developed software
II. RELATED CONCEPTS AND WORK
For a correct approach to the problem, a set of basic concepts is defined considering the structure of the network and the calendar. For all management and analysis to be done, it is necessary that the whole system be based on an information structure (basic data) that is managed by the transport operator. This structure defines all the variables of time and space,needed for the generation of schedules and services for each vehicle and driver.
The structure that defines the public transport network is constituted by the following entities: 1) Stops: they correspond to the minimum unit of the transport network of any operator. For the correct modeling of the whole network, it is necessary to have accurate information of each stop, namely the coordinates of its location; 2) Sections: sequences of stops that will later give rise to the definition of the routes of the lines, each section (Figure 1) has specific definitions of distance and time of travel between each stop and is based on the principle of reuse(several lines use the same route and the same stops between two places). The size of the section can range from the simple connection between two stops (a single segment) to the connection of N stops (several segments).3) Time Variants: defined intervals throughout the day, with typical values of travel times and stops; 4) Courses: consisting of sections, which together and in sequence, will define a complete course; and 5) Lines: or careers, as they are sometimes called, is the most important structure, since besides being the unit of regulation of the system operators (which aim to guarantee high
http://iraj.in regularity and / or punctuality indexes for each line), corresponds to a concept familiarto passengers. Each line corresponds to one or several routes, typically two: ascending direction and descending direction, which are known to the public and to which a schedule is associated.
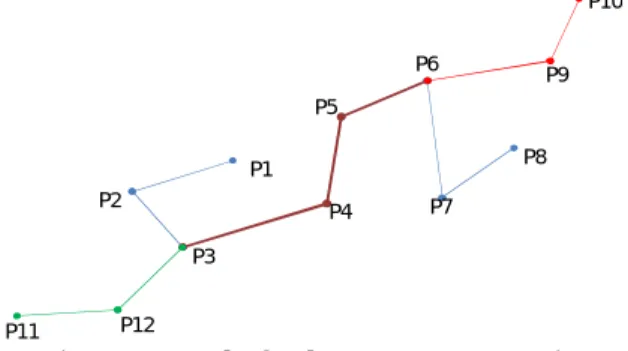
Figure 1 - Example of a Three Row Common Section
If we start from the stops, we can define each line by the following sequences: 1) Line 1: P1 / P2 / P3 / P4 / P5 / P6 / P7 / P8; 2) Line 2: P11 / P12 / P3 / P4 / P5 / P6; 3) Line 3: P3 / P4 / P5 / P6 / P9 / P10. Looking at the Figure 1 we can easily group the stops in the following sections: 1) Section A: P1 / P2 / P3; 2) Section B: P3 / P4 / P5 / P6; 3) Section C: P6 / P7 / P8; 4) Section D: P11 / P12 / P3; and 5) Section E: P6 / P9 / P10. Using this intermediate structure (the section), we can redefine the lines, depending on the sections that compose them: 1) Line 1: A / B / C; 2) Line 2: D / B; and 3) Line 3: B / E. That is, section B groups a sequence of stops that is common to several lines. Thus, any change that is necessary in this way and due to real events (reconstruction works, changes in traffic rules, other events) will only have to be introduced in this structure, affecting all the lines that depend on it.
A. Calendar
All parametrizations, involving time, gain more degrees of freedom since the calendar is defined based on the following variables: 1) Type of Day: the definition of type of days allows to handle course times, services or bus stop times to be dealt with differently depending on whether it is a working day or a Saturday, for example. Together with the times, the type of days allows the system to automatically model its behavior to the supply variations.Time variants are one level below the type of day, they define time slots within each day to distinguish different patterns of travel time and stopping (e.g. morning trip, day body, late afternoon, night, etc); 2) Time: corresponds to an extended period (an interval of days, weeks or months) in which the schedules present a similar typology. For example, school or non-school time. Coupled with the concept of the type of day, it allows each service to assume the behavior adjusted to the day, automatically; and 3) Calendar (Annual): Possibility to determine behavior for a given day - regardless of its type and season. That is, to force the distinct behavior for a given day (Figure 2), even if it is not its default behavior (carnival day is a good example).
B. Hours and Services
The concept of Time is very easy to explain to any user of public transport, these are tables containing the starting times of each vehicle in each of the terminals (typically two terminals, one for each direction of traffic), organized by line and usually divided into their separate versions for each time of year and type of day.
In summary, the timetable represents the passenger's view of the departures of a particular line, divided into its various "versions" according to Season and Type of Day - for reasons of simplicity of reading, the partial times of passage / route between the various stops are presented to the public in summary form, usually only with a default value, that is, not discriminating the variants of time.
The Service represents the vision of each vehicle or of each driver. It defines, for each day of the year, what a vehicle or a driver must do, that is, list a set of trips, ordered chronologically by vehicle or driver.A trip corresponds to the execution of a route referring to a certain line, starting at a certain time and with a place of origin and destination, because a trip may correspond to a single segment of the route and not to the complete route of one line.
Figure2 – Season map / standards days III. PLANNING PROCESS
We intend to provide the users of the platform - operators of a control center of a passenger transport operator, a new planning tool with the ability to optimally plan: the schedules of the lines, the structuring of the services and their schedules, as well how to support the assignment of vehicles and drivers to their services, see Figure 3 and 4.
Figure 3: Planning phase process: (A) timetable, schedules available for costumers; (B) services based on buses available
and (C) drivers working periods.
Since we developed a multi-variable optimization [5], we use as input: 1) timetable; 2) service; and 3) drivers working periods:
Timetable: the concept of timetable is very easy to
explain to any public transport user, they are tables containing the starting times of each vehicle in each of
P1 P2 P3 P4 P5 P6 P7 P8 P9 P10 P11 P12
http://iraj.in the terminals (typically two terminals, one for each direction of movement), organized per line and are usually divided into separate versions for each type of day and time of year.
Service: represents the vision of each vehicle (service
of vehicle sometimes called "plate") or of each driver (driver service sometimes called "plate"). Defines what a vehicle or a driver has to do over a day, that is, lists a set of trips, ordered chronologically that a certain means has to perform, being that: 1) A service may have different versions for each season; 2)Within the same service, we may have trips of one or more lines; 3) The service may not be continuous, that is, we may have one or more intervals between trips where the vehicle or the driver leaves the service.
Drivers working periods, we have the following concepts:
1) Block: A set of consecutive journeys (between each start and end of service) of a driver service, a service may have several blocks during the day, i.e. the vehicle or the driver can enter (enter) and exit (end) the several times during its execution. The intervals between blocks are called Pauses;
2) Step: represents, for a driver service, what the block
represents for the vehicle service, i.e. a consecutive period of work (travel);
3) Travel: Execution of a route referring to a certain
line, in a certain direction, starting at a certain time and with an origin and destination - this is because a trip can correspond to the execution of a single segment of the route and not to the entire route.
We can divide the planning process into six major phases: 1) parameterization; 2) scenario definition; 3) solution generation for planning; 4) solution analysis; 5) activation of a solution; and 6) operational planning (which represents the bridge to the operational process).
Figure4 - Screen with the main menus of the lanning module (in Portuguese)
A. Phase 1 - Parameterization (F1)
The first phase, is generic and transversal to any scenario, it is where we define a set of parameters that do not have specifically to do with the intended planning solution, but with the reality of operation and the definition of the means that public transport operator has available - are definitions shared by the various planning scenarios, their adjustment does not depend directly on the defined scenarios (times, regularities, etc.).In summary, they are parameterized:F1.1 - Global parameters of operation;
F1.2 - Global characteristics / attributes of the means (vehicles and drivers).
Parameters Relative to the Type of Means (Vehicles and Drivers) are: 1) Parameters related to availability and autonomy; 2) Parameters related to maintenance; 3) Parameters related to the place where it "rests" (collection station); 4) Parameters related to its cost; and 5) Parameters related to working / rest time. These parameters were defined by the transportation operator.
Parameters related with driver types settings: 1) driver name; 2) cost hour cost of each hour of work; 3) night work cost; 4) cost extra time, cost of each extra hour of work; 5) maximum turn duration, maximum daily working time; 6) daily step change, maximum number of steps you can take each day; 7) max. duration of the phase, maximum duration of a consecutive period of work; 8) max. time after step, maximum work time after finishing each step; 9) max. extra hours per day, maximum time that you can do extra work per day; 10) min. rest between stages, minimum rest time between stages; and 11) min. break between shifts, minimum rest time between shifts.
Parameters related with vehicle are: 1) vehicle type name; 2) daily cost, daily cost of the vehicle even when not doing service; 3) cost per km, cost of vehicle per km; 4) lines where this type of vehicle can operate; 4) maximum work per day, maximum operating time per day (outside the garage); and 5) maximum time between maintenance, maximum time between two maintenances, i.e. after maintenance, the vehicle has a maximum time to perform other maintenance. A collection or depot station is a parking place where the vehicles remain during the time they are not in service, where they are maintained and cleaned.
B. Phase 2 - Scenario Definition (F2)
In the second phase, we define and prepare the scenario. In summary, in each scenario, the following are defined:
F2.1 - The service we want to provide to passengers,
defines the regularity and punctuality of the lines for each type of day, within the defined time frame (season);
F2.2 - The Objectives and Calibrations that we want to
achieve and the restrictions we want to impose in the generation of the planning solution, namely the level of availability of means and calibrations (weights) intended.
In the definition of the scenario, we calibrate variables that define a situation and a set of objectives that the operator intends for the planning solution.
The scenario contains: 1) The requirements for defining the punctuality and regularity of the lines -
http://iraj.in this is the approach chosen, so that it is easier to arrive at the schedules based on the needs of the passengers; 2) The means involved (by type); 3) A set of global parameters (transversal to all means) that define the solution in the most general aspects / objectives; 4) A set of fundamental criteria and weights to calibrate the solution generation algorithm, such as: the weight to penalize line changes (important to prevent a vehicle from "jumping" between lines - -even if it is more cost-efficient it may not make sense in terms of managing the operation); 5) Weight to penalize stopping or non-use times (park); 6) the Criteria for Penalizing Empty Travel; 7) Weight to penalize overtime or night time. The key idea of a scenario is to allow the operator to idealize the schedules that you want to create for a given time. This concept brings together a particular problem and its solution or solutions.
Planning involved also the number of trips that are intended to be made in a given period, building a set of trips (service) that each vehicle can perform in the normal process of going back and forth. Therefore, the operator defines what he wants, in terms of supply, for each line:
Regularity - Intervals (time bands) that define
different demand requirements, such as: 1) The desired frequency (ies) of departure for each line terminal, within each time slot; 2) Each terminal (beginning of each of the traffic directions) has, according to the time of day, very different needs in terms of number of passengers; 3) Always identify "reinforcements" in certain sections of the line; and 4) we create a new specific time slot for a segment that corresponds to the execution of part of the complete route of the line (shortened trips).
Punctuality- Identify fixed times for trips where,
regardless of the stipulated frequencies, we want a vehicle to fulfill a trip (extra regularity trips). This parameterization can be made in the perspective of the departure (start time of the trip) or in the perspective of arrival (arrival time at the end stop of a trip). It is Identified points of connection or synchronism, in this case we identify the need to pass at a certain point (route stop) at a given time. This restriction, which can generate extra trips, is mainly used to synchronize trips and allows connections between lines (minimize transshipment times) or even to connect to other external operators (for example a ferry boat that we know beforehand leaves many passengers at a certain time);
We can go from a very complex situation, with several periods and frequencies, to a single "super" line - a single frequency that encompasses the operation of the day (e.g., from 04:00 to 03:00 the next day with departures every 10 minutes). It is still possible to define the regularity of departures in minutes or in total of departures in the defined period, however, the use of one suggests the automatic updating of the other. In addition to the frequencies, the operator can parameterize in a very simple way the extra trips,
setting a time of departure or arrival, or the identification of the synchronization points, in this case, at the level of the user interface, an equivalent signaling (but distinct) to a trip, but that may not result in the need to introduce yet another trip.
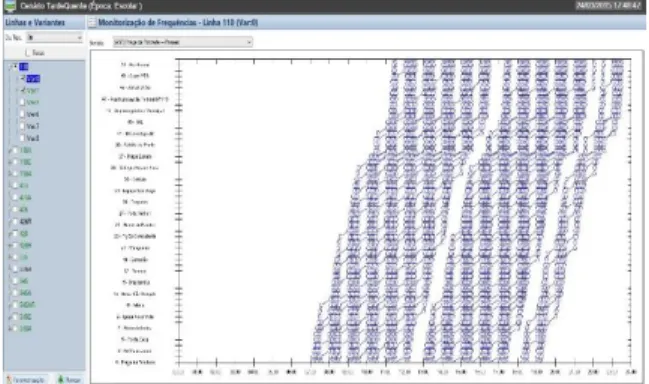
Viewing / Monitoring a Scenario - After creating or
opening an existing scenario the operator has access to all existing rows. By choosing a line / variant, we can visualize its frequencies, extra trips and sync points. A widely used form of representation in this public transport reality - the travel diagram - was chosen.As shown in Figure 5, we represent a day (type) of exploration where, for each line, we represent all predicted trips, identifying: 1) the desired Start Time; 2)the origin and destination of each trip; and 3) Estimation of the duration of each trip - the operator also has the list of stops on the y-axis and the time-space on the x-axis, if the user moves with the mouse at the points of travel, the stop-over time is indicated.
Scenario Preparation - Goal Setting and Calibration.
After parameterizing the scenario to the level of punctuality and regularity of the lines, we must carry out the "calibration" of the planning solution. These configurations can have a significant impact on the results generated, both in the amount of media to be considered in the solution and in the calibration of weights and restrictions to be considered.
In this phase we essentially define:"Scope" of the Solution: Although we are usually planning for the whole universe of the operation, the planning solution may have a narrower scope, that is, we can only plan for one type of day or we may want to plan for a restricted group of lines.
Usually this type of partial solution only happens in an operational reality where the operator does not intend to "mix" means between the several lines. In the background we are talking about an operator that has a group of means allocated to a specific set of lines - in this case we will have solutions with a degradation of the optimization of the means (considering the global reality of the operation) but, eventually, with an easier management to perform from an operational point of view.
Figure 5 – Screen shot of visualization scenario
Sometimes this situation occurs in state or municipal companies where it is often assumed that each vehicle does not change lines during a service.Potentially this type of solution tends to benefit the regularities of the
http://iraj.in operation (less tendency to deviate from the plan) and, on the other hand to degrade the level of use of resources throughout the day.
Model Result: This is a particularly relevant aspect in
this approach, since it allows planning to be done as a reference, very useful for replanning, which is one of the concerns and differentiating factors of this work. Remember, in each solution we will get the three results for the scenario defined: 1) Schedules - Definition of public timetables; 2) Services for Cars - Daily services for the vehicles; and 3) Services for Drivers - Daily services for drivers.
For each of these solution components, the solution generating module, starting from the attribute base and scenario definition, will be responsible for generating each of the solution portions (although they are generated in sequence, they are not naturally independent). The goal is to reach a final result with these three components, each of them has value in itself. For this reason, the module has been prepared to generate results at several levels: 1) Only with schedules; 2) With the daily schedules and services for the vehicles; 3) Starting from fixed hours ("lock" this component) and generate only the daily services; and 4) Total, with daily schedules and services for vehicles and drivers.
This aspect of generating results from a base (solution already elaborated) is fundamental to carry out a new planning (replanning), without changing the schedules already made available to the public. We will have the possibility to start from Fixed Schedules ("lock" this component already generated), i.e. not considering the objectives for the frequencies, which have already been reflected in the model solution, and generate a new solution for daily services of vehicles and drivers.
Amount of Means: here we define the amount of
means (vehicles and drivers) that we use in planning.By default the module presents all means defined in the system, but there is always the possibility of only using a percentage of the existing means.
Solution Calibration: We give the operator the
ability to calibrate some constraints that, together with all of the attributes already described, try to shape the intended planning solution. This type of calibration always has a subjective component or a sometimes-non-linear relationship with the results. It is therefore difficult to quantify these values, which is why they are presented in a slide bar format,allowing the operator to refine the conjugationof the various weights according to the experience that is acquiring. The most relevant "weights" are:
Penalize Line Changes: it is the degree of freedom with which we allow the vehicle to change lines within the same service. As already mentioned, when this change is allowed to happen in a more dynamic way, we will potentially be able
to optimize the occupation of the means to the objectives of the operation, on the contrary, if we restrict this dynamism we will benefit the regularity of the operation (less tendency to deviate from the plan);
Penalize the Distances traveled in Empty
Travel: in practice, we mean the attempt to use
means that are close to the beginning (first trip) terminals of each service. This situation is of particular interest when the means belongs to separate collection stations and, even with some availability advantage, may be at a disadvantage because they are further from the start terminal. When we have several stations, this calibration may tend to limit the use of means in areas distant from its collection station;
Preference for Minimizing the Number of
Vehicles Used: give priority to reducing the
number of vehicles to be used, even if less than the vehicles indicated as available for planning (input). Of course, we will always try to reduce the means to be used, here it is a question of giving preference to this aspect, to the detriment of fulfilling other objectives (e.g. total cost of the solution or total distance covered).
Often in order to "make feasible" a solution we arrive at a result that does not meet all the defined restrictions, in particular with respect to the working restrictions of the drivers that are more "difficult" to fulfill completely. The following calibrations attempt to identify the degree of default (possible) aspects that are typically decisive, particularly in terms of driver services and the number of means to be used: 1) Penalize Long Pauses: interval (rest) between stages; 2) Penalize Waiting Times in Terminus: valid for both types of service, we are talking about time between trips during the execution of a service block; 3) Penalize Number of Driving Steps: exceed the maximum number of steps of a driver during his daily service; 4) Night Driving Excess Time penalty: the night sometimes requires the generation of more services (even if smaller); 5) Penalty for the Use of Extra Hours: it must be analyzed together with the following parameter (for example, it can often compensate for using one more driver); 6) Penalty for Using Means beyond the Limit: as a result of the above, in order to try to reach a solution we may have to use more means than the available ones, in this case an auxiliary value is added for the calculation of the cost of use of each "extra-limit" means (e.g. subcontracting);
With all this, we have the scenario prepared to generate a planning solution for a given time and trying to fulfill all the defined requirements.
C. Phase 3 - Generation of the Planning Solution (F3)
It is where, based on the parameterization and the defined scenario (inputs defined in the two previous
http://iraj.in phases (F1 and F2), we generate the planning solution - a result (optimal or suboptimal) containing, in a structured form and for each type of day of the season in question:
Schedules - Definition of public timetables; Vehicle Services - Daily services to allocate
vehicles;
Driver Services - Daily services to allocate drivers;
Note: As we have already mentioned, we only identify the inputs and outputs of the solution generation component (RtP module, [5]) - optimizer module (constraint scheduler) already developed, which was used and integrated (adapted) in this work.
As a result we have a hypothesis of a planning solution, which contains, in a structured way and for each type of day (of the time in question): 1) Schedules - Definition of public timetables, based on all trips made, for all lines, for each type of day; 2) Vehicle Services - Daily services to allocate vehicles, based on all trips made, grouped by service (and respective blocks), for all lines, for each type of day; 3) Driver Services - Daily services to allocate drivers based on all trips made, grouped by service (and respective stages), for all lines, for each type of day.
D. Phase 4 - Result Analysis - Planning Solution (F4)
In the fourth phase, we analyze the result obtained, i.e. output of the RtP module that corresponds to a possible solution to the intended planning.Indicators are provided that will aid in the evaluation of each result by the operator, in order to move towards the activation of a particular planning solution.A solution can be activated or simply recorded for further analysis and decision.
E. Phase 5 - Activation of a Planning (F5)
In the fifth step, it is where we activate a planning, after choosing a certain result (the solution we want for the planning) we will operationalize a planning from a certain date in the calendar.
A. Phase 6 - Allocation of Services (Operational Planning)
Lastly, the sixth phase, represents the link between planning and operational management, where we will allocate the vehicles and driver to their respective services for each calendar day. This operational planning is part of the service structure already "mapped" in the available means and assigns each service to each vehicle or driver taking into account its type (competence to do so).
In summary, a planning solution has, for each day type: 1) The schedules of the lines; 2) A set of services in which each corresponds to what a vehicle (of a certain type) has to do during a day ("plate") - the daily number of services is therefore the number of vehicles
that are used each day; 3) A set of services in which each corresponds to what a driver (of a certain type) has to do during a day ("board") - the daily number of services is therefore the number of drivers that are used each day.During the day-to-day operation, typically at the beginning of each week, the operator allocates means to services of the same type. For this, a simple interface is provided that allows to automate part of this process and thus help the operator to allocate each vehicle or driver to each service. At this stage, we can handle issues such as vehicles "operational unavailability" (breakdown, accident, etc.) contemplated in the generation of the planning solution. As mentioned, it is fundamental to provide the operator with the tools to view and edit the map of the allocation of services to the means - in both directions, vehicles and drivers.
IV. TESTING
The developed process and software developed was tested with good results in Brazil at with Coesa, an operator from the city of Rio de Janeiro.This company, small in size for the Brazilian reality, has about 200 buses that serve about 20 lines, urban and semi-urban. For details about results see [5]. This configuration of lines is ideal for conducting this type of test, since it mixes a typically urban reality (Niterói - Center of Rio de Janeiro) with a semiurban one, which runs longer journeys from the western part of the state of Rio de Janeiro. Typically, these urban lines have high frequencies of departure, with no major differences throughout the day (very high and constant demand); on the contrary, semi-urban lines have a much smaller number of journeys, concentrated at morning rush hour and afternoon.From the point of view of the planning and the management of the operation, this company presents some degree of maturity, when compared with other companies of the same sector that operate in the same reality and geography, in particular: 1) Have a team dealing with planning and other with the operational management; 2) For the planning, it has two elements that deal with the generation of the plan for the time and the allocation of resources to services - a task that is done weekly; 3) For the operation, there are six operators that are organized in shifts and whose function is the daily control of the operation, the importation of the services for each season (including adjustments) and weekly import of service allocation vehicles and drivers.
In terms of planning, this company regards it as the base on which the operation is based, that is, the control of the operation is carried out with the objective of enforcing the defined plan, both in terms of schedules, in terms of services and respective allocations to vehicles and drivers. This is a situation that already shows some evolution in terms of its organization, which does not always happen, especially in this South American reality - often the
http://iraj.in operation tends and focus almost 100% on the aspects of regularity,considering the momentary demand that exists in each line / location.
CONCLUSION
We developed one process around an optimization tool to help the planning phase of public transportation, considering several constrains with the possibility of re-planning. The attributes identified and used to typify the means and the more general aspects of the operation, represent an important balance between the complexity of this type of parameterization (they often typify a reality that is not homogeneous and therefore difficult to characterize) and the simplicity of understanding that must be behind this kind of parameterization - otherwise, they are not understood and much less used, thus generating less dynamic and optimized planning solutions. In terms of the solutions generated and the methodology used (restrictions resolvers in the full search version, with an adaptation of a local search version), the scheduling components and the generation of vehicle services are typically of good
quality, reflecting in a clear way the parametrizations / restrictions of each scenario. In particular, the services of the vehicles have a very coherent structure, evidencing in an obvious way the weights related to the most relevant restrictions (the most used ones): line changes, empty distances traveled, and number of vehicles used.The times associated to the generation of solutions are perfectly framed within the defined as reasonable for a tool, although with planning functions, of an operational nature.
REFERENCES
[1] M.R. Bussieck, P. Kreuzer, and U.T. Zimmermann, Optimal lines for railway systems, Eur J Oper Res 96 (1997), 54–63. [2] M.T. Claessens, N.M. van Dijk, and P.J. Zwanefeld, Cost
optimal allocation of rail passenger lines, Eur J Oper Res110 (1998), 474–489.
[3] J.-W. Goossens, S. van Hoesel, and L. Kroon, A branch-and-cut approach for solving railway line planning problems, Transp Sci 38 (2004), 379–393.
[4] J.-W. Goossens, S. van Hoesel, and L. Kroon, On solving multi-type railway line planning problems, Eur J Oper Res 168 (2006), 403–424.
[5] Marcelo. Master Thesis at IST in Lisbon 2017. XTP Planner - Time and Service Planner Module for an Operational Management Platform for a Public Transport Operator