A MODEL OF RATING FOR BANKS IN ROMANIA
Bǎtrâncea Ioan
Babeş-Bolyai University, Faculty of Economics and Business Administration, Cluj-Napoca, Romania
Bǎtrâncea Maria
Bogdan Voda University, Faculty of Economics, Cluj-Napoca, Romania
Popa Anamaria
Bogdan Voda University, Faculty of Economics, Cluj-Napoca, Romania
Ţiplea Augustin
Babeş-Bolyai University, Faculty of Economics and Business Administration, Cluj-Napoca, Romania
Abstract.In the paper the authors present a model of rating for the banking system. Thus we took into account the records of 11 banks in Romania, based on annual financial reports. The model classified the banks in seven categories according with notes used by Standard Poor’s and Moody’s rating Agencies. Key Words: rating, Basel III, bankruptcy
JEL Classification: G21
1. Introduction
In the recent research many authors tried to develop models of rating for economic entities and also for the banking system. Also the Central Bank classified the Romanian banking system into 5 rating categories, from 1 (maximum) to 5 (minimum).
Thus between 2003 and 2010 non bank was classified in rating 1, around 60% took rating 2.
That’s why we consider that a new rating model based on Basel III norms will be useful for the bankers.
2. Method and Results
The rating model was developed from tests conducted on 11 banks. In this model have been analyzed many financial indicators that ensure coverage of all financial issues that impact on future business and profits.
Among the analyzed indicators financial ratios for liquidity and performance were selected. In the model thus created I have established seven rating categories designed based on the new Basel III Norms (Supervision Basel Committee on Banking, 2010: 44) as follows:
Rating Score
Minimum Risk AAA 12
Reduced Risk AA 11
Reduced - Medium Risk A 10
Medium Risk BBB 9
Medium - High Risk BB 8
- “AAA” Category - financial performance is great, the risk is minimal. It is considered to maintain in the future the financial performance at a high level;
- “AA” Category - financial performance is good, thus the risk is reduced, the results of the cooperative are stable in the short term;
- “A” Category – financial performance is above average, satisfactory, the risk is fluctuating between low and medium;
- “BBB” Category – financial performance is at an average level compared to the optimal result, risk is medium;
- “BB” Category – financial performance is reduced below medium or records negative results, the risk is increasing from a medium to a higher level;
- “B” Category – financial performance are weak, poor, presents a high risk;
- “CCC” Category – financial performance is very weak, with high risk of bankruptcy.
Classification in any of the above categories is based on financial performance analysis, depending on the score for each indicator presented in the table below.
Financial security intervals and their scores have been established taking into consideration the new Basel III Norms and the banking practice in our country.
Table no.1 Scores for indicators presented in the model
(Long and Medium term loans +Equity) /Investments
(>= 1,25)
>=1,25 >1 >0
3 2 1
Equity / Total Liabilities (>= 15%)
>=15% <=10% >10%
3 2 1
Total Expenses/ Turnover (<= 5%)
<=5% >=10% <10%
3 2 1
Cash Flow / Total Assets (>= 3, 5%)
>=4% <=3% < 3%
3 2 1
Source: Personal Calculation
Table no.2 Performance categories, limits and scores representative for the Rating Mod
indicators Year Year Year Year Year Year
2006 2007 2008 2009 2010 2011
% % % % % %
BALANCE SHEET DATA
Placements 99.944.491 85% 73.079.856 85% 124.373.445 87% 169.921.487 84% 176.154.362 84% 196.111.973 86% Other Current Assets 1.302.956 1% 819.505 1% 1.135.605 1% 1.490.642 1% 1.690.026 1% 769.295 0% Fixed Assets 16.020.810 14% 11.764.304 14% 18.197.535 13% 30.966.910 15% 31.032.080 15% 31.430.039 14% TOTAL ASSETS 117.268.257 100% 85.663.665 100% 143.706.585 100% 202.379.039 100% 208.876.468 100% 228.311.308 100% Short term Loans 6.397.332 5% 7.191.914 8% 8.898.573 6% 13.266.122 7% 15.935.424 8% 5.252.660 2% Medium and long term loans 75.002.639 64% 51.288.186 60% 87.514.653 61% 115.200.891 57% 117.347.201 56% 143.238.616 63% Equity 35.868.286 31% 27.183.565 32% 47.293.359 33% 73.912.026 37% 75.593.843 36% 79.820.031 35% TOTAL LIABILITIES 117.268.257 100% 85.663.665 100% 143.706.585 100% 202.379.039 100% 208.876.468 100% 228.311.307 100% DATA FROM PROFIT AND LOSS ACCOUNT Turnover 19.647.339 15.521.519 21.751.848 29.670.515 30.121.317 31.869.201 Borrowing Costs 6.560.067 4.838.006 7.602.055 11.288.475 12.405.185 11.153.760 Results 4.048.418 2.574.402 2.682.452 2.501.958 1.713.801 2.279.259
Main Indicators Value Scoring Value Scoring Value Scoring Value Scoring Value Scoring
DTL+CP/ Placements
(>= 1,25) 1,11 2 1,07 2 1,08 2 1,11 2 1,10 2 1,14 2
CP / Tot. Liabilities (>= 15%) 30,59% 3 31,73% 3 32,91% 3 36,52% 3 36,19% 3 34,96% 3 Ch TOT/ CA (<= 5%) 33,39% 1 31,17% 1 34,95% 1 38,05% 1 41,18% 1 35,00% 1 Cash Flow / Total Assets
(>= 3, 5%) 3,45% 2 3,01% 2 1,87% 1 1,24% 1 0,82% 1 1,00% 1
TOTAL Score 8 8 7 7 7 7
RATING >>>>>> BB >>>>>>>> BB >>>>>>>>> B >>>>>>> B >>>>>>>>> B >>>>>>>> B Region NW B >>>>>>>> B >>>>>>>>> B >>>>>>> B >>>>>>>>> B >>>>>>>> B Region C BBB >>>>>>>> BBB >>>>>>>>> B >>>>>>> B >>>>>>>>> CCC >>>>>>>> B Region NE BB >>>>>>>> B >>>>>>>>> B >>>>>>> B >>>>>>>>> B >>>>>>>> B Region SW BB >>>>>>>> BBB >>>>>>>>> BBB >>>>>>> B >>>>>>>>> BB >>>>>>>> B
Source: Personal Illustration
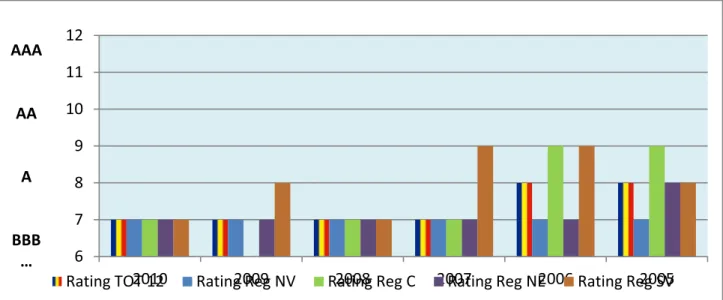
Figure no.1 The rating of the analyzed cooperative banks
I can draw the following conclusions from the above table and chart:
- in the period 2007-2010, analyzed banks both per total and on each region fall in the rating of
“B”, except for banks located in the centre regions (rating “CCC” in 2009) and those located in region southwest which in 2007 registered rating “BBB” and in 2009 have been rated “BB”;
- in 2005-2006 period the development was the following: - “BB” score has been registered per total banks
- The banks in the north-west region have been rated “B”;
- The banks in the center region have been rated “BBB” for the entire period, while the -
banks in the southwest region showed an improvement of qualification from “BB” in 2005 to “BBB” in 2006;
- The banks located in the north-east region have downgraded the rating to “B” in 2006 from “BB” in 2005.
3. Conclusion.
Comparing the results obtained using the CAMPL system and the rating model we found that
between them there is a similarity in that the rating “3” recorded by CAMEL system and rating “BB” and “B”, this meaning a combination of deficiencies that may vary between moderate and
severe requiring careful concern from internal organs in charge of supervision and from the Romanian National Bank.
4. Bibliography
1. Allen, L. Encyclopedia of Money. New York, Checkmark Books, 2001.
2. Allen, L. and Sanders, A. 2004. „Incorporating Systemic Influences into Risk Measurement: A Survey of Literature.”Journal of Financial Services Research, Vol. 26.
3. Altman, E.I. 2005. “An Emerging Market Credit Scoring System for Corporate Bonds.” Emerging Market Review, No.6.
4. Arvanitis, A. and Gregory, J. The Complete Guide to Pricing Hedging and Risk Management..
Risk Books Publishing House, London, 2004.
6 7 8 9 10 11 12
2010 2009 2008 2007 2006 2005
AAA
AA
A
BBB …
5. Balthazar, L. From Basel 1 to Basel 3. The Integration of the State-of-the-Art Risk Modeling in Banking Norm. Palgrav Macmillan, New York, 2006.
6. Banks, E. and Dunn, R. Practical Risk Management. An Executive Risk to Avoiding Surprises and Losses. John Wiley & Sons, Ltd, Chichester, 2003.
7. Bhatia, M. Credit Risk Management & Basel II, An Implementation Guide. Risk Books, London, 2006.
8. Busch, A. Banking Norm and Globalization. Oxford University Press Publishing House, USA, 2008.
9. Gleeson, S., International Norm of Banking: Basel II, Capital and Risk Requirements. Hardcover, 2010.
10. Greuning, H v. and Bratanovic Brajovic, S. Analysis and Banking Risk Management. Irecson Publishing House, Bucharest, 2004.